DOPAMINE-MEDIATED ALTERATIONS IN BRAIN-WIDE FUNCTIONAL DYNAMICS MEASURED BY fMRI
Heather Kaye Decot
A dissertation submitted to the faculty at the University of North Carolina at Chapel Hill in partial fulfillment of the requirements for the degree of Doctor of Philosophy in the Biological and Biomedical
Sciences Program (Neuroscience Curriculum) in the Graduate School.
Chapel Hill 2017
Approved by:
Garret D. Stuber
Yen-Yu Ian Shih
John H. Gilmore
Joyce Besheer
Fulton T. Crews
ABSTRACT
Heather Kaye Decot: Dopamine-Mediated Alterations in Brain-Wide Functional Dynamics Measured by fMRI
(Under the direction of Garret D. Stuber)
Drug addiction is a complex, multifaceted disease characterized by compulsive drug-seeking and drug-taking behavior despite adverse consequences. In accordance with its complex nature, several neural systems are likely to be dysregulated to promote maladaptive behaviors associated with addiction. For instance, dopaminergic signaling within the mesolimbic dopamine (DA) system is thought to be critical for reward prediction, an adaptive process that likely goes awry in addiction. While it is well known that DA release events occur in
self-administration orchestrates dynamic shifts in functional connectivity across many anatomically defined neuronal network nodes. Overall, these findings suggest that DA not only controls plasticity in direct target regions, but may effectively modulate brain-wide network plasticity as well. This research may provide critical insight into the circuit-level maladaptations that
I dedicate this work to my Grandma, Grandpa, Grammy and Grandpa Schmidt. Thank you for your guidance, protection and for always cheering me on. I am so proud to be your
ACKNOWLEDGEMENTS
I would first like to thank my thesis mentor, Garret Stuber. It has been an incredible honor being a member of your lab. Thank you for your guidance and support and for allowing me to bridge optogenetics and fMRI through my experiments. Your fearlessness and abilities to adapt and grow in the ever-changing world of scientific research are unmatched and it has been so neat to be able to be a part of the evolution of this lab over these past 6 years. I have learned so much from you, and will walk with confidence and pride into the next stage of my career because of it. To Ian, your lab was a second home to me. Thank you for allowing me to be a part of your lab. Your generosity and kindness have meant so much to me. Some of my fondest memories from graduate school are from the ISMRM conferences that I had the privilege to attend.
To my lab mates past and present, thank you for always being there for me and for
assisting me whenever I have needed help or guidance. I have learned so much from each of you and have loved talking both science and life together over these past 6 years. To Manasmita, your constant support and encouragement has meant more than you will ever know. You were there every step of the way. Thank you for your friendship and sisterhood. To Oksana, thank you for always being there for me and for all of your help and encouragement. To Vijay and SungHo, thank you for your data analysis expertise and friendships. You have taught me so much and it was such a pleasure being able to work with you. To Jill and Hsin-yi, thank you for your warmth and kindness and dedicating so much of your time to teaching me about MRI acquisition when I first started in lab. Your support over the years has meant so much to me.
unwavering support. To Gina, thank you so much for opening your lab to me and for always supporting me and my endeavors, it has meant so much to me. To Dr. Gilmore, thank you for being my clinical co-mentor for the HHMI translational medicine program and for allowing me to shadow you in the clinic, I truly enjoyed those experiences. To Joyce, thank you for
supporting me and for always e-mailing me after my departmental talks with kind and encouraging words. To Dr. Crews, thank you for your guidance and for your insightful comments and enthusiasm related to my work.
TABLE OF CONTENTS
LIST OF FIGURES ... xi
LIST OF ABBREVIATIONS AND SYMBOLS ... xiii
CHAPTER 1: GENERAL INTRODUCTION ... 1
HISTORY OF DOPAMINE AS A NEUROTRANSMITTER………...1
CELLULAR COMPOSITION OF THE VTA ... 2
VTA CIRCUITRY ... 5
Connectivity within the VTA ... 5
Afferent Projections to the VTA ... 6
Efferent Projections of the VTA ... 10
EVIDENCE FOR THE ROLE OF DOPAMINE IN REWARD AND MOTIVATION ... 15
ROLE OF DOPAMINE IN DRUG ADDICTION ... 17
OVERVIEW OF OPTOGENETICS ... 19
OPTOGENETIC fMRI ... 22
OVERVIEW OF FUNCTIONAL MRI (fMRI): TASK-BASED VERSUS RESTING STATE fMRI ... 23
DISSERTATION ... 24
CHAPTER 2: COORDINATION OF BRAIN-WIDE ACTIVITY DYNAMICS BY DOPAMINERGIC NEURONS ... 26
INTRODUCTION ... 26
METHODS ... 29
Experimental Subjects and Stereotactic Surgery ... 29
Data Processing and Statistical Analysis ... 32
Histology, Immunohistochemistry, and Microscopy ... 38
RESULTS ... 38
Viral Targeting of VTA Dopaminergic Neurons in TH-Cre Rats ... 38
Whole Brain Analysis of the Effect of THVTA Neuron Stimulation ... 39
Whole Brain Analysis of Forepaw Stimulation Pre and Post Pairing with THVTA Neuron Stimulation ... 43
DISCUSSION ... 44
FIGURES ... 51
CHAPTER 3: BRAIN-WIDE FUNCTIONAL CONNECTIVITY CHANGES FOLLOWING SELF-ADMINISTRATION OF COCAINE AND ABSTINENCE ... 59
INTRODUCTION ... 59
METHODS ... 61
Experimental Subjects ... 61
fMRI Procedures ... 61
Cocaine Self-Administration ... 62
Data Pre-Processing ... 63
Functional Connectivity Analysis ... 63
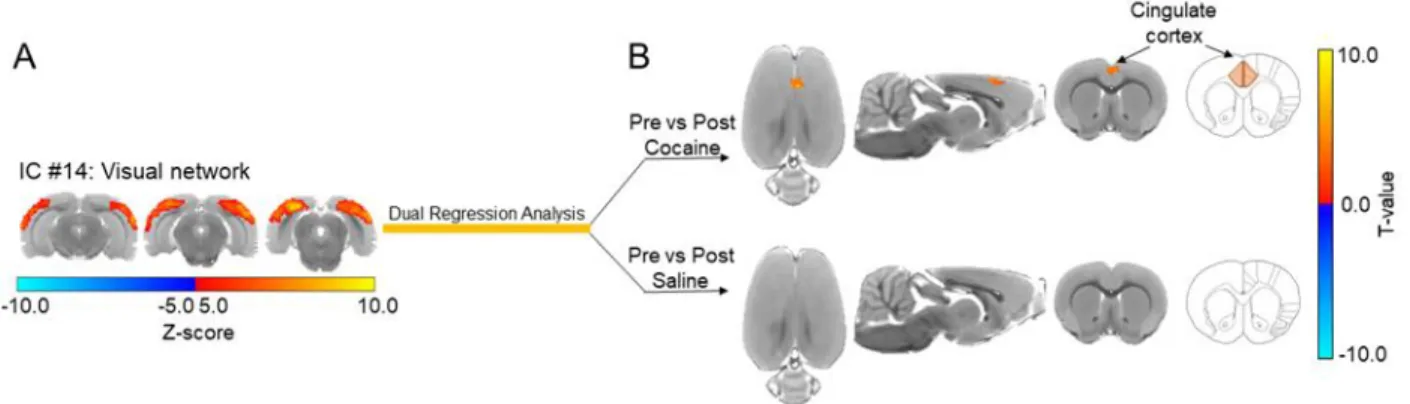
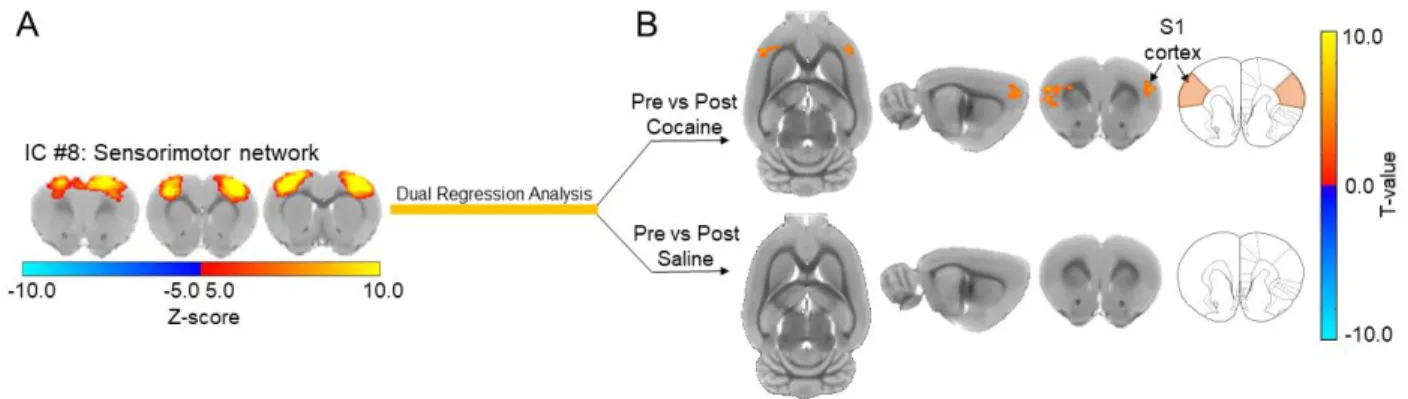
Dual Regression Analysis………...…64
RESULTS ... 65
DISCUSSION ... 67
FIGURES ... 72
CHAPTER 4: GENERAL DISCUSSION ... 80
SUMMARY OF FINDINGS ... 80
GENERAL IMPLICATIONS OF FINDINGS ... 81
Anesthesia ... 84
Light and Heating Artifacts During Opto-fMRI Experiments ... 85
Imaging Resolution ... 85
FUTURE DIRECTIONS ... 86
To Explore the Permanence of our Findings ... 86
To Explore Sex- and Age-Based Brain Functional Connectivity Differences Following Cocaine Exposure. ... 87
APPENDIX 1: SUPPLEMENTAL MATERIALS FOR CHAPTER 2 ... 90
APPENDIX 2: SUPPLEMENTAL MATERIALS FOR CHAPTER 3 ... 99
LIST OF FIGURES
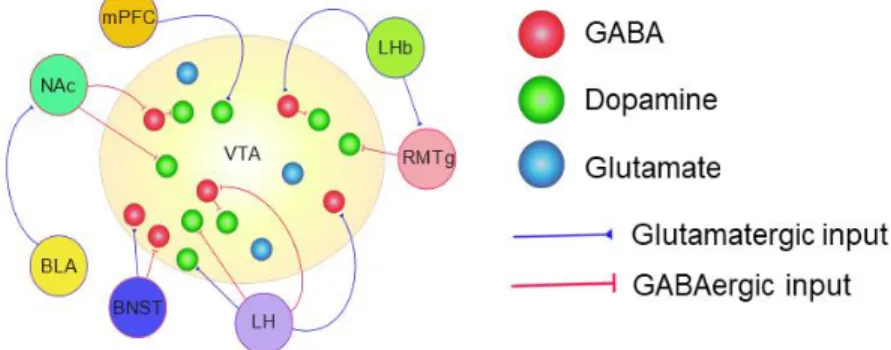
Figure 1.1: Afferent projections to the VTA. ... 8
Figure 2.1: Viral targeting of VTA dopaminergic neurons in TH-cre rats. ... 51
Figure 2.2: Optical fiber placement in the VTA of TH-cre rats. ... 52
Figure 2.3: Whole brain analysis of the effect of THVTA neuron stimulation. ... 53
Figure 2.4: Map of defined regions of interest. ... 55
Figure 2.5: Whole brain analysis of forepaw stimulation pre and post pairing with THVTAneuron stimulation. ... 56
Figure 2.6: Evolution of forepaw stimulation pairing response over the course of pairings. ... 58
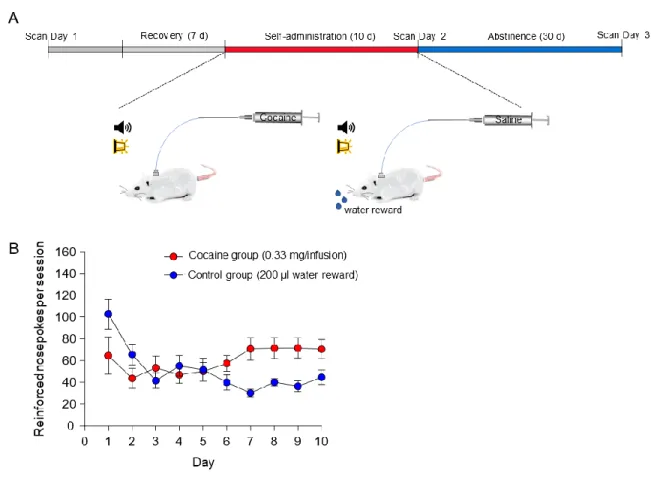
Figure 3.1: Experimental timing diagram and self-administration training data. ... 72
Figure 3.2: Resting state networks derived from the multi-subject ICA analysis. ... 73
Figure 3.3: Cocaine exposure causes a significant increase in functional activity between the visual network and the anterior cingulate cortex in drug naïve rats. ... 75
Figure 3.4: Cocaine exposure causes a significant increase in functional connectivity between the sensorimotor network and the primary somatosensory cortex in drug naïve rats. ... 76
Figure 3.5: Cocaine exposure causes an increase in functional connectivity between the somatosensory network and the anterior cingulate cortex in drug naïve rats. ... 77
Figure 3.6: Cocaine exposure causes a decrease in functional connectivity between the hippocampal network and the insular cortex in drug naïve rats. ... 77
Figure 3.7: Seed-based whole brain connectivity maps of pre-cocaine and post-cocaine rsfMRI data ... 78
Figure 3.8: Functional connectivity changes following cocaine exposure in drug naïve rats. ... 79
Figure A.1: Optical fiber placements in the VTA of TH-cre rats. ... 90
Figure A.2: Activation of VTA dopaminergic neurons increases CBV signals in striatal target regions. ... 91
Figure A.4: Whole brain analysis of the effect of 1 s THVTA neuron stimulation. ... 95 Figure A.5: Optical fiber placements in the VTA of TH-cre rats for the pairing
experiments. ... 96 Figure A.6: Pairing VTA dopamine neuronal activity with somatosensory stimuli
enhances the neuronal representation of the sensory stimulus. ... 97 Figure A.7: Additional results for the forepaw stimulation pre and post pairing
with THVTA stimulation. ... 98 Figure A.8: The independent components derived from the multi-subject ICA
analysis that were excluded from further analysis due to noise artifacts. ... 99 Figure A.9: Seed-based whole brain connectivity maps of pre-cocaine and
LIST OF ABBREVIATIONS AND SYMBOLS AAV Adeno-associated virus
AFNI Analysis of Functional NeuroImages ANOVA Analysis of variance
BLA Basolateral amygdala
BNST Bed nucleus of the stria terminalis BOLD Blood-oxygen-level dependent CBV Cerebral blood volume
CDC Centers for disease control and prevention CeA Central nucleus of the amygdala
ChR2 Channelrhodopsin-2 CPu Caudate putamen D1R D1-receptor D2R D2-receptor DA Dopamine
DAT Dopamine transporter DBS Deep brain stimulation
DIO Double-floxed inverted open reading frame DMS Dorsomedial striatum
EF1α Elongation factor 1-alpha EPI Echo-planar imaging EtCO2 End-tidal carbon dioxide
fMRI Functional magnetic resonance imaging FOV Field of view
GABA Gamma-aminobutyric acid GLM Generalized linear model HPC Hippocampus
HRF Hemodynamic response function
Ih Hyperpolarization-activated cation current IPN Interpeduncular nucleus
LH Lateral hypothalamus LHb Lateral habenula L-DOPA Levodopa
NAc Nucleus accumbens mPFC Medial prefrontal cortex
MION Monocrystalline iron oxide nanoparticles NpHR Halorhodopsin
opto-fMRI Optogenetic-functional magnetic resonance imaging OVX Ovariectomized
PBS Phosphate buffered saline PC Principal component
ROI Region of interest RF Radio frequency
rsfMRI Resting state functional magnetic resonance imaging rTMS Repetitive transcranial magnetic stimulation
S1 Primary somatosensory cortex SEM Standard error of the mean SNc Substantia nigra pars compacta SPM Statistical parametric mapping SpO2 Oxygen saturation
TH Tyrosine hydroxylase
THVTA Ventral tegmental area dopaminergic neurons
TE Echo time
TR Repetition time
CHAPTER 1: INTRODUCTION HISTORY OF DOPAMINE AS A NEUROTRANSMITTER
Although first synthesized in 1910, our modern understanding of dopamine (DA) function in the brain began in the late 1950s when Arvid Carlsson discovered that DA not only serves as a precursor for norepinephrine and epinephrine but is also a neurotransmitter itself (Carlsson, Lindqvist, Magnusson, & Waldeck, 1958). In a set of seminal experiments, Carlsson and colleagues measured catecholamine expression across the dog brain and reported high concentrations of DA in the striatum, despite norepinephrine levels being low in this region (Bertler & Rosengren, 1959; Carlsson, 1959). Furthermore, reserpine, a vesicular monoamine transport (VMAT) inhibitor which causes the depletion of monoamine neurotransmitters in the synapse, caused a loss of movement control in mice and rabbits, a core symptom of Parkinson’s disease (Carlsson, Lindqvist, & Magnusson, 1957). Notably, injecting levodopa (L-DOPA), the precursor to DA, reversed the reserpine-induced immobility. Carlsson initially hypothesized this effect was due to the ability of L-DOPA to restore norepinephrine in the basal ganglia, however found a resurgence of DA instead. In 1960, Oleh Hornykiewicz would provide a critical
Parkinson’s disease and observed significant and rapid alleviation of symptoms (Birkmayer & Hornykiewicz, 1961). More than 50 years later, L-DOPA is still considered the most effective drug treatment for the management of Parkinson’s disease.
Taken together, these discoveries provided the first evidence that, contrary to the prevailing notion of the first half of the 20th century that DA had limited function beyond being an intermediate for norepinephrine and epinephrine, dopaminergic signaling within the basal ganglia is critical for the control of motor function and its loss plays a significant role in the pathogenesis of Parkinson’s disease. The scope of the diversity and complexity of the role of DA signaling in the brain, beyond motor control, would begin to widen greatly in subsequent decades.
CELLULAR COMPOSITION OF THE VTA
disease, whereas the VTA is heterogeneous in cell type composition and projects to the ventral striatum, and to other limbic and cortical structures including the amygdala, septum,
hippocampus, and prefrontal cortex (Swanson, 1982). The VTA is comprised of DA (~65%), GABA (~30%), and glutamate (<5%) neurons (Dobi, Margolis, Wang, Harvey, & Morales, 2010; Margolis, Lock, Hjelmstad, & Fields, 2006; Nair-Roberts et al., 2008). Notably, however, several studies using slice electrophysiology have now explicitly shown that a subset of VTA DA neurons co-release DA with glutamate or GABA which are also capable of postsynaptic signaling (Chuhma et al., 2004; Hnasko et al., 2010; Lavin et al., 2005; Stuber, Hnasko, Britt, Edwards, & Bonci, 2010; Tecuapetla et al., 2010; Tritsch, Ding, & Sabatini, 2012; Tritsch, Oh, Gu, & Sabatini, 2014). Future work investigating the effects of coincidental signaling by glutamate and GABA will need to be performed to further our understanding of the functional significance of neurotransmitter co-release from VTA DAergic neurons.
The electrophysiological properties of VTA DA neurons are also diverse. Although initial reports specified a large hyperpolarization-activated inwardly rectifying cation current (Ih) as physiological criteria for the identification of midbrain dopaminergic neurons, this is no longer accurate (Johnson & North, 1992; Mercuri, Bonci, Calabresi, Stefani, & Bernardi, 1995). It has now been well documented that several non-dopaminergic VTA neurons exhibit Ih current (Margolis, Hjelmstad, Bonci, & Fields, 2003; Margolis et al., 2006; T. A. Zhang, Placzek, & Dani, 2010), and furthermore a subset of dopaminergic neurons that project to the mPFC lack Ih current altogether (Lammel et al., 2008). Thus, coupling electrophysiology with retrograde neuronal labeling and immunohistochemistry staining techniques (i.e. for tyrosine hydroxylase
(TH), the rate-limiting enzyme in DA biosynthesis) is important to aid in the proper
vary based on the positioning of these neurons within the VTA as well as their projection targets (Ford, Mark, & Williams, 2006; Lammel et al., 2008). DA neurons situated more laterally within the VTA exhibit larger amplitude Ih relative to those positioned in the medial VTA (T. A. Zhang et al., 2010). Consistent with this, a retrograde tracing study found that VTA DA neurons that project to the BLA exhibit large Ih amplitudes and are situated primarily in the
anterior/lateral portions of the VTA whereas projection fibers to the NAc have significantly smaller Ih and originate in the posterior/medial regions (Ford et al., 2006).
Finally, several studies also indicate a high degree of molecular heterogeneity among midbrain DA neurons. The biosynthetic pathway of DA begins with the conversion of
of individual DA neurons within the midbrain (Lammel et al., 2008; Poulin et al., 2014; Stamatakis et al., 2013).
VTA CIRCUITRY
Connectivity within the VTA
Within the VTA, GABA neurons form local, direct synaptic connections onto VTA DA neurons (Johnson & North, 1992; van Zessen, Phillips, Budygin, & Stuber, 2012). VTA GABA neuron stimulation both in vitro and in vivo have shown to reduce the activity and excitability of VTA DA neurons(Tan et al., 2012; van Zessen et al., 2012). Indeed, van Zessen and colleagues demonstrated that DA release in the NAc in response to electrical stimulation of VTA DA neurons is significantly attenuated by coincidental VTA GABA neuron activation. Furthermore, VTA GABA neuron activation disrupts reward consumption (van Zessen et al., 2012) and causes a conditioned place aversion (Tan et al., 2012). Conversely, optogenetic inhibition of VTA GABA neurons leads to an increase in VTA DA activity (Bocklisch et al., 2013). Taken together, these findings suggest that local VTA GABA neurons are a potent modulator of DAergic output and their drive onto VTA DA neurons may be critical for the initiation of aversion-related behavior.
It has also recently been discovered that VTA glutamatergic neurons establish local excitatory synapses with VTA DAergic neurons that project to the NAc (H.-L. Wang, Qi, Zhang, Wang, & Morales, 2015). Local synaptic glutamate release from VTA glutamatergic neurons through the activation of glutamate receptors on neighboring DA neurons was shown to promote rewarding behavioral phenotypes including optical self-stimulation and place preference.
D2 autoreceptors causing autoinhibition of these cells (Bernardini, Gu, Viscardi, & German, 1991; White & Wang, 1984).
Afferent Projections to the VTA
The VTA receives several excitatory and inhibitory inputs from both cortical and subcortical structures which are discussed in detail below (Figure 1.1). Recent advances in anatomical mapping experiments using rabies virus-based transsynaptic retrograde tracing have greatly expanded our understanding of the synaptic connectivity within the VTA, by validating previously known anatomical inputs to the VTA as well as identifying new inputs (Beier et al., 2015; Faget et al., 2016; Watabe-Uchida, Zhu, Ogawa, Vamanrao, & Uchida, 2012). Building a comprehensive map that identifies the specific inputs onto VTA DAergic and non-DAergic neurons, as well as determining how they modulate the activity of these cells is critical for our understanding of how the midbrain regulates adaptive behaviors such as reward prediction but also how maladaptive alterations within these circuits can lead to the manifestation of
neuropsychiatric disease such as drug addiction.
Lateral hypothalamus (LH)
The lateral hypothalamus (LH) is composed of diverse genetically distinct cell types, sending glutamatergic, GABAergic, and peptidergic projections to the VTA involved in homeostatic physiology and motivated behavior. In fact, the LH provides one of the largest subcortical inputs to the VTA (Geisler, Derst, Veh, & Zahm, 2007; Nieh et al., 2015; Phillipson, 1979; Watabe-Uchida et al., 2012). Rodents that have received lesions of the LH exhibit
insatiable food intake behavior (Anand & Brobeck, 1951b; Delgado & Anand, 1953) and
persistent intracranial self-stimulation (Olds & Milner, 1954). Furthermore, LH self-stimulation has been found to cause release of DA in the NAc (Hernandez & Hoebel, 1988; You, Chen, & Wise, 2001). Taken together, these findings suggest that LH input to the VTA, possibly via drive onto VTA DA neurons, is an important pathway in the activation of brain reward circuits as well as reinforcing behavioral responding.
The immense heterogeneity of the LH has been an obstacle for elucidating the exact circuit mechanisms underlying its role in motivated behavior. A recent study by Nieh and colleagues demonstrated that both glutamatergic and GABAergic LH fibers functionally innervate both VTA GABA neurons and VTA DA neurons (Nieh et al., 2015). GABAergic projection fibers from the LH preferentially innervate VTA GABA neurons, reducing local activity-dependent GABA release onto VTA DA neurons and thus causing disinhibition of these cells. More cell-type specific optogenetic targeting approaches will need to be performed to further disentangle the functional heterogeneity of the LH and its projection targets.
Medial Prefrontal Cortex (mPFC)
The medial prefrontal cortex (mPFC) provides another main source of glutamatergic input to the VTA (Geisler, Derst, Veh, & Zahm, 2007). VTA-projecting mPFC neurons are found predominantly in layer 5 of the cortex (Gabbott, Warner, Jays, Salway, & Busby, 2005) and through the use of electron microscopy, Carr and Sesack found that they preferentially synapse onto mPFC-projecting VTA dopaminergic neurons and NAc-projecting VTA
performed to provide more insight on the specific synaptic connectivity between these two regions and the role this circuit plays on complex behavioral and affective states.
Lateral Habenula (LHb)
The lateral habenula (LHb) provides another important source of glutamatergic drive into the VTA. The LHb encodes negative reward prediction error and is activated by aversive
stimuli/reward omission and inhibited by unexpected rewards (Matsumoto & Hikosaka, 2007, 2009). Activation of the LHb almost completely abolishes the activity of midbrain DA neurons (Christoph, Leonzio, & Wilcox, 1986) and leads to reduced DA release in the NAc (Lisoprawski, Herve, Blanc, Glowinski, & Tassin, 1980). The LHb sends direct glutamatergic inputs to the VTA that are confirmed to form synapses predominantly onto GABAergic neurons (Brinschwitz et al., 2010; Lammel et al., 2012; Stamatakis & Stuber, 2012) that inhibit DA VTA activity. Consistent with this, local application of the GABAA receptor antagonist bicuculline into the VTA attenuates LHb-induced suppression of DA neuron activity (Ji & Shepard, 2007). In addition to modulating VTA DAergic activity through its glutamatergic drive onto VTA GABAergic neurons, the LHb also sends glutamatergic inputs onto the rostromedial tegmental nucleus (RMTg), a GABAergic
structure just posterior to the VTA, that directly inhibits VTA DA neurons (Jhou, Fields, Baxter, Saper, & Holland, 2009; Jhou, Geisler, Marinelli, Degarmo, & Zahm, 2009). Exposure to acute
Figure 1.1: Afferent projections to the VTA.
unpredictable footshock in mice increased LHb excitatory drive onto RMTg neurons and optogenetic stimulation of this pathway promoted behavioral avoidance (Stamatakis & Stuber, 2012). Taken together, the LHb is a critical node of the reward circuit by providing negative value signals to DAergic neurons of the midbrain, and thus important for survival by promoting punishment avoidance behaviors.
Nucleus Accumbens (NAc)
The nucleus accumbens (NAc) sends a major GABAergic projection to the VTA
(Heimer, Zahm, Churchill, Kalivas, & Wohltmann, 1991; P. W. Kalivas, Churchill, & Klitenick, 1993; Nauta, Smith, Faull, & Domesick, 1978). D1-receptor expressing medium spiny neurons (MSNs) of the NAc preferentially target VTA GABA neurons (Bocklisch et al., 2013; Hjelmstad & Fields, 2003). Furthermore, activating GABAA receptors in the VTA increases DA release in the NAc (Xi & Stein, 1998). Taken together, these results suggest that activation of GABAergic afferents from the NAc and other regions may cause a transient increase in VTA DA activity via a disinhibitory mechanism and may provide a putative mechanism for the persistent
reinforcement behavior induced by optogenetic stimulation of D1-receptor expressing MSNs of the NAc (Kravitz, Tye, & Kreitzer, 2012). GABAergic inputs from the NAc also form synapses directly onto VTA DA neurons (Watabe-Uchida et al., 2012), however the inhibitory projection onto VTA GABA neurons is much more robust (Bocklisch et al., 2013).
Bed Nucleus of the Stria Terminalis (BNST)
important question to unravel. Jennings, Sparta and colleagues found that the BNST sends both glutamatergic and GABAergic inputs to the VTA that preferentially synapse onto VTA
GABAergic neurons (Jennings et al., 2013). This work revealed that these two distinct neuronal cell type projections have opposing roles. VTA projecting glutamatergic neurons displayed an enhancement in activity following exposure to an aversive stimulus, whereas BNST GABAergic neurons were inhibited. Furthermore, in vivo optogenetic stimulation of BNST glutamatergic inputs to the VTA caused aversion and anxiety, whereas stimulating BNST GABAergic inputs produced reward-related behaviors and anxiolytic effects. Finally, it was found that concurrent stimulation of BNST GABAergic inputs to the VTA during an unpredictable foot-shock session could reduce the development of subsequent anxiety-like behaviors. Taken together, these data reveal how two distinct BNST neuronal projections onto a shared target region can promote very opposing behavioral effects. This may provide new insight as to a potential circuit mechanism underlying neuropsychiatric disorders, especially those related to anxiety, where proper
glutamatergic and GABAergic drive from the BNST onto VTA GABAergic neurons is critical and if one becomes altered, maladaptive behavior ensues.
Efferent Projections of the VTA
preference (Tsai et al., 2009) also caused transient DA release in the NAc, suggesting that associative learning is driven by stimulation frequencies that cause observable DA transients in limbic terminal fields such as the NAc. These projections, as well as the studies that have demonstrated their significance in the expression of motivated behavior are discussed in detail below.
Nucleus Accumbens (NAc)
The NAc receives DAergic, GABAergic, and glutamatergic inputs from the VTA (Brown et al., 2012; Hnasko, Hjelmstad, Fields, & Edwards, 2012; Margolis et al., 2006; Qi et al., 2016; Van Bockstaele & Pickel, 1995; van Zessen et al., 2012). The NAc, commonly referred to as the limbic-motor interface, is a critical node for the manifestation of learned associations between environmental stimuli and primary reinforcers, and in translating this information into
conditioned approach behavior (Mogenson, Jones, & Yim, 1980). DAergic projections from the VTA to the NAc comprise the mesolimbic DA system. During reward-seeking behavior, burst firing of these neurons results in phasic DA release in the NAc (Day, Roitman, Wightman, & Carelli, 2007; P. E. M. Phillips, Stuber, Heien, Wightman, & Carelli, 2003; Stuber et al., 2008). Depletion of DA in the NAc or antagonism of DA receptors leads to impairments in acquisition and performance in a Pavlovian conditioning task (Di Ciano & Everitt, 2001). Collectively, these data indicate that activation of midbrain DA neurons, followed by the subsequent release of DA in the NAc, is critical for the expression of learned associations.
enhanced discrimination of a conditioned stimulus that had previously been associated with an aversive outcome during a fear conditioning task (Brown et al., 2012).
VTA glutamatergic neurons, in addition to providing local excitatory drive onto VTA DA neurons that project to the NAc and cause rewarding behavioral effects (H.-L. Wang et al., 2015), also send direct, long-range projections to the NAc. A recent study by Qi et al. found that VTA glutamatergic inputs to the NAc preferentially synapse onto parvalbumin GABAergic interneurons and activation of this pathway promotes conditioned place aversion (Qi et al., 2016). Thus, these data demonstrate that VTA glutamatergic neurons, depending on their postsynaptic target, can regulate two functionally opposing motivational states.
Medial Prefrontal Cortex (mPFC)
The VTA also sends an assortment of DAergic, GABAergic and glutamatergic afferents to the mPFC. Midbrain dopaminergic neurons projecting to the mPFC are thought to modulate cognitive function, including executive functioning, working memory and attentional control (Ridderinkhof, Ullsperger, Crone, & Nieuwenhuis, 2004). A recent study investigating the functional and behavioral relevance of VTA DA neurons that project to the mPFC found that unexpected rewards and cues that predict them cause an increase in their phasic firing activity, however optogenetic stimulation (both tonic and phasic activation) of this pathway does not elicit conditioned place preference (Ellwood et al., 2017). Interestingly, however, it was found that tonic firing activity of mPFC-projecting VTA DA neurons is involved in the maintenance of previously learned cue-reward associations, whereas phasic firing causes deviation from
previously learned associations.
Yücel, & Allen, 2008; Goldman-Rakic & Selemon, 1997; Goldstein & Volkow, 2011). Several studies have used optogenetic tools to understand the role of this circuit in social behavior and the onset of maladaptive behavioral states in rodents. Optogenetic inhibition of
mPFC-projecting DA VTA neurons in mice that had previously undergone subthreshold social defeat, promoted susceptibility to depression-related behaviors and caused reduced social interaction (Chaudhury et al., 2013). Consistent with these findings, optogenetic activation of these neurons reversed social avoidance in depression-susceptible mice following chronic social defeat stress (Friedman et al., 2014). Interestingly, contradictory effects were observed in another report using similar optogenetic methods but in naïve mice. Gunaydin and colleagues found that activation of DA VTA neurons projecting to the mPFC had no effect on social interaction and caused anxiety-like effects and conditioned place aversion (Gunaydin et al., 2014). These paradoxical findings may reflect the difference in the motivational and behavioral states of these mice immediately preceding optogenetic stimulation of this pathway. Still, these findings provide new insights into the neural circuit mechanisms underlying depression, and may in turn advance effective circuit-based treatments for this disease.
As previously mentioned, the VTA also sends glutamatergic projections to the prefrontal cortex and a subset of mesocortical midbrain dopaminergic neurons express vesicular glutamate transporters (vGLUTs), an indicator for their ability to co-release DA and glutamate in their target regions. A recent report demonstrated that non-selective optogenetic stimulation of mesocortical projections to the PFC mediate glutamatergic excitation of mPFC fast-spiking GABAergic interneurons, that in turn inhibit prefrontal cortical pyramidal neurons (Kabanova et al., 2015).
Sesack, 2000a; Taylor et al., 2014), however functional and behavioral relevance of this circuit is currently unknown.
Hippocampus
It is well established that the hippocampus is critically involved in episodic and spatial memory formation (Burgess, Maguire, & O’Keefe, 2002; Squire, 1992). Several studies suggest that DA neurotransmission influences hippocampal plasticity and function (Kulla & Manahan-Vaughan, 2000; Rossato, Bevilaqua, Izquierdo, Medina, & Cammarota, 2009; Sajikumar & Frey, 2004). Anterograde tracing studies have established that the VTA sends fibers that synapse onto several regions of the hippocampus, with CA1 subregion receiving the majority and CA3
subregion and dentate gyrus receiving fewer (Gasbarri, Sulli, & Packard, 1997; Gasbarri, Verney, Innocenzi, Campana, & Pacitti, 1994; Swanson, 1982). Currently, there is not a clear consensus as to how much of the projection from the VTA to hippocampus is DAergic, but these studies report relatively low percentages, ranging from 6-18%. Although the function of VTA drive onto the hippocampus is not well characterized, it has been suggested that DAergic neurons of the VTA form a loop with the hippocampus regulating the conversion of new, salient
information into long term memory storage (Lisman & Grace, 2005). Future studies using afferent-specific optogenetic stimulation of VTA DA fibers to hippocampus will further
Basolateral Amygdala (BLA)
The basolateral amygdala (BLA) is critically involved in forming learned associations between neutral stimuli in the environment and aversive or appetitive outcomes (M. Davis, 1992; Everitt, Cador, & Robbins, 1989; Gallagher & Chiba, 1996; LeDoux, 2000). Notably, the BLA has been implicated in the learned associations that occur with exposure to natural rewards as well as with drugs of abuse. For example, lesioning of the BLA impairs the formation of cocaine conditioned place preference (Fuchs, Weber, Rice, & Neisewander, 2002) and abolishes the ability of drug associated cues to reinstate lever pressing for cocaine following extinction (Meil & See, 1997). While it is known that the BLA receives DAergic input from the VTA (Sadikot & Parent, 1990), functional significance of this circuit has not been extensively explored. However, it has been found that inactivating the BLA attenuates terminal DA release in the NAc following exposure to a cue that predicts a sucrose reward (Jones et al., 2010). These results provide clear evidence that afferents from the BLA to the NAc are capable of modulating DAergic signaling, thus providing a functional mechanism as to how the BLA facilitates associative learning between environmental stimuli and a salient event.
Berridge, Venier, & Robinson, 1989; Gerber, Sing, & Wise, 1981; Ungerstedt, 1971; R. A. Wise & Raptis, 1986; R. A. Wise, Spindler, deWit, & Gerberg, 1978) and to engage in intracranial self-stimulation (Fouriezos, Hansson, & Wise, 1978; Fouriezos & Wise, 1976). Furthermore, several studies in the early to mid-1990s showed that midbrain DA neurons become excited by primary rewards including food, sex, and drugs of abuse which results in phasic DA release in cortical and limbic terminal fields such as the mPFC and NAc (Apicella, Ljungberg, Scarnati, & Schultz, 1991; Hoebel, Mark, & West, 1992; Pfaus et al., 1990; Pfaus, Damsma, Wenkstern, & Fibiger, 1995; R. A. Wise, Newton, et al., 1995; R. A. Wise, Leone, Rivest, & Leeb, 1995).
The ‘dopamine hypothesis of anhedonia’ would be challenged by several studies including the pioneering work led by Wolfram Schultz and colleagues when they showed that while midbrain DA neurons are initially activated by primary rewards, when an animal learns to associate a stimulus with the receipt of a reward, DA neurons will shift their activation response to the cue that predicts the reward (conditioned stimulus) (W. Schultz, Dayan, & Montague, 1997). These findings would lead to their proposal that midbrain DA neurons encode reward prediction errors – signaling the discrepancy between the predicted reward and actual reward received. They found that DA neurons not only responded to a conditioned stimulus that predicts reward but fail to respond to the unconditioned hedonic stimulus if it occurs according to prediction (zero prediction error). Consistent with this, when a conditioned stimulus predicts a reward, but the reward is smaller than predicted or omitted completely, DA neurons are
Midbrain dopaminergic neurons have not only been reported to encode reward prediction errors but also signal the incentive salience of sensory cues (K. C. Berridge & Robinson, 1998). The ‘incentive salience hypothesis’ states that dopamine signaling transforms the neural
representation of a conditioned stimulus from neutral to a cue worthy of attention. In congruence to this hypothesis, research has shown that putative and identified VTA DA neurons respond to salient, but non-rewarding experiences including aversive stimuli and stress (Anstrom & Woodward, 2005; Brischoux, Chakraborty, Brierley, & Ungless, 2009; Herman et al., 1982; Thierry, Tassin, Blanc, & Glowinski, 1976; Tidey & Miczek, 1996). For instance, veterans with post traumatic stress disorder (PTSD) show activity in limbic terminal fields including the amygdala and NAc in response to hearing trauma-related stimuli including gunshots, explosions and other combat sounds (Liberzon et al., 1999). Taken together, these data suggest that DA signaling not only promotes learned associations between rewards and cues that predict them but also between aversive stimuli and their predictive cues. These learned associations will either promote approach or avoidance behavior towards rewarding (i.e. food and sex) and aversive stimuli (i.e. predators) respectively, both of which are critical for the survival of an organism and ultimately its species.
ROLE OF DOPAMINE IN DRUG ADDICTION
General Dr. Vivek Murthy when speaking on the prevalence of substance abuse in this country stated that an estimated 20.8 million people in our country have met the diagnostic criteria for a substance use disorder, which is 1.5 times the number of people who have all cancers combined (“Surgeon General Murthy Wants America To Face Up To Addiction,” 2016). In the U.S., 52,404 people died from drug overdose in 2015, an average of 143 deaths per day (Rudd, Seth, David, & Scholl, 2016). Furthermore, the number of infants being born dependent on drugs is also rising dramatically. A recent report from the Centers for Disease Control and Prevention (CDC) estimates that nearly 24,000 babies were born dependent on drugs in 2013, meaning that roughly one infant is born every twenty minutes in the U.S. dependent on drugs (Ko et al., 2016). It is clear that the consequences of drug addiction and substance misuse are becoming
increasingly grave.
compared to subjects with lower expression levels (Morgan et al., 2002). Likewise, in rodents, Bock et al. found that potentiation of glutamatergic drive onto DA D2 receptor-expressing medium spiny neurons (MSNs) in the NAc promotes resilience towards compulsive cocaine intake and in vivo optogenetic stimulation of these neurons inhibits cocaine self-administration (Bock et al., 2013). Taken together, these results suggest that neuroadaptations following drug exposure as well as individual gene expression profiles that may render an individual more susceptible/resilient to the onset and progression of addiction are very important to continue to investigate and understand.
While the effects of cocaine at the cellular and molecular levels have advanced, how exposure to drugs of abuse and modulation of midbrain DAergic neurons affect network
adaptation across the entire brain has largely been unexplored. The experiments outlined in this dissertation will determine whether large-scale neuronal network dynamics, measured across many distinct neuroanatomical circuit nodes, are directly regulated by activity of VTA dopaminergic neurons.
OVERVIEW OF OPTOGENETICS
techniques that selectively integrate light-gated opsins into the membranes of genetically defined neurons. There are several light-sensitive proteins available for modulating neural circuits both
in vitro and in vivo (Yizhar, Fenno, Davidson, Mogri, & Deisseroth, 2011). Channelrhodopsin-2 (ChR2), a light-gated cation channel derived from the green algae, Chlamydomonas reinhardtii
permits Na+ and other cations to enter the cell in response to blue light (~470 nm), causing optical excitation of the cell. Alternatively, optical inhibition is achieved by the integration of the bacteria-derived light sensitive chloride pump, Halorhodopsin (NpHR) and subsequent illumination with yellow light (~580 nm), causing these neurons to hyperpolarize and inhibit their firing (Gradinaru, Thompson, & Deisseroth, 2008; Han & Boyden, 2007; F. Zhang et al., 2007).
amygdala (CeA) (Tye et al., 2011), ventral hippocampus (vHPC) (Ortiz et al., 2013; Felix-Ortiz & Tye, 2014), and NAc shell (Britt et al., 2012).
Targeting neuronal cell types has also been achieved by using transgenic animals that express an opsin under a cell-type specific neuronal promoter. For example, several mouse lines have been created expressing ChR2 in specific subsets of neurons in several regions across the brain (Arenkiel et al., 2007; H. Wang et al., 2007; S. Zhao et al., 2011). Although this approach provides genetic specificity and millisecond temporal resolution, the spatial specificity is no longer there. The final approach provides a higher degree of spatial targeting by coupling the use of transgenic animals that express Cre recombinase in genetically distinct neurons with the use of Cre-inducible viral constructs. To illustrate, the experiments outlined in Chapter 2 of this dissertation utilize transgenic rats that express Cre recominbase under the control of the tyrosine hydroxylase (TH) gene promoter (Witten et al., 2011). To selectively activate dopaminergic neurons within the ventral midbrain, rats were microinjected with an adeno-associated virus (AAV) carrying a Cre-inducible expression cassette encoding ChR2 fused to an enhanced yellow fluorescent protein (eYFP) under the control of the EF1α promoter into the VTA. Importantly, the Cre-inducible AAV viral vector construct was designed to have the ChR2-eYFP gene inverted and flanked by two loxP sites (Tsai et al., 2009). Although the virus will be transduced by all cells, only those cells expressing Cre recombinase will be able to invert ChR2-eYFP into its functional state. Thus, the opsin will only be functional in the cell type expressing Cre recombinase, which for these experiments are in those neurons that express TH.
OPTOGENETIC fMRI
Global maladaptation in the structure and function of the brain are associated with the onset and progression of several neuropsychiatric disorders, including drug addiction. Although optogenetic strategies have revolutionized the field of neuroscience by providing a means to identify specific circuit components that underlie complex behaviors, it has been difficult to understand how manipulating specific neuronal subpopulations affects network activity
dynamics across the whole brain. With the recent development of optogenetic fMRI, it is now possible to observe macroscale patterns of activity across the whole brain in response to modulation of genetically distinct cell groups. In the first report to combine optogenetics with fMRI, Lee and colleagues found that selective optogenetic stimulation of excitatory neurons in the primary motor cortex (M1) elicited a positive blood oxygen level-dependent (BOLD) response at the site of optical stimulation, whereas in control animals that received laser light delivery but were injected with saline instead of the opsin encoded viral vector, no BOLD signal was detected (Lee et al., 2010). Notably, the optically-driven BOLD signal dynamics and hemodynamic response function were very similar to those observed in the motor cortices of rodents and humans following the use of more traditional sensory-evoked fMRI procedures (Buxton, Wong, & Frank, 1998). Lee et al. also showcased the important capability of
OVERVIEW OF FUNCTIONAL MRI (fMRI): TASK-BASED VERSUS RESTING STATE fMRI
Functional MRI (fMRI) is a neuroimaging technique used to indirectly measure large-scale brain network activity by detecting associated hemodynamic changes in blood oxygenation. The non-invasive nature of fMRI and its ability to resolve brain-wide macroscale patterns of activity are two key advantages that have contributed to its widespread use and versatility as both a diagnostic tool in the clinic and in basic research (Logothetis, 2008). First described by Seiji Ogawa in 1990, blood-oxygen-level-dependent (BOLD) contrast imaging has become the mainstay of fMRI as a means to indirectly detect brain activity (Ogawa & Lee, 1990; Ogawa, Lee, Kay, & Tank, 1990; Ogawa, Lee, Nayak, & Glynn, 1990). When neurons become activated in response to a task or stimulus, they require an increase in oxygen and glucose consumption. This will cause local increases in cerebral metabolic rate of oxygen (CMRO2), cerebral blood volume (CBV), and cerebral blood flow (CBF). Although both CMRO2 and CBF are enhanced during neuronal activation, CBF of fresh oxygenated blood to the activated region exceeds that of CMRO2, resulting in an over proportional influx of oxyhemoglobin (Buxton & Frank, 1997). The BOLD contrast is caused by the paramagnetic property differences between oxy- and
deoxyhemoglobin and their local ratio differential following neuronal activation.
The two main fMRI techniques used to study global neurocircuit function are task-based (evoked) and resting state functional connectivity (intrinsic). During task-based fMRI
brain-wide MR signal changes during periods of stimulation relative to baseline and/or periods of rest. Regions of the brain that show MR signal changes that coincide with the block design pattern are considered areas that alter their activity due to the task or stimulus.
In contrast to task-based fMRI, resting state fMRI (rsfMRI) provides information about neuronal connectivity through investigating temporal correlations in the BOLD signal across the brain at rest. During rest, spatially distinct regions of the brain that are interconnected display temporally synchronized spontaneous low frequency (0.01-0.1 Hz) fluctuations (Biswal, Yetkin, Haughton, & Hyde, 1995). Several studies have demonstrated that the human brain
(Damoiseaux et al., 2006; De Luca, Beckmann, De Stefano, Matthews, & Smith, 2006), as well as non-human primate and rodent brains (Hutchison, Mirsattari, Jones, Gati, & Leung, 2010; Lu et al., 2012; Pawela et al., 2008; Vincent et al., 2007), are organized into distinct sets of
interconnected regions that display these highly correlated spontaneous fluctuations. Examples of these resting state networks (RSNs) include those involved with sensory-related processing such as motor, visual and auditory and those involved with more higher-order cognitive function including default mode, salience and executive networks. Dysregulation within these networks has been implicated in several neuropsychiatric disorders, including schizophrenia and
depression, and drug addiction. We explore these networks in the drug naïve rodent brain and characterize shifts in their connectivity patterns across the brain following cocaine exposure. We hope to provide new biomarkers that may link neural system dysregulation following cocaine exposure with the maladaptive behaviors seen in drug addiction.
DISSERTATION
CHAPTER 2: COORDINATION OF BRAIN-WIDE ACTIVITY DYNAMICS BY DOPAMINERGIC NEURONS 1
INTRODUCTION
Midbrain dopaminergic neurons have been reported to encode reward prediction errors (Cohen, Haesler, Vong, Lowell, & Uchida, 2012; Wolfram Schultz, 1998; Steinberg et al., 2013) and signal the incentive salience (Kent C Berridge & Robinson, 1998) of sensory cues. During reward-seeking behavior, burst firing of these neurons results in phasic dopamine release (Day et al., 2007; P. E. M. Phillips et al., 2003; Stuber et al., 2008) in cortical and limbic terminal fields such as the medial prefrontal cortex (mPFC) and nucleus accumbens (NAc), which in
conjunction with other neurotransmitters act to modulate postsynaptic neuronal firing (Gee et al., 2012; Surmeier, Ding, Day, Wang, & Shen, 2007) and promote changes in motivated behavioral output (Salamone et al., 2007; Stuber et al., 2011b; Tsai et al., 2009; Tye et al., 2013). The direct consequences of dopamine signaling are largely restricted to brain regions that contain
appreciable presynaptic fibers that release dopamine, as well as postsynaptic dopamine receptors. However, dopaminergic signaling may also indirectly influence the activity in multiple brain regions, some of which may receive little to no direct dopamine input. By sculpting activity
1 This chapter previously appeared as an article in the journal Neuropsychopharmacology. The original citation is as follows: Decot HK, Namboodiri VM, Gao W, McHenry JA, Jennings JH, Lee SH, Kantak PA, Jill Kao YC, Das M, Witten IB, Deisseroth K, Shih YI, Stuber GD (2017). Coordination of Brain-Wide Activity Dynamics by Dopaminergic Neurons.
dynamics of neurons that are polysynaptically downstream, ventral tegmental area (VTA) DAergic neurons may thus modulate a much larger functional brain circuit.
striatal targets, as well as by changing brain activity in potentially many other brain nuclei that do not directly receive appreciable dopamine input.
To further investigate these two complementary ideas, we studied how in vivo
modulation of VTA dopaminergic neurons altered brain-wide activity patterns using in vivo
optogenetics coupled with fMRI (Domingos et al., 2011; Ferenczi et al., 2016; Gerits et al., 2012; Kahn et al., 2011; Lee et al., 2010). We first tested whether selective optogenetic stimulation of THVTA neurons produced changes in fMRI signals and altered activity within multiple, anatomically distinct regions that directly receive dopamine input. This approach capitalizes on the genetic specificity offered by optogenetic strategies and the high throughput, with the capability of resolving brain wide macroscale patterns of activity afforded by fMRI. Utilizing a standard generalized linear model (GLM) analysis approach, our results indicate that selective activation of THVTA neurons produces dopamine receptor dependent increases in CBV signals in well-established dopaminergic terminal fields such as the striatum. In contrast, whole brain voxel-based principal component analysis (PCA) of the same dataset, which allowed us to survey changes in brain-wide activity, revealed that dopaminergic modulation activates many additional anatomically defined regions throughout the brain. Using our developed PCA-fMRI approach, we also explored how DA stimulation coupled with a discrete sensory stimulus affects the representation of that stimulus throughout the entire brain. We reveal that explicit pairing of THVTA neuron activity with forepaw stimulation dramatically alters the brain-wide sensory representation of that stimulus. These findings provide new insight into the global adaptation in neurocircuit function associated with the attribution of salience to sensory cues in the
METHODS
Experimental Subjects and Stereotactic Surgery
All procedures were conducted in accordance with the Guide for the Care and Use of Laboratory Animals, as adopted by the National Institutes of Health, and with approval of the Institutional Animal Care and Use Committee at the University of North Carolina (UNC). Adult (400-450 g) male tyrosine hydroxylase (TH)-ires-cre Long Evans rats were group housed until surgery and were maintained on a 12-h light cycle (lights off at 19:00) with mild food restriction to maintain ~90% body weight during the duration of the study. To target dopamine (DA) neurons within the midbrain, TH-ires-cre rats were endotracheally intubated and ventilated using a small animal ventilator (CWE Inc., SAR-830/PA, Armore, PA) with ~1.5% isoflurane in medical air prior to being placed into a stereotactic frame (Model 962, Kopf Instruments, Tujunga, CA). For all experiments, rats were microinjected with quadruple injections of 1 µl of purified and concentrated adeno-associated virus (~1012 infections units per ml, packaged by the UNC Vector Core Facility) into the ventral tegmental area (VTA) using the following
fMRI Procedures
MRI was performed using a 9.4 Tesla Bruker BioSpec system with a BGA-9S gradient insert (Bruker Corp., Billerica, MA) at the UNC Biomedical Research Imaging Center (BRIC). On the day of MRI experiments, each rat was endotracheally intubated and ventilated with ~1.5% isoflurane in medical air. The ventilation rate and volume were adjusted via a capnometer (Surgivet v9004, Smith Medical, Waukesha, WI) to maintain end-tidal CO2 (EtCO2) within a range of 3.0±0.2%. Non-invasive EtCO2 values were previously calibrated against invasive blood-gas samplings under identical baseline conditions, resulting in an arterial pCO2 of 37.6± 4.7 mmHg (Yen-Yu I. Shih et al., 2013). Heart rate and oxygen saturation (SpO2) were
continuously monitored by a non-invasive MouseOx Plus System with MR-compatible sensors (STARR Life Science Corp., Oakmont PA) and maintained within normal ranges (~280 bpm and above 96%, respectively). Rectal temperature was maintained at 37±0.5°C with a warm-water circulating pad. Black tape was placed over the eyes and a masking light was directed into the face of each rat to minimize visual stimulation during laser light delivery.
anterior commissure. For functional scans, single shot gradient echo-EPI sequence (spectral width=300 kHz, TR/TE=1000/8.1 ms, FOV=2.56x2.56 cm2, slice thickness= 1 mm,
matrix=80x80, providing temporal resolution=1 s) was used.
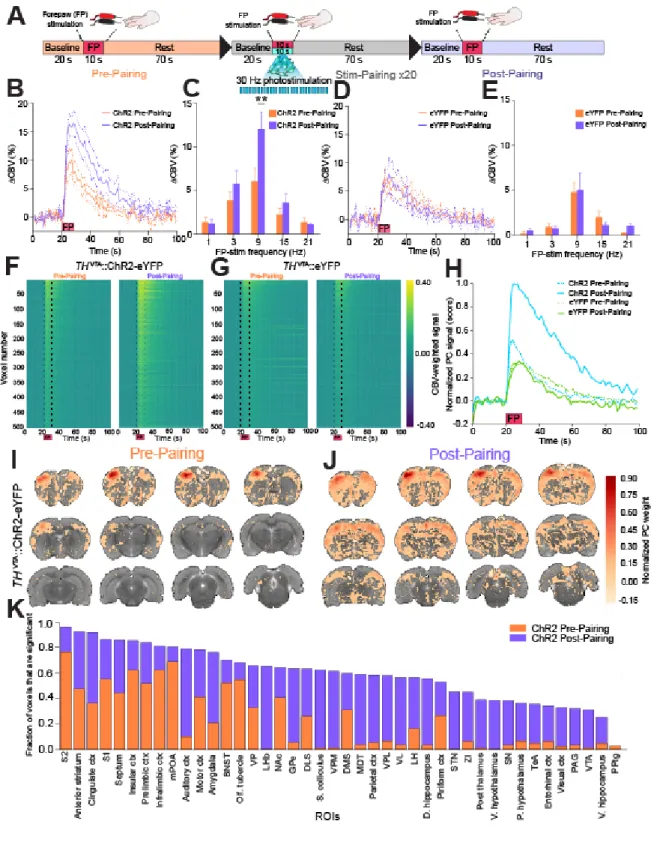
During fMRI, dexmedetomidine (0.1 mg/kg/hr) and pancuronium bromide (1.0 mg/kg/hr) were infused intraperitoneally and isoflurane was lowered to 0.5% 30 min after the infusion began (Fukuda, Vazquez, Zong, & Kim, 2013). Cerebral blood volume (CBV)-weighted fMRI (Mandeville et al., 1998) was achieved by injecting Feraheme (AMAG Pharmaceuticals, Lexington, MA) at a dose of 30 mg Fe/kg via a tail vein catheter. CBV-weighted fMRI was chosen over the more conventional blood oxygenation-level dependent (BOLD) fMRI due to its ability to provide significantly greater functional sensitivity (Kim et al., 2013). Optical fibers were coupled via 3-m patch cables to solid-state lasers (473 nm wavelength) located outside of the MRI room delivering ~10 mW light to each hemisphere of the VTA. Evoked fMRI scans were acquired for 100 s during which photostimulation was applied in a 20-s OFF, 10-s ON, 30-s OFF, 10-s ON, 30-s OFF pattern. Subjects underwent two to five repeated trials at each
fixed pulse width of 0.3 ms and a current of 1.5 - 3.0 mA (pre-pairing). Then, a repeated pairing of forepaw electrical stimulation at 9 Hz with 30 Hz optogenetic stimulation of VTA DA
neurons was performed with an initial 20-s OFF, followed by 20 blocks of 10-s ON and 70-s OFF. Finally, changes in CBV signals and frequency dependence in response to all forepaw stimuli frequencies were re-assessed (post-pairing).
Data Processing and Statistical Analysis
Generalized Linear Model (GLM)-based stimulation analysis
fMRI data analyzed using a generalized linear model (GLM) were processed using Matlab (Math-Works, Natick, MA) and Statistical Parametric Mapping (SPM) codes, with the pipeline similar to our previous publications (Lai, Albaugh, Kao, Younce, & Shih, 2015; Yen-Yu Ian Shih, Huang, et al., 2014; Yen-Yu Ian Shih, Yash, Rogers, & Duong, 2014; Younce,
where Sstim and Sprestim are the MR signal intensities during and before stimulation, respectively. Cerebral blood volume changes were calculated by dividing stimulus-evoked ΔR2* by baseline ΔR2* values. The effect of optogenetic and forepaw stimulation frequency on ∆CBV change was calculated by averaging CBV values from the first 20 s time points during each stimulation epoch. Two-way ANOVA tests followed by Bonferroni post hoc comparisons were applied for comparisons with more than two groups. All data were expressed as mean ± SEM and
significance was set at p < 0.05.
Principal Component Analysis (PCA)-based stimulation analysis
PCA analysis pipeline for data analyzed utilizing this method within this manuscript was written in python 2.7 using numpy and scikitlearn packages. Additional ipython notebooks with documented code used for this pipeline can be found at:
https://github.com/stuberlab/PC_opto_fMRI_analysis.
Raw data used for this study can be downloaded via the associated ipython notebooks. The aim of this data analysis pipeline was to analyze the activity of the whole brain (as opposed to pre-defined ROIs) in relation to the various stimulation paradigms. To this end, we employed a Principal Component Analysis (PCA) based dimensionality reduction.
Skull-stripped data from each animal was first aligned to a reference T2-weighted atlas. Subsequent masking deleted all data outside of the reference atlas in order to align voxels across all animals. To correct for variation between animals introduced by the injection of
normalized by calculating the corresponding CBV-weighted signal as:
where is the baseline signal for voxel v, and was calculated as the mean signal in the first 20 s of the run for that voxel. was calculated as the mean across all voxels, and was calculated as the mean signal in the first 20 s of the baseline scan prior to the injection of MION across all voxels. This analysis corrects for the average signal change introduced by the MION injection for each animal, prior to averaging the data across animals. To ensure that only shared variation across animals (likely from the stimulation) is present in the dataset on which PCA is performed, voxel traces were averaged across all animals and runs. Variability within the dataset extraneous to that introduced by stimulation was likely averaged out. As a result, the extracted PC representing stimulation effect is likely going to have minimal contribution from endogenous fluctuations within the signal. Furthermore, slow constant drifts in the signal during the imaging session could be largely isolated from the principal component representing the stimulation effect (e.g. Figure A.3 A). Thus, this method automatically corrects for some sources of noise.
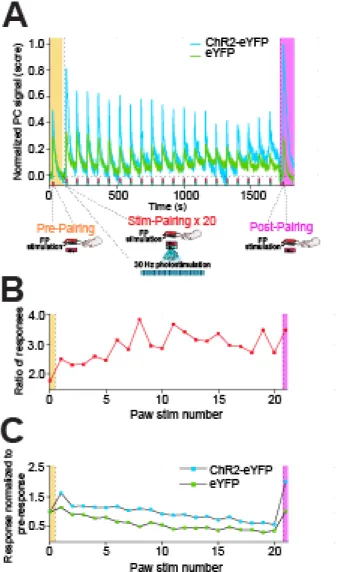
PCA was performed on averaged data from experimental (ChR2-eYFP) and control (eYFP) animals. Spatial and temporal dimensions representing the voxels within this feature space were treated as features and samples, respectively. Dimensionality reduction was
negative, we multiplied the PC vector and trace (or score) by -1. Thus, the stimulation response in all PCs are positive; the caveat being for PCs not representing stimulation effect, the change in signal at this time point might be due to random fluctuations.
The PC representing the stimulation effect was chosen and defined as the PC that showed a significant difference in the mean signal during the post-stimulation period compared to the mean signal in the baseline period (using a Welch's t-test). An additional constraint on the PC representing the stimulation effect was also applied: the post-stimulation response needed to trend towards baseline. This criterion ensured that PCs showing a stable drift across the entire session were not considered as stimulation-induced. For the VTA stimulation experiment, each experimental run had two stimulation epochs. Thus, in this case, it was required that the PC representing the stimulation response satisfied the above criteria for both stimulations, i.e. the mean stimulation response was higher than the mean baseline response for both post-stimulation periods, and that the response during the post-post-stimulation period for both stimulations trended towards baseline.
A caveat for this method is that it is possible that the stimulation effect is not entirely isolated within a single PC. In our case, it was clear looking at the traces of each PC that the post-stimulation effect was captured within the identified PC. If this was not the case, it would be appropriate to run a subsequent rotation of the axes within a subspace spanned by the first few PCs to isolate non-orthogonal components (Andersen, Gash, & Avison, 1999). Subsequently, the result of this trace could be used as a stimulation model for a GLM approach. However, since our analysis only required PCA, performing such a GLM is equivalent to identifying the
PC representing the stimulation response were identified using the following equation:
where represents the standard deviation of the ithvoxel trace (Si), the standard deviation of
the PC trace (SPC) and ρ, the Pearson correlation coefficient . Thus, the voxels that contribute
significantly to the PC are the voxels that show significant Pearson's correlation with the PC (Yamamoto et al., 2014). Similar to Generalized Linear Model (GLM)-based approaches (Monti, 2011), this method extracts out the voxels that show significant correlation with a stimulation response function. However, unlike GLM, we do not have to define a priori models of stimulation effects using a putative hemodynamic response function (HRF). This is a
significant advantage as it has been shown that HRFs are different depending on the species and region in the brain (Ferenczi et al., 2016; Handwerker, Ollinger, & D’Esposito, 2004). Crucially, the appropriate HRF for each voxel in the brain of a rat is not known and may even be
impossible to reliably specify. Thus, using PCA to identify the shape of the stimulation response is data-driven and mitigates biases introduced by the specifications of the GLM model.
Voxels showing significant correlation with the PC trace representing the stimulation effect were mapped back to hand-drawn ROIs based on the reference brain atlas. Subsequently, ROIs were ranked based on their fraction of voxels that significantly contributed to the PC representing the stimulation effect. Comparing ROIs based on the fraction of significant voxels has the benefit of normalizing for the size of the ROI. However, two caveats are worth
mentioning: 1) This fraction ignores the magnitude of the response for each voxel, and, 2) ROIs with fewer voxels may have spuriously high or low fractions due to their small sizes.
(averaged across animals) and the data from the post-pairing epoch (averaged across animals and runs). The PCA pipeline detailed above was run on this combined dataset. To find the PCs representing paw stimulation response for both groups, two conditions were required: 1) A positive stimulation response to every stimulation (22 in total), and 2) the post-stimulation response should show a decreasing trend following every stimulation. The traces for the PCs identified thus are shown in Figure 4a. As these traces showed variable magnitudes prior to each stimulation, the stimulation response for any stimulation was calculated by subtracting out the mean baseline response (over a 10 s period before that stimulation) from the peak response during stimulation. To test for the presence of sensory habituation, the response magnitudes for each group were divided with respect to the response magnitude pre pairing from the same group. Subsequently, the presence of a negative linear regression between the normalized response and the number of stimulations during pairing(i.e. excluding pre and post pairing responses) was investigated. To determine whether the habituation effect was comparable between ChR2-eYFP and eYFP groups, the interaction effect of pairings and the effect of group on the normalized response magnitude was also explored. Lastly, to test for an enhancement in the fMRI signal due to pairings in addition to a shared habituation, the ratio of responses for each pairing (including pre and post pairing) between the ChR2-eYFP and eYFP groups for a positive linear regression was determined.
However, this analysis provides a means to test whether any significant post-stimulation
response was present in either group and identified which voxels across the brain contributed to this response. Separate principal component basis sets were used for the THVTA stimulation experiment and the forepaw pairing experiment.
Histology, Immunohistochemistry, and Microscopy
Rats were deeply anaesthetized with pentobarbital, and transcardially perfused with phosphate buffered saline (PBS) followed by 4% (weight/volume) paraformaldehyde in PBS. Brains were post-fixed in 4% paraformaldehyde for 24 hr and transferred to 30% sucrose in ddH2O for 48 hr. 40 μm brain sections were collected and blocked in 1:10 normal donkey serum: 0.1% Triton (200:1800 µl) for 1 hr. Sections were then incubated in primary antibody (tyrosine hydroxylase, 1:500 Pel Freeze; made in sheep) for 48 hr at 4°C. Following 4 × 10 min PBS washes, the sections were incubated in secondary antibody (Dylight 649 donkey anti-sheep, 1:800, Jackson ImmunoResearch Laboratories, Inc., West Grove, PA) for 24 hr at 4°C. All sections were coverslipped with Fluoroshield with DAPI (Sigma Aldrich, St. Louis, MO). Z-stack and tiled images of mounted brain sections were visualized using Zeiss LSM 710 confocal microscope with a 20x or 63x objective.
RESULTS
Viral Targeting of VTA Dopaminergic Neurons in TH-Cre Rats
quantitative assessment of viral targeting to TH+ neurons in the TH-Cre rat line across the anterior/posterior and medial/lateral subregions of the midbrain (Figure 2.1 A-C). We
quantified the location of all neurons within anterior, middle, and posterior sections expressing only eYFP (eYFP+/TH-), TH (eYFP-/TH+), and neurons that expressed both (eYFP+/TH+) (n = 9 sections in n = 3 rats). Collapsed across the anterior-posterior axis containing the VTA, we observed highly specific viral transduction of TH+ neurons (97.4 +/- 1.0%, n = 9 slices from n = 3 rats, Figure 2.1 D). Notably, few neurons that were eYFP+, but showed TH immunoreactivity that could not be resolved above background tended to reside in the anterior VTA or ventral to the VTA in the interpeduncular nucleus (Figure 2.1 C). Based on stereotactic optical fiber placement directly above the VTA and predicted transmission of light power at 473 nm through brain tissue, it was unlikely that light from the optical fiber tip would spread to illuminate and activate those few neurons in the IPN that were eYFP+/TH- (Aravanis et al., 2007). In TH-Cre rats injected with AAV-DIO-ChR2-eYFP, we also observed substantial innervation of striatal subregions including the dorsal medial striatum (DMS) and the NAc (Figure 2.1 E,F). These results further validate the use of TH-Cre rats for targeted manipulation of THVTA neurons, with minimal targeting to TH- neurons in and around the VTA.
Whole Brain Analysis of the Effect of THVTA Neuron Stimulation
sections from each animal (Figure 2.2 B), CBV-weighted fMRI (Kim et al., 2013; Mandeville et al., 1998; Yen-Yu I. Shih et al., 2009; Smirnakis et al., 2007) data, which indirectly measures neuronal activity by detecting changes in hemodynamic signals accompanying vascular responses, were acquired using single-shot echo planar imaging sequence at 1 s temporal
resolution. In order to produce sustained, dopaminergic signaling, THVTA neurons were optically stimulated at 10 – 40 Hz for 10 s (Figure A.2 A and C). With these parameters we measured CBV responses across 12 continuous coronal slices of 1 mm thickness each encompassing nearly the entire cerebrum. Using a standard generalized linear model (GLM) to compare each voxel’s activity trace to a predefined stimulation template or hemodynamic response function (Ferenczi et al., 2016; Leite et al., 2002; Monti, 2011) (Figure A.2 E), optogenetic stimulation of THVTA neurons produced pronounced CBV increases in striatal brain regions in a frequency dependent fashion relative to control animals that received laser-light delivery, but only expressed eYFP in THVTA neurons (Figure A.2). Further, systemic administration of a dopamine D1-receptor (D1R) antagonist, SCH23390, significantly attenuated CBV signals caused by THVTA
optogenetic stimulation (Figure A.2 B). The D1R antagonist had no significant effect on eYFP control animals, verifying that the antagonist is specifically blocking the THVTA neuron
stimulated signal, and not causing a stimulation-independent effect on the baseline (Figure A.2 C). Taken together, these data show that selective activation of THVTA neurons produces dopamine receptor dependent signaling that result in increased CBV signals in dopaminergic terminal fields.
associated CBV weighted time series data were subjected to principal component analysis (PCA) factorization (Andersen et al., 1999; Freeman et al., 2014) (Figure 2.3 C). This resulted in a substantial reduction of the dimensionality of the spatial-temporal dataset from 35,182 down to 75 PCs that explained 80% of the variance of the data. Importantly, the first PC alone explained 7% of the variance of data collected from ChR2-eYFP rats. The percent variance of the data explained by each subsequent PCs reached an asymptote by 3-4 PCs (Figure 2.3 D).
The first PC plotted as a function of time represented the effect of THVTA optogenetic stimulation as it significantly increased from the baseline period (0 – 20 s) in each
stimulation period (30 - 60 s, and 70 – 100 s) (t(48.0) = 11.69, p<0.001, Welch's t-test for post-stimulation period 1 and t(38.7) = 7.15, p<0.001, Welch's t-test for post-post-stimulation period 2, Figure 2.3 E), largely recapitulating the ROI analysis of striatal signals shown in Figure A.2 A. In contrast, data collected from rats only expressing eYFP in THVTA neurons showed no
significant post stimulation response. As the weight of a voxel to a given PC reflects the correlation between the voxel’s and the PC time series signals (Yamamoto et al., 2014), we hypothesized that a given voxel’s contribution to PC1 would highly correlate with the raw signal intensity for that voxel in the post-stimulation period exclusively in data collected from ChR2-eYFP rats. Supporting this, a highly significant positive Pearson’s correlation between these two variables was observed in the ChR2-eYFP group (R2 = 0.68), slope = 1.12, p < 0.001). In