INTERVENTIONAL PHYSICAL AND OCCUPATIONAL THERAPY SERVICES AND MOTOR COORDINATION AMONG LOW BIRTH WEIGHT INFANTS
Stephanie Elaine Watkins
A dissertation submitted to the faculty of the University of North Carolina at Chapel Hill in partial fulfillment of the requirements for the degree of Doctorate of
Philosophy in the Department of Epidemiology, Gillings School of Public Health.
Chapel Hill 2012
Approved by:
Julie Daniels PhD
Michele Jonsson-Funk PhD
Alan Brookhart PhD
Michael O’Shea MD, MPH
ii
Abstract
STEPHANIE ELAINE WATKINS: Interventional Physical and Occupational Therapy Services and Motor Coordination among Low Birth Weight Infants
(Under the direction of Julie Daniels)
Introduction: Children born very low birth weight (VLBW) have an increased risk of impaired preschool motor coordination, which may have negative effects on the child’s mental and physical health. Physical and
occupational therapy services are suggested to attenuate the negative effects of poor preschool coordination. We estimated the effect of physical and
iii
iv
TABLE OF CONTENTS
List of Tables……… vi
List of Figures……… viii
Chapter I. BACKGROUND AND SIGNIFICANCE………. 1
Statement of Specific Aims………. 1
Motor Development in Low Birth Weight Infants……… 6
Early Intervention……… 9
Theoretical Foundation of Physical and Occupational Therapy………. 10
Present State of the Literature……… 12
Early Intervention and Motor Outcomes among Low Birth Weight Children……… 12
Physical or Occupational Therapy and Motor Outcomes among LBW children………. 14
Estimating Effects in Observational Data……… 17
II. METHODS……….. 20
Data Source………. 20
Exposure Assessment………. 23
Outcome Assessment……… 24
Study Design………. 29
v
Sources of Bias………. 40
Power Calculations……….. 43
III. PRELIMINARY ANALYSES……… 45
Variable description and coding………. 45
Descriptive analysis: low birth weight cohort……….. 51
Exploration of confounding ……… 52
Building the propensity score………. 55
Refined VLBW cohort: Crude and Standard Outcome Models… 58 Missing Data………... 60
IV. PHYSICAL AND OCCUPATIONAL THERAPY SERVICES AND MOTOR COORDINATION AMONG CHILDREN BORN VERY LOW BIRTH WEIGHT……….. 61
V. AN ILLUSTRATION OF ENSEMBLE METHODS FOR PROPENSITY SCORE ESTIMATION: PHYSICAL AND OCCUPATIONAL THERAPY SERVICES AND PRESCHOOL AGE MOTOR ABILITY……… 81
VI. DISCUSSION……….. 99
APPENDICES………. 114
vi
LIST OF TABLES Table
1. Literature review: Skilled OT/PT and Motor Outcomes……… 114
2. Literature review: Other interventions and Motor Outcomes……… 116
3. Sample sizes for receipt of services: ECLS B……… 118
4. Characteristics of low birth weight cohort………. 120
5. Candidate variables for predictors of therapy services……… 125
6. Variable importance in predicting preschool motor impairment…… 126
7. Marginal relationship between covariates and therapy receipt……… 127
8. Modeling covariates and therapy/preschool motor ability……… 128
9. Change in estimate……… 132
10. Candidate variables for propensity score model……… 133
11. Sensitivity of effect estimates to propensity score model………. 134
12. Association between receipt of physical and occupational therapy and early childhood motor performance among VLBW children: Average Treatment Effect, Crude and Standard Models………. 135
13. Descriptive statistics of VLBW children by receipt of therapy services between nine months and age two………. 136
14. Standardized differences among confounders……… 141
vii
16. Sensitivity Analysis: Overlapping propensity scores and propensity scores trimmed contrary to prediction……… 143 17. Out of bag error rates for prediction of receipt of early childhood
therapy……… 144 18. Distribution of propensity score/weights for the average
treatment effect by method used to generate the
propensity score……….. 145 19. Standardize differences among confounders by estimation method.. 146 20. Average treatment effect of interventional physical or
occupational therapy services and preschool motor skills:
viii
LIST OF FIGURES Figures
1. Motor Pathways………. 11
2. Exposure Time Line……… 24
3. Study Design……….. 30
4. Directed Acyclic Graph……….. 31
5. Power Analysis……… 44
6. Flow Diagram of VLBW sample……… 150
7. Variable Importance of Therapy Receipt……… 151
8. Partial Dependence Plot: BSF-R and Motor Impairment………. 152
9. Partial Dependence Plot: Birth weight and Motor Impairment……… 153
10. Partial Dependence Plot: SES and Motor Impairment……… 154
11. Partial Dependence Plot: Gestational Age and Motor Impairment… 155 12. Partial Dependence Plot: Hospital stay and Motor Impairment…… 156
13. Partial Dependence Plot: Gestational Age and Therapy Receipt……157
14. Partial Dependence Plot: Birth weight and Therapy Receipt……….. 158
15. Partial Dependence Plot: BSF-R Motor T Score and Therapy Receipt………. 159
16. Partial Dependence Plot: APGAR and Therapy Receipt……… 160
17. Partial Dependence Plot: SES and Therapy Receipt……… 161
ix
19. Partial Dependence Plot: Childcare hours and Therapy Receipt…… 163 20. Partial Dependence Plot: KIDI score and Therapy Receipt………… 164 21. Plot: odds ratios and 95% CI: Birth weight and Pre-K motor
impairment……… 165 22. Plot: odds ratios and 95% CI: Cruising and Pre-K motor
impairment……… 166 23. Plot: odds ratios and 95% CI: Hospital days and Pre-K
motor impairment……….. 167 24. Plot: odds ratios and 95% CI: BSF-R Motor T score and
Pre-K motor impairment……… 168 25. Plot: odds ratios and 95% CI: APGAR scores and Pre-K
motor impairment……….. 169 26. Plot: odds ratios and 95% CI:SES scale and Pre-K motor
1 Chapter 1
BACKGROUND AND SIGNIFICANCE
Statement of Specific Aims
Since the 1980’s, rates of infants born with low birth weight (LBW) have increased in the United States. In 2010, approximately 8.2% of all births were LBW and 1.5% of all births were very low birth weight (VLBW).1
Approximately 10% of children who are low birth weight exhibit severe neurological impairments including abnormalities in tone, transitional movement, and persistence of primitive reflexes.2,3 However many low birth weight children only experience minor neurological impairments.
2
motor coordination in childhood has a negative effect on the child’s mental and physical health with persists into adolescence.5,6-9
In the absence of a neurological or medical diagnosis, these symptoms are described as developmental coordination disorder (DCD).10 The prevalence of DCD among VLBW/very preterm infants has been reported to be as high as 72%. Children born with VLBW are six times as likely to develop DCD than children born with normal birth weight.10
To attenuate the potential negative sequelae of poor childhood motor coordination, early intervention (EI) by physical and occupational therapists is recommended.10 EI is a federal program providing interventional services to infants and toddlers to improve outcomes for children with developmental
disabilities. Specifically, physical and occupational therapists often treat low birth weight children to improve function and to minimize morbidity during childhood.
In the published literature, few studies have examined the efficacy of interventional physical and occupational therapy services on school age motor skills of low birth weight children. Previous research comprises a heterogeneous group of studies where small groups of preterm and low birth weight infants are typically randomized to neurodevelopmental treatment or typical care. The majority of the studies evaluate interventional effects within the first twelve
months of life with variability in both intensity of treatment and length of follow up.
3
physical therapy during the first year of life on motor ability in childhood.11,12
Neither trial found a statistically significant difference in standardized motor
scores between treatment groups. However, among children born of normal birth weight, interventions promoting motor development appear to improve children’s locomotor ability.13
Little is known regarding the efficacy of physical and occupational therapy on childhood motor coordination. Observational data are available to evaluate this relationship, yet research analyzing the effect of a treatment on an outcome in non-randomized studies is complicated by exposure group differences on measured and unmeasured characteristics associated with the outcome of interest.
Propensity scores ( the predicted probability of treatment given a set of measured covariates) are a commonly used method to control for confounding when estimating the average treatment effect in observational studies, yet there are few guidelines in the literature regarding how to estimate the propensity score.14 Logistic regression is frequently used, yet the model must conform to the
4
Tree based methods, including Bagging and Random Forest classification (RFC), are non-parametric methods derived from learning based algorithms which offer robust alternative strategies for generating predicted probabilities of treatment.17,18 Yet, these methods are underutilized in the literature.
Using the Early Childhood Longitudinal Study Birth Cohort (ECLS-B) (N≈1,150), this study will estimate the association between receipt of
interventional physical and occupational therapy services and motor coordination during preschool and school age developmental periods in a population of
children born VLBW. Furthermore, we will consider the use of novel methods, propensity score estimation using tree based methods, to control for confounders in these data.
Specific Aim 1: In a population of very low birth weight children, we will estimate the effect of early childhood physical and occupational therapy services on preschool age motor coordination.
Specific AIM 2: We will illustrate two novel methods, random forest
5 Overview
Since the 1980’s, rates of infants born with low birth weight (LBW) have increased in the United States. In 2010, approximately 8.2% of all births were LBW and 1.5% of all births were very low birth weight (VLBW).1 Approximately 67% of low birth weight babies are also born preterm.19
Low birth weight children are at risk for long term morbidity and
developmental disability.20,21 Especially among LBW infants who are also born preterm, these infants may experience major disturbances during a period of rapid brain growth which may result in abnormalities in tone and movement patterns.22 These babies may have a poor ability to assume flexion and
frequently maintain patterns of extension. These abnormal movement patterns often lead to delays in unsupported sitting and trunk rotation which in turn affects fine motors skills, behavior, and cognition.23
A small percentage of VLBW children (≈10%) suffer from these severe neurological impairments that affect posture and movement. Yet, a large
6
To minimize dysfunction and disability among children born LBW, early intervention programs are often implemented. Early Intervention is a federal program that delivers services to infants and toddlers through three years of age.24 Physical therapy, occupational therapy, and speech therapy are services directly delivered to the child and the family. These services are frequently referred to as “interventional therapy services”.
I. Motor Development in Low Birth Weight and Preterm Infants
Over the last twenty years, a large body of research explored impairments in motor development among low birth weight and preterm children. Since a large percentage of low birth weight children are also preterm, we consider the implications of both factors on motor development.19 Impairments in motor ability not only affect a child’s ability to move about their environment but also
handwriting, behavior, and cognitive performance.25-28 Movement is a child’s
connectivity to the world. It is through exploration of their environment that children learn.
The degree of impairment among children born low birth weight can be quite variable. Some children in this population exhibit severe motor delays with little independent movement, where other children experience milder delays in motor coordination.
Approximately 10% of low birth weight preterm children develop cerebral palsy; a disorder of posture and movement.2,29-31 These children have
7
attainment and functional ability. Typically these motor abnormalities are associated with perinatal brain hypoxia, ischemia, infection, intraventricular hemorrhage, and periventricular leukomalacia.3
However, not all low birth weight preterm children develop such severe impairments in motor function. Many children who are born low birth weight show only minor or no obvious neurological impairments.
Children that are born low birth weight perform more poorly on
assessments of motor performance compared to children of normal birth weight. Furthermore, their motor performance appears to decline with increasing
prematurity.32
Between 1992 and 2009, over 24 studies examined motor development among very low birth weight and very preterm children. When compared to a normative sample, VLBW and very preterm children scored lower on the
psychomotor developmental index (PDI) of the Bayley II. These children were on average 0.88 standard deviations behind their typically developing peers (95% CI -0.96 to -0.80).33 When researchers examined the PDI score for children with adverse perinatal complications, the effect size decreased further (0.51 SD).33
8
to their full term peers, very low birth weight or very preterm children consistently have a higher overall impairment score. Moreover, they scored lower on the following subscales: balls skills; balance skills; and manual dexterity.33,35
Children exhibited the greatest deficit in balance skills. Compared to a normative sample, children in this population also have lower motor proficiency scores in running speed, agility, coordination, strength, and dexterity.33
Although initially delayed, very preterm and very low birth weight children exhibited a catch up effect in early childhood. Yet, they exhibited a deficit in more complex motor tasks, as measured by the Movement Assessment Battery for Children, as they moved into school age and adolescence.33 The divergence of skills began to appear at age five as children entered into elementary school.
Children with delays and difficulty in motor coordination may be described as having Developmental Coordination Disorder (DCD). This condition is
described as “marked impairment in the development of motor coordination” among children without a known neurological or medical condition which
describes their incoordination.36 Symptoms of the condition are often first noticed during preschool when the child first attempts to learn movement requiring
9
and limited participation in physical activity.37 Very low birth weight children are 6
times as likely to have DCD when compared to their normal birth weight peers.10
II. Early intervention
Early intervention physical and occupational therapy services are
recommended to facilitate motor control among low birth weight children who are at risk for delays in gross motor skills. Early intervention describes a group of services and programs, provided to children with developmental delays, to improve their functional ability. In 1986, under the Individual with Disabilities Education Act, the United States Congress passed Public Law 105-17 mandating the provision of infant and toddler early intervention services. These early
intervention services are called Part C.24
Part C intervention programs are multidisciplinary statewide programs which operate within the guidelines set by the federal government. Specific eligibility criteria are set by each state. Part C programs provide services for children from birth to age three. Children generally qualify if they have
documented impairments in one or more of the following developmental areas:
motor, cognitive, adaptive, communicative, social, or emotional.
Early intervention offers a diversity of family and child programs. Trained professionals provide screening and assessments of the child as well as a long list of developmental services. Common services include the following
10
III. Theoretical Foundation of Physical and Occupational Therapy
Both physical and occupational therapists frequently focus their treatment on facilitation of normal movement patterns as well as posture and refined motor control. Treatment is grounded in the theory of neural plasticity. Theoretically, the brain has the ability to reorganize neural pathways based on new
experiences. This concept is referred to as “neural plasticity” and is the foundation for delivery of early developmental therapy.
Animal models have established that “new” experiences allow for
re-organization of cortical maps. In the first few years of life, although the majority of neurons have been formed, individual experiences drive modulation of neuronal death, stabilization of synapses, axonal reorientation, and budding of axonal dendrites.38 Thus, early interventional services have the potential to reorganize neuronal pathways to improve functional outcomes.
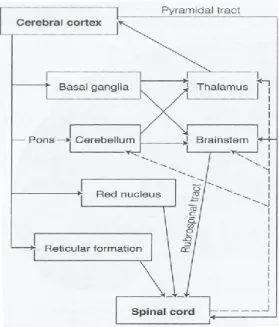
In human movement the cerebral cortex, cerebellum, basal ganglia, brain stem, and spinal cord are the main neuronal structures guiding motor control. Specifically, the frontal lobe of the cerebral cortex contains the premotor cortex, the motor cortex, and the supplemental motor cortex regions. Through complex interactions with other regions of the central nervous system, these structures guide and execute voluntary movement. The cerebellum assists with
11
Figure 1. Motor Pathways
Reprinted from: PIEK JP. Infant Motor Development. In: Wright JP, ed. Champaign, IL: Human
Kinetics, 2006.
Research suggests developmental and environmental stimulation can affect neuronal cell formation as well as organization of synaptic connections in the brain over the lifespan.40-43 Merzenich and colleagues investigated the plasticity of the brain by mapping the topographical orientation of the fingers in the cortex. When two fingers were amputated, the location of those digits was eventually taken over by the palm and adjacent fingers. Furthermore, when monkeys were taught to pick up food with the tips of their fingers the
corresponding cortical brain region enlarged.44 These studies suggest that structures are not “hard wired” for a given function. Therefore, we hypothesize that environmental/developmental stimulation of low birth weight children has the
12 IV. Present State of the Literature
Early intervention and Motor Outcomes among LBW children
Services delivered to improve developmental outcomes, specifically motor ability, typically include two theoretical types of programs. Programs, in general, either deliver treatment directly to the child to facilitate motor milestone
attainment or provide education to the families to facilitate infant child interaction. Services delivered directly to the child to improve motor outcomes are typically provided by licensed physical or occupational therapists. Facilitation of gross motor outcomes falls within the scope of practice for both disciplines. These services are referred to as “interventional therapy services”.
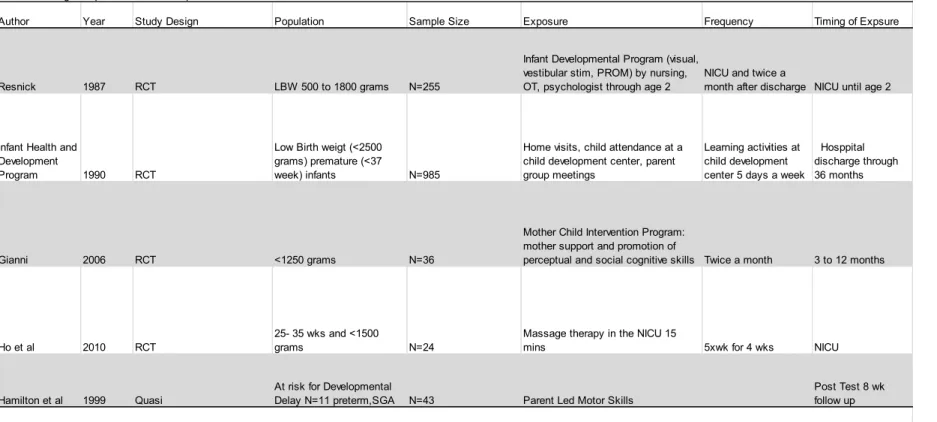
Over the past twenty years, a substantial number of randomized controlled trials evaluated the effect of early intervention services on development among low birth weight children. These studies included direct interventional therapy, mother child interventions, and developmental education curricula. To date, two large trials reported positive effects of early interventions services on
neurodevelopment.45,46
Presently in the United States, the Infant Health and Development Program is the largest randomized controlled trial. This program was
13
receive learning activities in a child developmental center and in the home. Parents also participated in regular support group meetings. At thirty six months, children in the intervention group had significantly higher mean IQ scores.45 Moreover, the effects of the educational curricula varied by maternal and infant characteristics. Among the heavier babies, Stanford Binet scores were
significantly higher in the intervention group compared to the control group. Researchers also observed a small statistically significant behavioral advantage among babies with less educated mothers. The results did not show any difference in serious medical conditions between the two groups.45
In the United Kingdom, the Avon Premature Infant Project evaluated the effect of developmental education and parent advice on neurodevelopment. Three hundred premature infants less than 33 weeks were randomly assigned to developmental education, social support, or usual care. These interventions were implemented from hospital discharge until age two. At twenty four months the results showed, for all three groups, no statistically significant difference in the mean Griffith Mental Developmental score. However, the results did show a statistically significant interaction by birth weight and presence of brain lesions. Among, children with abnormal cranial ultrasounds (hemorrhagic or ischemic lesions) or who were very low birth weight (<1251 grams), the intervention had a statistically significant beneficial effect. This effect was not observed among heavier infants.46
14
occupational therapy services were not directly implemented in these trials, the results suggest that early intervention services delivered before the age of two may have positive effects on development. The period between birth and age two may be a critical time window for neuroplasticity among subgroups of low
birth weight children.
Several smaller randomized trials (N≈50) evaluated the effect of similar parent child programs on gross motor development among low birth weight toddlers. 47,48 Both interventions involved mother child interactions where the
parent promoted perceptual, cognitive, and motor skills. At approximately three years of age, children of parents who were trained in these developmental techniques had higher mean Bayley scores in eye hand coordination, personal, social, and practical reasoning skills.48 Furthermore, children who received parent led motor control techniques has a statistically significant improvement in object control compared to children with usual care (Table 1).47
Physical or Occupational Therapy and Motor Outcomes among LBW children
In the published literature, there are multiple small randomized trials that specifically evaluated the effect of physical, occupational, or physiotherapy services on motor outcomes in low birth weight children.11,12,49-57 These trials began in the mid nineteen eighties with the majority of these studies evaluating the effect of treatment before one year of age with follow up at two years of age.
The randomized trials published to date had small sample sizes of
15
pediatric physical therapy included one hundred and seventy six babies less than 32 weeks or less than 1,500 grams. The smallest trial included only nineteen infants. At study entry, researchers often assigned infants a neurodevelopmental score and stratified infants into three categories: normal, at risk, and
neurologically impaired. Infants were then randomized to either interventional physical/occupational therapy or normal care within each stratum. Therapy was usually initiated within three months of age (chronological age) and treatment continued through twelve months. Motor skills were typically assessed using the following norm referenced standardized instruments: Bayley Scales of Infant Development, and the Griffiths Mental Developmental Scale. The frequency of treatment across these studies was highly variable and ranged from one sixty minute session per week to one treatment session per month and anywhere in between.11,49-53,57
16
therapy had an increase of 6.4 points on the Bayley psychomotor scale after adjusting for perinatal and background variables. Moreover, in subgroup analyses, these researchers found improvements in both motor and mental outcomes among children with a history of bronchopulmonary dysplasia and biological and social risk factors for preterm birth.57
One study in a Turkish population evaluated the effect of physical therapy intervention on actual age of motor milestone achievement. These authors recruited a small sample of 160 infants less than 34 weeks gestation and 2,000 grams from the Hacettepe University Hospital in Turkey. Infants were stratified into two groups: those with perinatal hypoxia or abnormal neurosonography, and infants without any risk other than prematurity. Researchers randomized the “low risk” infants into an interventional pediatric therapy group (N=78) or a control group (N=76). Children received approximately 17 therapy sessions between birth and two years of age. Over the course of follow up, researchers reported no statistically significant differences in age of motor milestone achievement
between these two groups.55
17
school age motor scores compared to controls.11,12 These studies evaluated
therapy services in a small population (< 100 children) of VLBW children without neurological problems (Table 2).
Presently, in the published literature, the majority of studies evaluated the effect of interventional therapy services delivered during the first year of life. The focus of treatment during this developmental window was most likely on fluidity of movement and independent transitions with pre ambulatory skills including head control, independent sitting, crawling, and walking with support. However, research evaluating the effect of therapy between one and two years of age and motor ability in later childhood is extremely limited. Therapy delivered during the toddler years may include facilitation of foundational skills of ambulation,
strengthening, coordination, and balance. This type of treatment may more directly carry over into improvement in more complex movement patterns.
V. Estimating Effects in Observational Data
Observational data are publically available to evaluate the effect of
interventional therapy on school age motor performance. However, use of these data is complicated by differences in measured and unmeasured characteristics that are independently associated with motor performance.
18
same probability of receiving treatment have similar values of measured
characteristics which are independently associated with the outcome. Once one conditions on the propensity score, any difference in the distribution of measured covariates between treatment groups should be from chance alone.
Currently, there are few studies to guide the researcher on how to
estimate the propensity score. Logistic regression is commonly used to estimate the propensity score; however the model is subject to several assumptions. The model assumes a linear relationship between continuous and ordinal variables and the logit of the dependent variable. Moreover one must consider the joint effect of variables. Inclusion of only main effects may misspecify the model and the resulting effect estimate may be biased. Yet, it appears in the published literature, that few researchers consider interactions or the functional form of the variable.58
19
20 Chapter 2 METHODS Data Source
We will address the specific aims of this study using existing data from the United States Early Childhood Longitudinal Study Birth Cohort.
I. Early Childhood Longitudinal Study, Birth Cohort (ECLS-B) Overview
The ECLS- B is a nationally representative longitudinal cohort of children born in the year 2001 who were followed through kindergarten. The study was sponsored by the United States Department of Education and the National Center for Education Statistics. Researchers obtained information on children’s physical, social, emotional, and cognitive development as well as health and education over the child’s early developmental years.
Research Design and Sampling
21
In 2001, the study team randomly sampled 13,500 newborns from United States birth certificates. Asian, Pacific Islander, and Chinese children were oversampled. Researchers also oversampled twins as well children who were born low birth weight. At the nine month time point, approximately 10,700 children and their parents participated in data collection. At two years of age, approximately 9,850 children remained in the study.
Data Collection
Researchers collected information on APGAR test scores, parental
background, and other child health information from the birth certificate records. Information on a child’s cognitive, social, emotional, and physical development were collected from children’s families, child care providers, and teachers.
Questionnaires:
At each wave of data collection families completed two questionnaires: the parent interview, and the resident father questionnaire. The parent questionnaire ascertained information regarding demographics, family structure, child
22
The resident father questionnaire ascertained information on education, employment history, childbearing, marital partner history, separations from the child, parenting practices, knowledge of child development, prenatal experiences, and home involvement.
Childcare providers also completed information on center services and staffing.
Direct Assessments:
Researchers completed direct child assessments in the area of cognitive performance, socio-emotional development, and physical performance over the follow up period. The study team assessed physical growth and motor
development with two standardized assessments: The Bayley Short Form Research Edition, and items from the Bruininks-Oseretsky Test of Motor Proficiency (Bruininks) and the Movement Assessment Battery for Children (MABC). They also obtained direct measures of weight, height, arm
circumference, and head circumference. The Bayley was administered at nine months and two years of age. Items from the Bruininks and MABC were
administered at preschool and kindergarten.
Low Birth Weight Cohort
The ECLS-B oversampled children who were less than 2,500 grams. At baseline, the cohort included approximately 1,650a children who were low birth
23
weight and 1,150 children who were very low birth weight. Approximately 2,900 children were preterm. Approximately ninety one percent of families completed parent interviews at two years (N≈2,500), preschool, and kindergarten (N≈1,900) waves of data collection.
Exposure Assessment
We will define interventional therapy services, as those therapies
implemented to facilitate motor development in childhood. Children frequently receive physical and occupational therapy services concurrently. Facilitation of gross motor skills falls within the scope of practice for both disciplines. Yet, there may be some divergence in the tactics that each discipline implements to
improve motor control. However, it is difficult to isolate the individual effects of each service. Therefore, we will consider interventional therapy as children who received physical and or occupational therapy.
The ECLS-B cohort assessed exposure to therapy services when the child was 9 months of age, at two years of age, during preschool, and at entry into kindergarten.
24
We will use the following criteria to define the exposure:
1) If the child received physical and or occupational therapy services any time between 9 and 24 months, they will be considered exposed. We will model this variable as a dichotomous outcome.
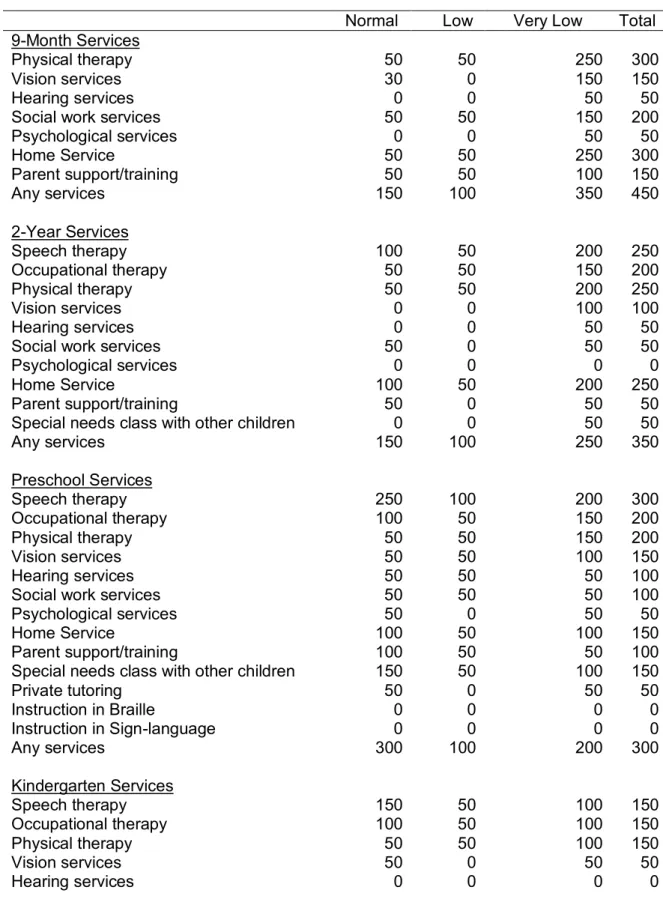
Table 3 provides the distribution of services that low birth weight children
received at nine months.
Figure 2. Exposure definition ECLS-B
“For each service, please tell me if child or your family received this service to help with special needs.”
_________________________________________________
9 months 24 months
Age in months
Outcome Assessment
The ECLS-B assessed motor development using both standardized assessments and parent report of developmental milestones.
25
We will assess the motoric ability of this low birth weight population using standardized assessments and caregiver report of developmental milestones.
Standardized assessments:
a) The Bayley Scales II of Infant Development is one of the most widely used standardized measures to assess cognitive and motor performance
among children 0-42 months of age. The instrument provides standard scores for two indices: the Mental Developmental Index (MDI) and the Psychomotor Developmental Index (PDI). Composite scores are
calculated for each index and compared to “typically” developing children of the same age. In the late 1980’s , the instrument was standardized using 1,700 US children born at 36-42 weeks who were normal weight for gestational age and without medical conditions or disabilities . The
concurrent validity of the Bayley Gross Motor Scale and the Peabody Developmental Motor Scale show a high correlation ( r=0.83).60
Researchers evaluated child developmental skills at one month intervals between 1-42 months of age. The assessment provides a standard score for the Psychomotor Index with a mean of 100.4 and a standard deviation of 16.2. The lowest Psychomotor Developmental Index standard score on this instrument is 50.
26
years of age. The BSF-R includes a subset of the BSID II. Researchers used Item Response Theory (IRT) modeling to select items that
represented all constructs of the BSID II. The study team established that the BSF-R could be used in place of the BSID II to measure
developmental performance. The scaled scores for this measure represent the same metric as the BSID II.61
Data from the Bayley Short Form are available at both 9 months and age 2. We will use this instrument as an indicator of baseline functional ability during the nine month assessment period.
b) Bruininks -Oseretsky Test of Motor Performance: The Bruininks is a norm referenced test designed to assess both gross and fine motor functioning among children between the ages of 4 1/2 to 14 1/2. The test was
standardized using 765 children in the United States with standard scores and percentile ranks by age grouping. The full test includes 46 items that are divided into the following subtests: running speed, agility, balance, bilateral coordination, strength, upper limb coordination, response speed, visual motor control, and upper limb speed and dexterity.62 Composite
27
discriminating between fine and gross motor ability. The instrument offers a valid measure of general motor proficiency.63
c) Movement Assessment Battery for Children (MABC)
The MABC is a widely used standardized assessment to evaluate motor impairments in children between the ages of 3 and 17. The assessment is frequently used by educators, physical therapists, and occupational
therapists to identify deficits in motor impairments. The assessment evaluates gross motor skills in the following areas: manual dexterity, aiming, catching, and balance. This instrument is frequently used to identify children with DCD.64
The ECLS-B did not administer the Bruininks or MABC in their entirety. Rather, investigators chose select items from these assessments.
Children to complete the following skills at each time point: skipping eight consecutive steps, hopping on one foot five times, walking backwards six steps on a taped line, standing on one foot for ten seconds, and jumping forward from a standing position.
28
hops as well as the greatest number of seconds the child balanced on one leg across all trials. For the jumping task, each child received two trials, and investigators reported the greatest distance the child jumped in inches.
Investigators also asked children to catch a thrown bean bag. The score for this skill was the number of times that the child caught the bean bag. The ceiling for this item was low, at five tosses.
We will model the association between receipt of interventional physical and occupational therapy and each individual preschool motor item. We will model the items scored on a pass fail basis as a dichotomous outcome. We will model jumping distance as a continuous outcome. Due to the low ceiling on the catching skill, we will not include this item in our analysis.
We will calculate the change score in jumping distance between preschool and kindergarten.
Developmental Milestones
Parents reported the age at which their child completed gross motor milestones at two time points: 9 months and two years.
29
24 months: the parents reported the age when their child started walking up the stairs alone
At nine and 24 months, ECLS-B included all children in the one on one assessment. When children reach preschool and kindergarten, children in wheelchairs did not participate in gross motor assessments. Children, who used an assistive device, were allowed to use that device during the assessment.
We will use caregiver report of developmental milestones to determine if the child is attaining typical developmental milestones during age appropriate time periods.
Method
30
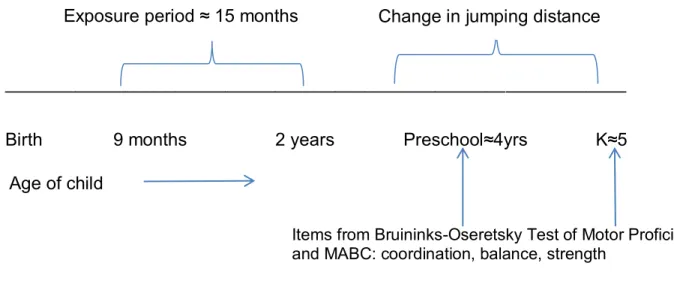
Figure 3: Study Design
______________________________________________________________
Birth 9 months 2 years Preschool≈4yrs K≈5 yrs
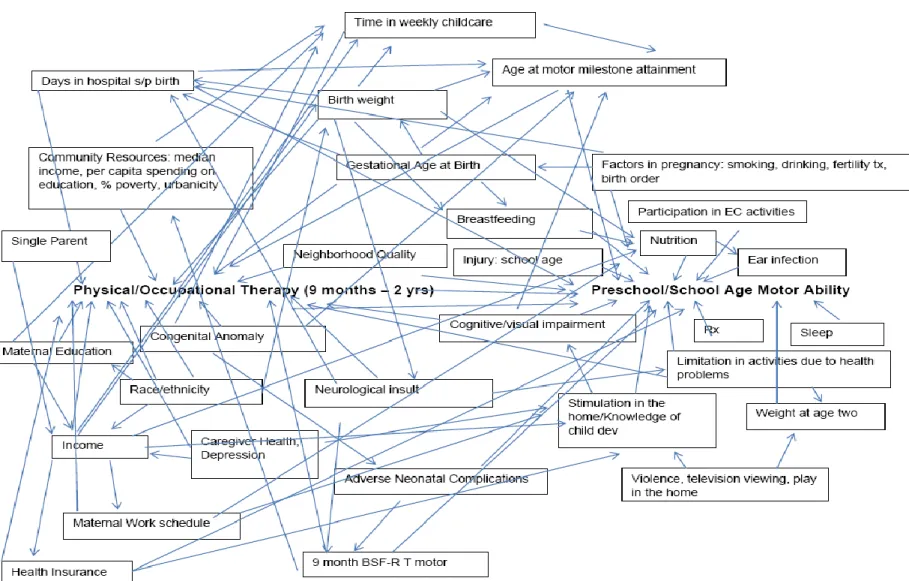
Directed Acyclic Graph:
This graph represents unidirectional causation between the therapy services, preschool motor ability, and confounding variables (Figure 4).65
Age of child
Items from Bruininks-Oseretsky Test of Motor Proficiency and MABC: coordination, balance, strength
31
Figure 4. Directed Acyclic Graph
32 Analysis Plan
I. General Overview
We will estimate the effect of interventional physical occupational therapy services on preschool motor development using data from the ECLS-B.
Children who receive therapy services in this low birth weight population are a heterogeneous group. Naturally, children will have different “propensities” to get services based upon a host of demographic, medical factors, and functional ability. Therefore, in these observational data, we may have confounding between therapy and motor development by severity of the child’s medical condition and or functional level. Children that are sicker are more likely to get services than those children who are healthier.
II. Estimating the average causal effect in observational data
We will use two general approaches to estimate the average treatment effect of therapy on preschool motor coordination. First we will use a standard logistic regression model while controlling for confounding. Second we will use a propensity score approach. We will estimate the predicted probability of
33
We will use measured confounders at nine months to control for confounding of the association between receipt of therapy services and preschool motor performance. These methods are based on the assumption of no unmeasured confounders in the data. Using a priori knowledge and a directed acyclic graph, we will include confounders associated with both receipt of therapy services and motor outcomes in the propensity score model. Moreover, to decrease bias and improve precision of the effect estimate, we will also include those covariates that are associated with motor development.66
A. Standard Model:
We will generate separate models to estimate the effect of interventional physical or occupational therapy services on preschool motor ability. We will use a logistic regression model, while controlling for relevant confounders, to
estimate the average effect of therapy on the ability to hop five times
independently, to skip eight consecutive steps, to maintain single leg stance for ten seconds, and to walk backwards six steps on a taped line.
Logit (Pr(Y=1) = B0+B1X1+B2X2 +BiXi+e
Using a linear regression model, we will model the estimated effect of therapy services on preschool jumping distance and on the change in jumping distance (preschool to kindergarten), while controlling for confounders.
34
We will consider the functional form of the covariate and evaluate the assumption of linearity between continuous and ordinal variables and our preschool outcomes for both the linear and logistic models.
We will consider modification of the effect estimate by maternal social characteristics (maternal education). These variables are based on interaction effects reported in the literature. We will use the Breslow Day test of
homogeneity to determine if there is heterogeneity of the odds ratio across strata of the covariate. Mostly likely we will encounter small cell sizes when the main effect is stratified by level of each interaction term. We will use a less stringent p value, p<0.10, since the power to detect interactions is often low.
B. Inverse probability of treatment weights (IPW)
We will create inverse probability of treatment weights to estimate the average treatment effect. These weights will create a pseudo population with the distribution of the covariates reflective of the combined sample. The weights are calculated from the propensity score, the predicted probability of treatment given a set of covariates.
The weights are as follows:
a) 1/(propensity score): if the child received therapy
35
Children with a low probability of receiving treatment and actually received therapy receive a large weight, and children with a low probability of treatment and didn’t get therapy receive a small weight.
We will stabilize the inverse probability of treatment weights by multiplying the IPW weight by the marginal prevalence of the treatment that they actually
received. Stabilizing the weights “normalizes” the range of the probabilities and increases the efficiency of the analysis. This prevents just a few people from contributing most of the observations in the pseudo population. Stabilizing the weights centers the weights around 1.0.67
We will estimate the average treatment effect of interventional therapy delivered between 9 months and age two on preschool motor ability using propensity scores weights from each estimation method. We will generate separate models for each preschool motor item as described above. For each weighted model, we will control for residual confounding.
Estimating the Propensity Score:
We will estimate the probability of a child being exposed to interventional therapy services between nine months and age two using four methods: logistic regression, a single classification tree, random forest classification, and bagging. The propensity score provides a weighted summary of the covariates.
36
1. Logistic Regression: We will estimate the propensity for early childhood therapy with a logistic regression model. This model assumes linearity between covariates and the receipt of therapy.
Logit (Therapy=1) = B0+ B1X1+B2X2+B2X3……+BpXp+e
2. A Non-Parametric Approach to Estimating the Propensity Score
Recursive partitioning
Recursive partitioning is a non-parametric classification and regression tree method which is commonly used in clinical medicine and genetics. This approach analyzes large numbers of predictor variables and complex interactions to create regression trees. The method partitions the data into subgroups which show the greatest heterogeneity with respect to the outcome. The method is objective and data driven, therefore the groupings will be automatically generated by the software package. The subgroups are objective and mutually exclusive.
37
The tree is grown according to the concept of “impurity reduction”. With each split in the building process, the association between the “daughter nodes” and the outcome are more homogenous compared to the previous parent nodes. As the tree grows, variables that are more strongly associated with the outcomes are chosen to split. Many classification trees rely on p values for tests of
association to determined cut points.68
This splitting continues until a “stop” point is set. Criteria for a “stop” point may include a threshold for the minimum number of observations in the node or a threshold for the minimum change in the impurity measure.68
Despite the popularity of this data mining method, results from a single classification tree are highly variable and are sensitive to the arrangement of the data. For example, the rank of each variable in the classification tree as well as the cut point of the variable is strongly dependent upon the distribution of
observations in the data. With small changes in the data structure, the order of variable selection or the cut point of the variable may change resulting in an alternative tree structure.68
Bagging and Random Forest Classification
Both bagging and random forest classification are tree based methods derived from machine learning theory which aggregate estimates over multiple individual trees to improve the predictive performance of the algorithm. Bagging randomly draws a series of bootstrap samples from the data, and creates
38
samples, the data will vary slightly from the previous sample. Furthermore, each individual tree may then vary, perhaps substantially, from the previous tree. The algorithm then aggregates the predicted probability of class membership over the series of classification trees.69
Random forest classification utilizes this same bootstrap method.
However, random forest adds an additional level of variability to the algorithm. During construction of the individual classification trees, a random sample of predictor variables is chosen to split the data at each node. Therefore, each individual tree is even more diverse compared to the trees from bagging alone.68
Although individual classification trees are inherently unstable, bagging and random forest classification have been shown to produce robust estimates. In both empirical and simulation studies, estimates aggregated over a series of classification trees, show improvements in prediction accuracy when compared to a single classification tree.70-73 Bagging is suggested to equalize the influence of given observations in the data. Thus, data points which strongly influence the classification algorithm are downweighted.68 Furthermore, the additional level of randomness introduced by random forest classification creates additional
diversity between trees with a lower upper bound of error.69 Overall, these
methods produce a more robust final estimate with decreased variability.69
We will generate predicted probabilities of class membership into interventional therapy between nine months and age two using logistic
39
These analyses will be performed using the R statistical platform. We will use the RandomForest (random forest), Ipred (bagging), and Tree (single
classification tree) packages. All categorical variables will be encoded as “factors” in the R environment. This transformation ensures that the R software recognizes these variables as categorical responses.
We will check the sensitivity of the error rate to our chosen parameters by allowing the number of trees to vary between 250 and 1,000 and the number of randomly chosen variables to vary between 2 to 7. The error rate for the
algorithm is generated from the 33% of the data remaining that was not used to form the classification trees. For example, with each bootstrap sample, the remaining data (≈33%) not in the sample is entered into the classification tree. The error in these out of bag predictions is collected over the series of trees to determine the final error rate over the forest. The error rate appears to be accurate if the predicted probabilities of class membership are aggregated across a sufficient number of trees. However, if the number of trees are too few, then the error rate may be upwardly biased.74 The algorithm may therefore be a better predictor of the outcome than suggested by the error rate.
We will assess balance of each method used to generate the propensity score by calculating the standardized difference of the weighted confounding variables between the treatment groups.
40
d= (xbar therapy-xbar no therapy)/sqrt(S2 therapy + S2 no therapy )/2)). 75 Although there is no
standard criterion to determine balance between treatment groups, researchers suggest a standardized difference of <0.10.76-78
Limitations of these approaches:
These approaches attempt to control for confounding due to non-randomization assignment of treatment. Propensity scores can balance the distribution of the covariates between the groups, so when conditioning on the propensity score, there is no longer unequal distribution of covariates between groups. Therefore the association is no longer confounded. However, this is dependent on the variables that are measured in the data as well as the variables that are included in the propensity score model. We still may have unmeasured confounding.
In addition, the propensity score model may be misspecified if the analyst does not consider the functional form of the confounders or higher order effects. We will consider two methods from machine learning theory that are free from these parametric assumptions.
Sources of Bias
1) Attrition and Selection Bias:
41
are missing data to generate the probability of treatment may differ from the children who have complete data.
Attrition between twenty four months and preschool/kindergarten is also a concern, as children who have preschool outcome data may differ, in meaningful ways, from children who do not have data on preschool motor outcomes. These data were collected as a larger study evaluating early childhood health,
development, and education so we do not anticipate that attrition would be related to children no longer receiving therapy services. Therefore, there would not be differential loss to follow up based on children doing “better” as a result of therapy.
The proportion of children with preschool follow up data was similar among children who did (87%) and did not (84%) receive therapy services between 9 months and 24 months.
Handling of missing data:
Although the assumption can’t be tested in the data, under the missing at random assumption, we will consider proc Iveware to impute the missing data.
42
for variation both within and between imputations. We will calculate the standard errors across imputations using Rubin’s Rule.79
Missing data and recursive partitioning:
Compared to standard regression methods, tree based approaches do not completely discard an observation with missing data. The observations that have missing data in a variable which is being partitioned are not included in that split. However, that observation will be included in other computations of variables where that observation has a data point. Random forest classification and bagging algorithms presently do not handle missing data. We will use complete covariate data to generate the predicted probability of treatment using these algorithms.
Sensitivity Analysis:
There is the potential for unobserved confounding of the effect estimate due to unmeasured variables that are not included in the propensity score.
We will examine the sensitivity of our effect estimates by restricting our sample to those children with overlapping propensity scores. From our sample with overlapping propensity scores, we will also exclude children who were treated most contrary to prediction. For example, we will exclude children who received therapy but had a propensity for treatment lower than the 1st percentile and children who did not receive therapy but had a propensity for treatment greater than the 99th percentile. We will also trim the sample using the 2.5th and
43
Simulation studies show, assuming a uniform effect of treatment, that asymmetric trimming of the propensity score leads to a reduction in bias in the presence of unmeasured confounding.80
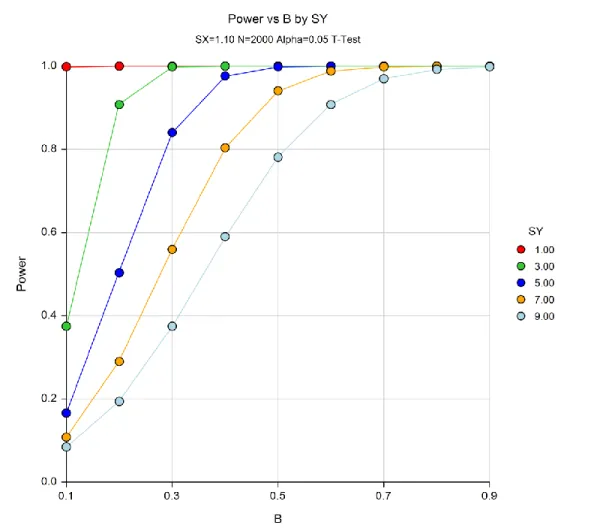
Power Calculations
The ECLS-B cohort included approximately 3000 low birth weight children. We estimated the standard deviation of gross motor performance among school age children to range between 1 to 10.81 At 80% power, we can expect to detect a change of 0.30 to 0.50 in the mean gross motor score.
ECLS-B: Logistic regression power analysis with imputed sample: early childhood
Power
Approximate Sample Size
Proportion receiving PT/OT
Probability of
Motor Delay Odds Ratio Alpha
0.09709 1255 60 0.2 1.1 0.05
0.46585 1255 60 0.2 1.3 0.05
0.84255 1255 60 0.2 1.5 0.05
0.97707 1255 60 0.2 1.7 0.05
44
45 Chapter 3
PRELIMINARY ANALYSES
VARIABLE DESCRIPTION AND CODING
EXPOSURE:
At two years of age, researchers asked families of participating children if their child was receiving related services between nine months of age and age two. Families reported the type of therapy that the child received during this time frame as well as the amount of therapy the child received per month. Families reported total amount of therapy across all disciplines. We defined receipt of either physical or occupational therapy between nine months and age two as a dichotomous variable.
OUTCOME:
Researchers administered select items from the Bruininks Oseretsky Test of Motor Proficiency and the Movement Assessment Battery for Children to assess preschool and school age motor ability. The child completed the
46
COVARIATES
Continuous Measures:
1. Center for Epidemiologic Studies-Depression Scale. The items were scored according the ECLS-B manual and then summed for each individual who had fewer than four missing responses. We coded subjects with four or more missing items as missing on the composite CES D variable.
2. Home Observation for Measurement of the Environment (HOME): Measures the extent of quality and amount of child stimulation in the home environment. Researchers administered a subset of 8 items from HOME-SF which included items from the following subscales: responsivity, acceptance, involvement, learning material, organization subscales.
These items are dichotomous answers with either positive or negative scores. These variables were recoded as “yes” =1 and “no”=0. Not observed were considered “missing”. The variables were summed to create the final HOME score at 9 months. Select questions from the HOME scale included: parent spontaneously vocalizes to the child, parent verbally response to the child’s vocalization, parent caresses or kisses the child at least once, parent neither slaps nor spanks child during visit, parent does not interfere with or restrict child more than three times during the visit, parent provides toys to the child to play with during visit, parent keeps child in visual range, child’s play environment is safe. We calculated the HOME score by taking the average across all items and multiplying this value by the number of question
47
3. Knowledge of Infant Development Inventory (KIDI): 11 items from the KIDI designed to assess knowledge of parental practices, developmental
processes, and infant norms of behavior. These 11 items were selected from 75 items on the KIDI questionnaire that the authors of the instrument
recommend as the most successful items in differentiating high versus low parenting knowledge. The questions describe typical infant behavior or parenting that would affect infant growth and behavior. Parental responses include: “agree”, “disagree”, “not sure”. These questions are a measure of an individual child’s development. We calculated the KIDI score by taking the average across all items and multiplying this value by the number of question completed.
4. Birth weight: all children in the cohort weighed less than 2500 grams. Birth weight was ascertained from the birth certificate record.
5. Number of siblings: This variable is continuous and indicates the total number of siblings either full, step, adoptive, or foster that lived in the household with the child at the nine month assessment
6. Gestational age at birth: gestational age was ascertained from the child’s birth certificate record
48
8. Length of hospital stay: at the nine month assessment families reported the number of days that the child stayed in the hospital at birth due to medical problems
9. Length of NICU stay: at the nine month assessment families reported the number of days since birth that the child stayed in the NICU
10. 9 month BSF-R Motor T Scores: standardized t scores of motor performance indicating the child’s ability relative to other children the same age. The
scores are norm references with a mean of 50 and a standard deviation of 10. Standardized T scores are adjusted for gestational age.
11. SES scale: this is a continuous measure for the composite of socioeconomic status which ranges from -2.10 to 2.25. The composite is the average of up to five measures: mother’s education, father’s education, mother’s occupation, father’s occupation, household income.
12. Hours per week in childcare: at the nine month assessment families reported the number of hours per week that their child spent in childcare.
13. Age of motor milestone attainment: Researchers asked parents to report whether their child could perform the behavior and when the child was first able to perform the skill. On the nine month assessment parents reported when the child first performed the following skills: sit alone and steady without support, crawl on hands and knees, pull to a standing position, and first
49
from the Minnesota Child Development Inventory. The appropriate age range for this measure is from birth through age six.
Categorical Variables
1. Parental education: We collapsed parental education into the following five categories: less than a high school education, high school, technical
training/some college, college degree, and graduate/professional training. We coded education as a series of indicator variables.
2. Caregiver Health: caregiver’s reported their current health status during the nine month follow up assessment. Responses included excellent, very good, good, fair, and poor. We coded these responses as a series of indicator variables.
3. Injury of the child: how often the child was seen for an injury by a professional since the child has lived in the home
50
5. Single parent status: researchers asked respondents if a spouse or partner lives in the household. This variable is coded as a dichotomous variable where 1=”yes” and 0=”No”
6. Help or advice with childcare: Researchers asked the primary caregiver, who you would ask for care and advice about your child. This variable was
collapsed into a dichotomous variable where: 1=yes, the caregiver received advice, and 0= no, the caregiver had no one to ask for advice.
7. Health Insurance: at the nine month assessment parents reported whether or not the child was covered by health insurance as well as the type of insurance plan. Researchers asked the respondent about the following health
insurance plans: private, Medicaid, SCHIP, military, Indian Health Service, and other government programs (Medicare, State sponsored health plan). 1=yes and 0 = no. This variable is coded as a series of dichotomous variables.
8. Race/Ethnicity: We collapsed race into the following categories: White Non- Hispanic, African American, Hispanic, Asian, and Other. We coded this variable as a series of indicator variables.
51
10. 9 month questionnaire: Injury in the last three months: Families were asked “Since you have lived here, how many times has your child seen a doctor or other medical professional or visited a clinic or ER”. The range of responses included never, once, twice, more than three times. We coded this variable as a series of disjoint indicator variables.
11. Caregiver Health at nine months: This variable is an ordinal variable ranging from excellent to poor. Researchers as the respondent on the nine month questionnaire to rate their health in general. The responses ranged from excellent to poor. We coded this variable as a series of indicator variables.
12. Urbanicity: This variable is a coded as a nominal variable with three categories: urban (inside urban area), urban (inside urban cluster), rural.
13. Region: This variable indicated the region where families resided at the time of the 9 month assessment. This variable is coded as a nominal variable with the following categories: Northeast, Midwest, South, and West.
I. PRELIMINARY ANALYSES
DESCRIPTIVE ANALYSIS: LOW BIRTH WEIGHT COHORT
52
than children who did not receive therapy (29 weeks vs. 34 weeks). Overall children in this cohort who received therapy were on average very low birth weight (1138 grams vs.1785 grams) and demonstrated a lower functional ability at nine months. Children in the treatment group were hospitalized three times (75 days vs. 24 days) as long after birth and were five times as likely not to be sitting independently (45% vs. 7%) at the nine month follow up visit compared to children who did not receive treatment. Only 23% of children in the treatment group were cruising along furniture where 63% of children in the untreated group had attained this skill (Table 4).
Exploration of Confounding
We conducted exploratory analyses to determine: variables that were associated with receipt of therapy services between nine months and age two, variables that were predictive of preschool motor ability, and the functional form of the relationship between covariates and preschool motor ability. We entered a host of candidate variables into the RandomForest package in R version 2.1 (Table 5). The RandomForest package does not support missing data values. The percent of covariates missing data were extremely small ( <5%) with exception of APGAR and Bayley Motor T scores in which 15% of children were missing data for these measures. In this exploratory analysis, we used proc IVEware in SAS version 9.2 to impute the missing values.
53
upper or lower extremity mobility indicated by a physician, the child’s length of hospital stay after birth, and birth weight had the highest mean decrease in accuracy and were very strong predictors of therapy receipt (Figure 6). The mean decrease in accuracy is the difference in classification accuracy using the out of bag data when the variable is included and the classification accuracy when the values of the variable in the out of bag variable are permuted randomly. A higher mean decrease accuracy score indicates a variable of greater
importance in prediction of receipt of early childhood therapy services. 69 Other strong predictors of therapy included the child’s 9 month BSF-R Motor T score, gestational age, race, socioeconomic status, and the inability of the child to attain early developmental milestones (sitting, pulling to stand, and crawling) (Figure 7).
Table 6 describes the importance of candidate variables to predict
preschool motor ability. The ECLS-B did not administer the Bruininks Oseretsky Test of Motor Proficiency or Movement Assessment Battery for Children in its entirety. To explore this association, we calculated an overall motor score from the available administered items. We took the average of the following items: skipping, walking backwards, hopping left and right, balance left and right and multiplied the average by number of items without missing data. Children with a score of one standard deviation below the sample mean were considered to have impaired preschool motor coordination.
54
population. Nine month BSF-R Motor T score, socioeconomic status, amount of time the child spent in childcare were also relatively strong predictors of
preschool motor impairment (Table 8).
Figures 8 through 12 provide partial dependence plots between covariates and the logit of preschool motor impairment. The graphs characterize the
relationship between an individual predictor variable and the probability of preschool motor impairment from the Random Forest classification algorithm. The y axis is on the logit scale. The partial dependence plot represents the marginal effect or average trend of the variable after averaging out the effects of the other predictor variablesb in the model.82 The logit of the probability of preschool motor impairment decreased with increasing birth weight up through 2500 grams. There was an upward trend at the upper range of low birth weight (Figure 9). There was a monotonic linear trend between both gestational age and length of hospital stay and the logit of preschool motor impairment. The logit of the probability of a preschool motor impairment decreased with increasing gestational age and increased with length of hospital stay. The relationship between socioeconomic status and preschool motor impairment was U shaped. The relationship between 9 month BSF-R motor T score and the logit of
bVariable in Random Forest classification model:9 month Bayley Motor T Score, Weekly
55
preschool motor impairment showed a relatively linear decreasing trend through a score of 50. Yet, there was a small upward trend with BSF-R score above 60 (Figure 8). The relation between many covariates (APGAR score, KIDI score, SES level, gestational age, and nine month BSF-R Motor T score) and the logit of the probability of therapy exposure was nonlinear (Figures 13-20) (Table 7).
Building the propensity score:
In our baseline cohort there was marked heterogeneity in children’s baseline functional ability. We evaluated candidate confounders for the propensity to receive therapy, among children with similar baseline functional ability or “need” for therapy.
We defined an at risk cohort of children who had similar baseline levels of functional ability. This included children who were sitting independently on the nine month assessment, were without a known upper or lower extremity mobility problem, and who were hospitalized for a month or more after birth
(N≈700;rounded to the nearest 50).
Directed Acyclic Graph
56
condition, birth weight, weekly hours in childcare, stimulation in the home, 9 month BSF-R Motor T Score.
Modeling Variables Associated with Exposure and Outcome in the Unexposed:
We evaluated the association between covariates and receipt of therapy services as well as preschool motor performance in the unexposed. We chose the skipping item as a strong indicator of motor coordination. Children with a visual deficit (OR: 0.77 95% CI: 0.22, 2.70) or with a hospital stay after birth of more than a month (45-60 days; OR: 0.74 95% CI 0.33, 1.64) had a decreased odds of successfully skipping eight consecutive steps. Increased age at which the child cruised (0.83, 95% CI 0.66, 1.05) was also associated with a decreased odds of passing the skipping assessment. Children who spent more than 40 hours per week in childcare were 0.56 times (OR: 0.56 95% CI 0.23, 1.46) as likely to be successful with the skipping task compared to children who were in childcare less than ten hours per week. Children whose parents had a high school education or some college were 20% to 80% more likely to skip eight consecutive steps successfully compared to children without a high school education (Table 8).
In this sample, length of hospital stay and age at which the child achieved early developmental motor milestones were strongly associated with receipt of either occupational or physical therapy. (Table 8) Also, children who had a visual deficit were 4.54 times as likely (OR: 4.54, 95% CI: 2.44, 8.45) to receive