J
OURNAL OF
C
LINICAL
O
NCOLOGY
O R I G I N A L R E P O R TChanges in Clinical Context for Kaposi
’
s Sarcoma and
Non-Hodgkin Lymphoma Among People With HIV
Infection in the United States
Elizabeth L. Yanik, Chad J. Achenbach, Satish Gopal, Anna E. Coghill, Stephen R. Cole, Joseph J. Eron, Richard D. Moore, W. Christopher Mathews, Daniel R. Drozd, Ayad Hamdan, Mary E. Ballestas, and Eric A. Engels
Listen to the podcast by Dr Little atwww.jco.org/podcasts
A B S T R A C T
Purpose
The biology of HIV-associated cancers may differ depending on immunologic and virologic context during development. Therefore, an understanding of the burden of Kaposi’s sarcoma (KS) and non-Hodgkin lymphoma (NHL) relative to antiretroviral therapy (ART), virologic suppression, and CD4 count is important.
Patients and Methods
KS and NHL diagnoses during 1996 to 2011 were identified among patients with HIV infection in eight clinical cohorts in the United States. Among patients in routine HIV clinical care, the proportion of cases in categories of ART use, HIV RNA, and CD4 count at diagnosis were described across calendar time. Person-time and incidence rates were calculated for each category.
Results
We identified 466 patients with KS and 258 with NHL. In recent years, KS was more frequently diagnosed after ART initiation (55% in 1996 to 2001v76% in 2007 to 2011;P-trend = .02). The proportion of patients with NHL who received ART was higher but stable over time (83% overall;
P-trend = .81). An increasing proportion of KS and NHL occurred at higher CD4 counts (P,.05 for KS and NHL) and with undetectable HIV RNA (P,.05 for KS and NHL). In recent years, more person-time was contributed by patients who received ART, had high CD4 counts and had undetectable HIV RNA, whereas incidence rates in these same categories remained stable or declined.
Conclusion
Over time, KS and NHL occurred at higher CD4 counts and lower HIV RNA values, and KS occurred more frequently after ART initiation. These changes were driven by an increasing proportion of pa-tients with HIV who received effective ART, had higher CD4 counts, and had suppressed HIV RNA and not by increases in cancer risk within these subgroups. An improved understanding of HIV-associated cancer pathogenesis and outcomes in the context of successful ART is therefore important.
J Clin Oncol 34:3276-3283. © 2016 by American Society of Clinical Oncology
INTRODUCTION
People with HIV infection have a highly elevated risk of Kaposi’s sarcoma (KS) and non-Hodgkin lymphoma (NHL)1related to loss of immunologic control of human herpesvirus-8 and Epstein-Barr virus, respectively.2,3 With widespread use of ef-fective antiretroviral therapy (ART), risk has de-clined dramatically in the HIV population.4,5 However, KS and NHL incidence remains much higher than in the general population,6and
eleva-tions may persist after patients with HIV infection
have achieved virologic suppression and immune recovery.7These HIV-associated cancers also con-tribute substantially to the total US KS and NHL burden.8
Trends in earlier ART initiation and in-creased emphasis on linkage and retention into care have changed the characteristics of the HIV population. Among US patients with HIV in clinical care in 2008, 83% had been prescribed ART and 72% had suppressed levels of HIV RNA compared with 74% prescribed ART and 46% with suppressed HIV RNA in 2000.9Given this
shift, the fraction of KS and NHL cases occurring
Elizabeth L. Yanik, Anna E. Coghill, and Eric A. Engels, National Cancer Institute,
Rockville; Richard D. Moore, Johns Hopkins University, Baltimore, MD; Chad
J. Achenbach, Northwestern University, Chicago, IL; Satish Gopal, Stephen R.
Cole, and Joseph J. Eron, University of North Carolina at Chapel Hill, Chapel Hill, NC; W. Christopher Mathews, University
of California, San Diego, San Diego, CA; Daniel R. Drozd, University of
Washington, Seattle, WA; Ayad Hamdan, Beth Israel Deaconess Medical Center,
Boston, MA; and Mary E. Ballestas, University of Alabama at Birmingham,
Birmingham, AL.
Published online ahead of print at
www.jco.orgon August 8, 2016.
Supported by the Intramural Research Program of the National Cancer Institute
(E.L.Y., A.E.C., and E.A.E.), an Intramural AIDS Research Fellowship Award from
the Office of AIDS Research at the National Institutes of Health (E.L.Y.), and
National Institutes of Health Grant No. R24 AI067039 to the Centers for AIDS Research Network of Integrated Clinical
Systems.
Presented at the International Conference
on Malignancies in AIDS and Other Acquired Immunodeficiencies, Bethesda, MD, October 26 and 27, 2015.
Authors’disclosures of potential conflicts of interest are found in the article online at
www.jco.org. Author contributions are found at the end of this article.
Corresponding author: Elizabeth L. Yanik, PhD, Infections and
Immuno-epidemiology Branch, Division of Cancer Epidemiology and Genetics, National
Cancer Institute, 9609 Medical Center Dr, Room 6E-216, Rockville, MD 20850;
e-mail: [email protected].
© 2016 by American Society of Clinical Oncology
0732-183X/16/3427w-3276w/$20.00
among patients with HIV administered effective ART may be increasing despite the benefits of ART.
Because viral suppression and immune recovery combat KS and NHL development, the biology of cancers that arise despite effective ART likely differ from those that develop in patients with HIV and uncontrolled viremia and severe immunosuppression. An understanding of the KS and NHL burden among people with HIV infection who have received effective ART is important because these cancers may require different therapeutic approaches. In this study, we characterize KS and NHL diagnoses relative to ART use, virologic suppression, and CD4 count in a large clinical HIV population.
PATIENTS AND METHODS
The study population included adults with HIV infection from eight US HIV clinical cohorts that comprise the Centers for AIDS Research Network of Integrated Clinical Systems (CNICS) and followed from 1996 to 2011.10This calendar period spans from the beginning of widespread combination ART availability to the last year of systematic identification of cancer diagnoses in CNICS. CNICS collects data through electronic medical records, including information on demographics, ARTuse, diagnoses, CD4 count, and HIV RNA measurements. Cancer diagnoses have been verified through a standardized process.11Each CNICS site obtained local institutional review board approval. Demographic characteristics were described for patients with KS and NHL who received a diagnosis on or after afirst visit at a CNICS site over three calendar periods (1996 to 2001, 2002 to 2006, and 2007 to 2011). Diagnoses were categorized as having occurred in or out of routine clinical care. Start of routine clinical care was defined as the date when the second of two consecutive HIV outpatient visits occurred$1 month apart and within 6 months. Routine clinical care was considered to continue as long as clinical visits were not.12 months apart. If a patient went.12 months without a visit, the case was recategorized as out of routine clinical care until the original two-visit criterion was met again. Trends in the pro-portion of KS and NHL cases diagnosed in routine care across calendar periods were evaluated by Cochran-Armitage test.
We restricted further analyses to time in routine clinical care because we could obtain reliable information on ART and laboratory measures during this time only. KS and NHL cases diagnosed during routine care were characterized based on ART use, immune status, and virologic status at the time of cancer diagnosis. We also specifically characterized cases of
diffuse large B-cell lymphoma (DLBCL), the most common NHL subtype. ART initiation was defined as thefirst concurrent use of three or more different antiretroviral medications. ART status was categorized as no ART, ART initiation , 6 months prior (when immune reconstitution
in-flammatory syndrome is most likely),12 or ART initiation$ 6 months prior. Immune status at cancer diagnosis was based on the latest CD4 count within 6 months before cancer diagnosis. Virologic status was based on the latest HIV RNA value 3 to 9 months before cancer diagnosis. We assessed HIV RNA measurements 3 months earlier than CD4 counts because HIV RNA is highly variable over short periods, and values closer to cancer diagnosis may be affected by management changes during diagnostic evaluation for cancer. If CD4 count or HIV RNA values were unavailable in these windows, the cases were excluded from analyses of those charac-teristics (,15% of cases were excluded for this reason).
We described the proportion of KS and NHL cases in each ART category as well as in CD4 count and HIV RNA categories across calendar periods. We evaluated changes in the proportion of cases in each category across periods by usingx2as a global test for differences and the Cochran-Armitage test to
evaluate trends for particular categories over time. Because CD4 count and HIV RNA can be evaluated as continuous variables, changes in the mean CD4 count and HIV RNA (log10-transformed) were also described nonparametrically by
using LOWESS curves,13and trends were evaluated with linear regression. To evaluate whether changes in the characteristics of cancer cases resulted from changes in the underlying HIV population or changes in cancer risk, we divided person-time in routine clinical care into the aforementioned ART, CD4 count, and HIV RNA categories. Person-time was used to calculate KS and NHL incidence rates, and Poisson regression was used to evaluate time trends in incidence.
Standardized incidence ratios were calculated within categories that compared observed cancer counts with expected counts. Expected counts were calculated within strata of age, sex, and race by multiplying follow-up time observed in each stratum by stratified incidence rates in the general population obtained from SEER cancer registries.14 KS incidence rates were based on 1973 to 1979 SEER data because subsequent rates are heavily influenced by the HIV epidemic.8
RESULTS
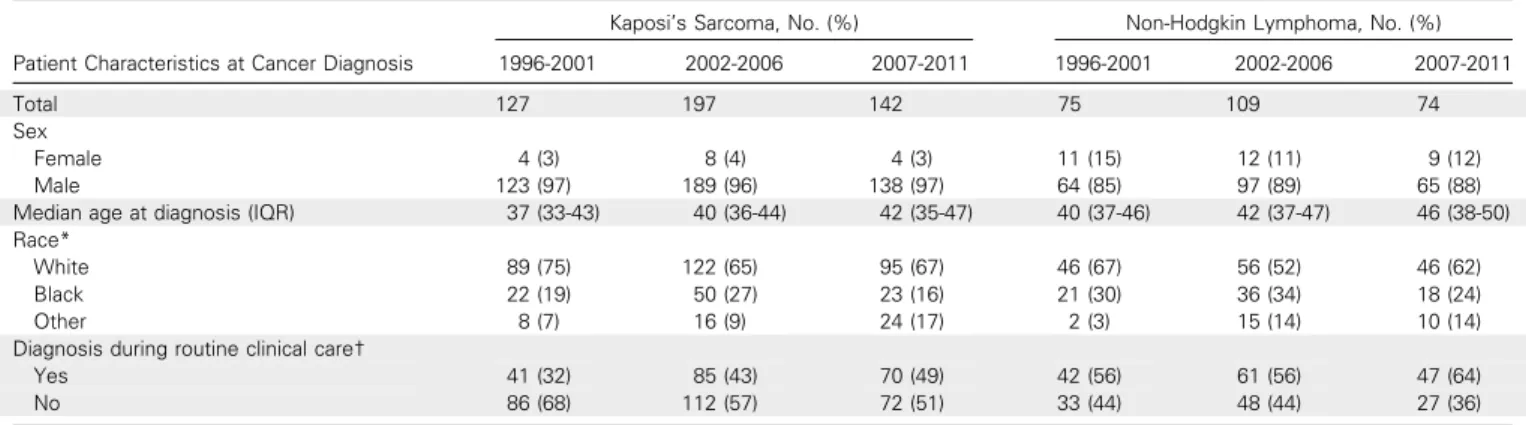
Among 24,901 patients in CNICS during 1996 to 2011, there were 466 KS diagnoses and 258 NHL diagnoses, including 135 DLBCL diagnoses. Most cases were among white men (Table 1). The
Table 1.Patients With Kaposi’s Sarcoma and Non-Hodgkin Lymphoma Diagnosed in the Centers for AIDS Research Network of Integrated Clinical Systems From 1996 to 2011
Patient Characteristics at Cancer Diagnosis
Kaposi’s Sarcoma, No. (%) Non-Hodgkin Lymphoma, No. (%)
1996-2001 2002-2006 2007-2011 1996-2001 2002-2006 2007-2011
Total 127 197 142 75 109 74
Sex
Female 4 (3) 8 (4) 4 (3) 11 (15) 12 (11) 9 (12)
Male 123 (97) 189 (96) 138 (97) 64 (85) 97 (89) 65 (88)
Median age at diagnosis (IQR) 37 (33-43) 40 (36-44) 42 (35-47) 40 (37-46) 42 (37-47) 46 (38-50)
Race*
White 89 (75) 122 (65) 95 (67) 46 (67) 56 (52) 46 (62)
Black 22 (19) 50 (27) 23 (16) 21 (30) 36 (34) 18 (24)
Other 8 (7) 16 (9) 24 (17) 2 (3) 15 (14) 10 (14)
Diagnosis during routine clinical care†
Yes 41 (32) 85 (43) 70 (49) 42 (56) 61 (56) 47 (64)
No 86 (68) 112 (57) 72 (51) 33 (44) 48 (44) 27 (36)
Abbreviation: IQR, interquartile range.
*Seventeen patient cases of Kaposi’s sarcoma and eight patient cases of non-Hodgkin lymphoma are missing information on race.
A
0 20 40 60 80 100
1996–2001 2002–2006 2007–2011
Calendar Period of Kaposi's Sarcoma Diagnosis ART Start Before Kaposi's Sarcoma Diagnosis
ART Start ≥ 6 Months Before Diagnosis
ART Start < 6 Months Before Diagnosis
No ART ART Start ≥ 6 Months Before Diagnosis
ART Start < 6 Months Before Diagnosis
No ART
B
0 20 40 60 80 100
1996–2001 2002–2006 2007–2011
Calendar Period of Non-Hodgkin Lymphoma Diagnosis ART Start Before Non-Hodgkin
Lymphoma Diagnosis
E
Log HIV RNA (log
10
copies/mL)
HIV RNA at Kaposi's Sarcoma Diagnosis
Year of Kaposi's Sarcoma Diagnosis
Fit 95% Confidence Limits
1996 2000 2004 2008 2012
0 2 4 6
F
Log HIV RNA (log
10
copies/mL)
2000 2004 2008 2012
HIV RNA at Non-Hodgkin Lymphoma Diagnosis
Year of Non-Hodgkin Lymphoma Diagnosis
Fit 95% Confidence Limits 1
2 3 4 5 6
C
CD4 Count (cells/
μ
L)
Percent Percent
Year of Kaposi's Sarcoma Diagnosis
Fit 95% Confidence Limits
1996 2000 2004 2008 2012
CD4 Count at Kaposi's Sarcoma Diagnosis
0 200 400 600 800
D
CD4 Count (cells/
μ
L)
1996 2000 2004 2008 2012
CD4 Count at Non-Hodgkin Lymphoma Diagnosis
Year of Non-Hodgkin Lymphoma Diagnosis
Fit 95% Confidence Limits 0
200 400 600 800 1,000
Fig 1.Antiretroviral therapy (ART), immune, and virologic status of patients with HIV in routine clinical care who were diagnosed with Kaposi’s sarcoma and non-Hodgkin lymphoma. (A) and (B) The proportion of Kaposi’s sarcoma and non-Hodgkin lymphoma patient cases that occurred at various times relative to ART initiation over three calendar periods. (C) and (D) The distribution of CD4 counts at diagnosis of Kaposi’s sarcoma and non-Hodgkin lymphoma across time, including a LOWESS curve to illustrate the smoothed trend over time. (E) and (F) The distribution of HIV RNA values on the log10scale at diagnosis of Kaposi’s sarcoma and non-Hodgkin lymphoma across time, including a LOWESS curve. ART start was defined as
median age at cancer diagnosis increased across time from 37 years for KS and 40 years for NHL during 1996 to 2001 to 42 years for KS and 46 years for NHL during 2007 to 2011 (Table 1).
Among KS cases, 42% (n = 196) were diagnosed during routine clinical care, with the proportion increasing over time from 32% in 1996 to 2001 to 49% in 2007 to 2011 (P-trend = .005; Table 1). Among NHL cases, 58% (n = 150) were diagnosed during routine clinical care. This proportion did not change significantly across time (P-trend = .354). In the most recent calendar period, 64% of cases were diagnosed during routine care.
Among cases diagnosed during routine care, ART status at diagnosis changed over time for KS (P= .019) but not for NHL (P= .809). Although only 26% of KS diagnoses occurred$6 months after ART initiation during 1996 to 2001, most KS cases were diagnosed $ 6 months after ART initiation in the later periods, reaching 60% in 2007 to 2011 (P-trend = .008;Fig 1A). For NHL, 68% of all diagnoses occurred$6 months after ART initiation, and this proportion did not change noticeably over time (Fig 1B).
The mean CD4 count at diagnosis increased with calendar time for both KS (P= .001) and NHL (P,.001). For KS, this increase was most notable during 2003 to 2008, whereas a general increasing trend was observed over the entire period for NHL (Figs 1Cand1D). During 2007 to 2011, 15% of KS cases and 24% of NHL cases were diagnosed at CD4 counts$500 cells/mL, whereas fewer than one half were diagnosed at CD4 counts,200 cells/mL. The mean HIV RNA value (3 to 9 months before cancer diagnosis) decreased over time for both KS and NHL (Figs 1Eand 1F), but the decrease was significant only for NHL (P= .014 for NHL;P= .087 for KS). During 2007 to 2011, 29% of KS cases and 51% of NHL cases were diagnosed when HIV RNA was suppressed (,500 copies/mL).
For the 82 DLBCL cases diagnosed during care, patterns were similar to those for NHL overall (AppendixFig A1, online only). The proportion of diagnoses occurring$6 months after ART initiation did not change significantly over time (P= .616), but DBLCL di-agnoses were made at higher CD4 counts and lower HIV RNA levels in more recent calendar years (P-trend , .001 for CD4 count; P-trend = .018 for HIV RNA; AppendixFig A1). During 2007 to 2011, 85% of DLBCL diagnoses were made$6 months after ART initiation, 26% were diagnosed at CD4 counts$500 cells/mL, and 67% were diagnosed when HIV RNA was suppressed.
We also observed calendar trends when examining the underlying person-time of patients followed during routine care. Across time, more person-time was contributed when patients had received ART for$6 months and less by patients who had not initiated ART (Fig 2A). In more recent calendar years, more person-time was contributed by patients with higher CD4 counts and lower HIV RNA values (Figs 2Band2C). During 2007 to 2011, 45% of person-time was contributed by patients with CD4 counts.500 cell/mL compared with 30% in 1996 to 2001. Similarly, 76% of person-time was contributed by patients with suppressed HIV RNA in 2007 to 2011 compared with 45% in 1996 to 2001.
Overall, KS and NHL incidence rates decreased 5% and 8% per year, respectively, during 1996 to 2011 (incidence rate ratios, 0.95 and 0.92 per year, respectively; Table 2). KS incidence de-creased across time among patients who had not received ART and increased among those with HIV RNA values between 500 and
50,000 copies/mL. KS incidence did not significantly change for any other ART, CD4 count, or HIV RNA category, although a borderline decrease was observed among patients with HIV RNA,500 copies/mL (Table 2). NHL incidence decreased among patients who received ART for.6 months, among those with CD4 counts ,200 cells/mL, and among those with HIV RNA values ,500 copies/mL (Table 2). No changes in NHL incidence over time were observed for other ART, CD4 count, or HIV RNA categories.
B
0 20 40 60 80 100
1996–2001 2002–2006 2007–2011
Calendar Period Person-Time by CD4 Count Status
500+ 350–499 200–349 < 200
C
0 20 40 60 80 100
1996–2001 2002–2006 2007–2011
Calendar Period
Person-Time by HIV RNA Measurement Status
> 50,000 500–50,000 < 500
A
0 20 40 60 80 100
1996–2001 2002–2006 2007–2011
Calendar Period Person-Time by ART Status
ART Start ≥ 6 Months Before Diagnosis
ART Start < 6 Months Before Diagnosis
No ART
Percent
Percent
Percent
Across all calendar periods, KS incidence in every ART, CD4 count, and HIV RNA category was higher than general population rates (Table 3). Compared with the general US population, KS incidence in 2007 to 2011 was 710 times higher among those who received ART for$6 months, 430 times higher among those with CD4 counts$500 cells/mL, and 430 times higher among those with HIV RNA,500 copies/mL. NHL incidence was also higher than general population rates in almost every category across all periods. Compared with the general population, NHL incidence in 2007 to 2011 was 3.4 times higher among those who received ART for$6 months, 3.1 times higher among those with CD4 counts$500 cells/mL, and 2.9 times higher among those with HIV RNA,500 copies/mL.
DISCUSSION
Among US patients with HIV infection, the clinical context in which KS and NHL occur has changed considerably during the effective ARTera. Since 1996, more cases have been diagnosed after entry into routine clinical care, with 64% of NHL cases and 49% of KS cases diagnosed during routine care in 2007 to 2011. As anticipated, the overall incidence of KS and NHL decreased over calendar time, likely due to increasing use and effectiveness of ART. However, more cases were diagnosed among patients who either received ART, had high
CD4 counts, or had suppressed HIV RNA. In fact, in 2007 to 2011, most cases occurred$6 months after ART initiation and in patients with CD4 counts $ 200 cell/mL. For these cancers, new clinical approaches may be needed because the clinical presentation, treatment response, and prognosis likely differ from KS and NHL diagnosed in the setting of severe immunosuppression.
The growing fraction of cancers diagnosed during routine clinical care likely reflects the larger proportion of the HIV pop-ulation engaged in care in more recent times. For example, among US individuals with HIV infection entering care, an estimated 82% were retained in routine care in 2008 compared with 61% in 2000.15 Engagement in routine care could reduce cancer risk by encouraging ART initiation and adherence, and one might anticipate that en-gagement in care would facilitate detection of cancers at an early stage, which would lead to a facilitation of treatment. Because our population was defined by attendance at an HIV clinic, we could not obtain information on cancers among people who never visit an HIV clinic. Thus, we likely underestimated the total proportion of cancers in patients outside routine care and could not calculate accurate incidence rates in these patients.
For KS and NHL diagnosed during routine care, several patient characteristics changed over calendar time that reflect changes in treatment of the underlying HIV population. The proportion of KS cases diagnosed among patients who received ART increased not because KS incidence increased in patients who
Table 2.Incidence Rates of Kaposi’s Sarcoma and Non-Hodgkin Lymphoma Among Patients With HIV in Routine Clinical Care
Time-Updated Patient Characteristics
Incidence Rate (per 100,000 person-years) by Calendar Period
IRR (per increasing calendar year) P-Trend
1996-2001 2002-2006 2007-2011
Kaposi’s sarcoma
Total 243.7 232.2 168.1 0.95 .003
ART status
No ART 501.5 373.8 323.4 0.94 .043
ART,6 months 733.8 1,040.1 795.6 1.00 .999
ART$6 months 88.3 164.0 119.4 1.01 .988
CD4 count (cells/mL)
,200 674.2 816.7 609.7 0.98 .540
200-349 129.2 234.2 255.6 1.03 .565
350-499 36.7 114.0 136.7 1.05 .461
$500 46.1 36.2 61.5 1.05 .528
HIV RNA (copies/mL)
.50,000 729.0 1,088.9 967.8 1.01 .660
500-50,000 141.5 166.6 356.6 1.10 .037
,500 152.3 104.3 85.7 0.93 .051
Non-Hodgkin lymphoma
Total 249.6 166.6 112.9 0.92 ,.001
ART status
No ART 200.6 186.9 202.1 0.99 .902
ART,6 months 467.0 485.4 331.5 0.95 .385
ART$6 months 238.4 146.9 91.0 0.90 ,.001
CD4 count (cells/mL)
,200 855.7 539.0 336.4 0.93 .012
200-349 96.9 87.8 180.4 1.04 .537
350-499 36.7 156.7 85.9 0.98 .757
$500 23.1 63.4 67.7 1.03 .644
HIV RNA (copies/mL)
.50,000 729.0 518.5 414.8 0.94 .165
500-50,000 101.1 230.6 231.8 1.05 .335
,500 228.4 83.4 78.5 0.90 .004
received ART but because of the growing fraction of the HIV population administered ART. Similar patterns were seen for KS and NHL with respect to HIV RNA and CD4 count (ie, a larger proportion of cases among patients with suppressed HIV RNA and high CD4 counts), even as KS and NHL incidence declined or remained constant in these strata. Again, these trends resulted from the consistently increasing fraction of the HIV population who live with virologic control and immune competence. Although we evaluated trends in ART use, HIV RNA, and CD4 count separately, these clinical characteristics and the changes in the underlying HIV population are inherently related. Improvements in ART access and earlier initiation lead to earlier suppression of HIV RNA and, ultimately, higher CD4 counts.
Other changes in the HIV population have influenced the clinical characteristics of cancer cases. For instance, cancers in the HIV population are typically diagnosed at younger ages than in the general population, which reflects the younger age distribution of the HIV population.16 Nonetheless, both KS and NHL arose at older ages in more recent calendar years in the current study. As the HIV population continues to age, the age distribution of cancer cases will likely continue to shift to older ages. Furthermore, one would expect to see more cancers etiologically related to aging.
Changing clinical characteristics of these cancers may also reflect changing biology. For example, cancers that develop in patients with HIV infection after immune recovery may manifest genetic or epigenetic changes that facilitate evasion from the immune system, whereas cancers that arise in more immuno-suppressed populations may not face the same degree of immune
selection and may not manifest these changes.17 Given that human herpesvirus-8 and Epstein-Barr virus are genetically heterogeneous,18,19another possibility is that patients in whom KS or NHL develop after immune reconstitution may be infected with more pathogenic strains. For NHL, the distribution of subtypes has changed over time, with DLBCL and lymphoma of the CNS making up a smaller proportion of diagnoses in more recent years, whereas Burkitt lymphoma and other lymphoma subtypes now make up a larger proportion of diagnoses.20 However, when we limited analyses to one subtype, DLBCL, we still observed changes in the immunologic and virologic context of the diagnoses over time. As the HIV population ages, KS and NHL cases may resemble cases seen in elderly populations.21Among patients administered ART, the presence of circulating T cells with immunosenescent pheno-types is associated with a KS diagnosis, which indicates that cancer-promoting mechanisms related to aging may be important.22
In this study, even patients with HIV who received ART, had high CD4 counts, or had suppressed HIV RNA had higher KS and NHL incidence than the general population. This could be due to lingering weaknesses in the immune system. For instance, although ART initiation corresponds with gradual increases in immune responses to human herpesvirus-8,23-25these responses might not be as robust as in individuals with no history of immunosup-pression. HIV could also have persistent direct effects on KS and NHL risk because the HIV latent reservoir is not eliminated with ART use. HIV viremia after ART initiation predicts NHL risk independently of CD4 count,26and recent studies provide evidence
that HIV proteins may directly encourage B-cell clonogenicity.27
Table 3.Standardized Incidence Ratios for Kaposi’s Sarcoma and Non-Hodgkin Lymphoma Among White and Black Patients With HIV in Routine Clinical Care
Time-Updated Patient Characteristics
Standardized Incidence Ratio (95% CI)
1996-2001 2002-2006 2007-2011
Kaposi’s sarcoma ART status
No ART 5,000 (3,100 to 7,600) 3,200 (2,000 to 4,700) 3,100 (1,900 to 4,700)
ART,6 months 9,200 (5,200 to 15,000) 12,000 (7,200 to 18,000) 6,200 (3,200 to 11,000)
ART$6 months 740 (370 to 1,300) 1,200 (900 to 1,500) 710 (530 to 930)
CD4 count (cells/mL)
,200 5,900 (4,000 to 8,600) 6,400 (4,900 to 8,200) 3,900 (2,700 to 5,400)
200-349 1,300 (450 to 3,000) 1,600 (970 to 2,500) 1,600 (980 to 2,400)
350-499 400 (21 to 1,900) 950 (470 to 1,700) 660 (330 to 1,200)
$500 550 (97 to 1,700) 310 (110 to 710) 430 (230 to 720)
HIV RNA (copies/mL)
.50,000 7,500 (4,400 to 12,000) 10,000 (8,100 to 14,000) 9,200 (6,200 to 13,000)
500-50,000 1,300 (490 to 2,600) 1,500 (820 to 2,400) 3,000 (1,900 to 4,400)
,500 1,500 (800 to 2,500) 700 (450 to 1,000) 430 (280 to 630)
Non-Hodgkin lymphoma ART status
No ART 6.7 (2.3 to 15) 11 (5.9 to 18) 8.8 (4.1 to 17)
ART,6 months 22 (8.5 to 45) 18 (6.1 to 41) 17 (5.8 to 39)
ART$6 months 12 (8.0 to 17) 7.0 (5.3 to 9.0) 3.4 (2.4 to 4.6)
CD4 count (cells/mL)
,200 39 (27 to 54) 24 (17 to 33) 10 (5.5 to 17)
200-349 5.5 (1.5 to 14) 4.3 (1.9 to 8.5) 6.8 (3.7 to 12)
350-499 2.3 (0.12 to 11) 8.1 (4.5 to 13) 3.4 (1.5 to 6.7)
$500 0 (0 to 4.3) 3.2 (1.5 to 6.1) 3.1 (1.7 to 5.1)
HIV RNA (copies/mL)
.50,000 35 (20 to 56) 27 (18 to 40) 19 (9.0 to 36)
500-50,000 6.5 (2.6 to 14) 12 (7.5 to 18) 10 (5.6 to 17)
,500 5.8 (3.3 to 9.7) 3.7 (2.3 to 5.6) 2.9 (1.9 to 4.3)
Changes in the clinical context of these cancers may have important implications for treatment and prognosis. For KS and NHL cases diagnosed in the setting of uncontrolled HIV, initiation of ART is a major component of cancer treatment.2For KS, ART alone can lead to significant regression, presumably due to im-proved immune function and control of human herpesvirus-8.2 However, as the current study shows, KS and NHL develop in many patients despite ART, and intensification or other ART changes may not be beneficial.28,29For NHL, how the immunologic and virologic context at diagnosis influences tumor biology and disease aggressiveness currently is unclear. A previous CNICS study found that patients with NHL diagnosed while receiving ART had worse survival than those with NHL diagnosed before ART initiation.20 However, for HIV-associated NHL, and specifically DLBCL, pa-tients with higher CD4 counts have been observed to have better responses and improved survival.30,31Further study could help to determine whether associations reflect differences in patterns of care or whether consistent predictors can be identified that cor-respond to underlying biologic differences.
This study has limitations. Limited information was available for cancers diagnosed outside routine clinical care; thus, the study focused mostly on cancers diagnosed during routine care. In addition, although the study population was large, we lacked enough cases to cross-classify them according to ART, HIV RNA measurement, and CD4 count. Furthermore, the CNICS sites are geographically diverse but are all based in large US academic medical centers, which may differ from other HIV care settings.32 This study also has important strengths. We assessed cancer diagnoses across a large multisite cohort that has systematically yielded important clinical characteristics, including ART use, CD4 counts, and HIV RNA measurements. Cancer diagnoses in CNICS were verified through a standardized and comprehensive process. Furthermore, because of the long follow-up in CNICS,
we could characterize cancer diagnoses over an extended span of calendar time.
In conclusion, KS and NHL presented a continued burden in the HIV population in the modern ART era, but presenting characteristics for these malignancies are changing. In the United States, more cases are diagnosed while patients are in routine care, receive ART, have a relatively intact immune system, and have suppressed HIV replication. These changes largely reflect the dramatic changes over time in treatment of the underlying HIV population. In the future, more studies are needed to understand whether KS and NHL cases that arise during ART use differ bi-ologically from cases that arise during severe immunosuppression and uncontrolled HIV replication. If biologic differences are demonstrated, they may suggest different approaches to effectively prevent and treat these cancers in the modern ART era.
AUTHORS’DISCLOSURES OF POTENTIAL CONFLICTS
OF INTEREST
Disclosures provided by the authors are available with this article at
www.jco.org.
AUTHOR CONTRIBUTIONS
Conception and design:Elizabeth L. Yanik, Chad J. Achenbach, Satish
Gopal, Stephen R. Cole, Eric A. Engels
Collection and assembly of data:Elizabeth L. Yanik, Chad J. Achenbach,
Joseph J. Eron, Richard D. Moore, W. Christopher Mathews
Data analysis and interpretation:All authors
Manuscript writing:All authors
Final approval of manuscript:All authors
Accountable for all aspects of the work:All authors
REFERENCES
1. Engels EA, Biggar RJ, Hall HI, et al: Cancer risk in people infected with human immunodeficiency virus in the United States. Int J Cancer 123:187-194, 2008
2. Uldrick TS, Whitby D: Update on KSHV epi-demiology, Kaposi sarcoma pathogenesis, and treatment of Kaposi sarcoma. Cancer Lett 305: 150-162, 2011
3. Hjalgrim H, Engels EA: Infectious aetiology of Hodgkin and non-Hodgkin lymphomas: A review of the epidemiological evidence. J Intern Med 264: 537-548, 2008
4. Shiels MS, Pfeiffer RM, Gail MH, et al: Cancer burden in the HIV-infected population in the United States. J Natl Cancer Inst 103:753-762, 2011
5. Engels EA, Pfeiffer RM, Goedert JJ, et al: Trends in cancer risk among people with AIDS in the United States 1980-2002. AIDS 20:1645-1654, 2006 6. Patel P, Hanson DL, Sullivan PS, et al: In-cidence of types of cancer among HIV-infected persons compared with the general population in the United States, 1992-2003. Ann Intern Med 148: 728-736, 2008
7. Silverberg MJ, Chao C, Leyden WA, et al: HIV infection, immunodeficiency, viral replication, and the
risk of cancer. Cancer Epidemiol Biomarkers Prev 20: 2551-2559, 2011
8. Shiels MS, Pfeiffer RM, Hall HI, et al: Pro-portions of Kaposi sarcoma, selected non-Hodgkin lymphomas, and cervical cancer in the United States occurring in persons with AIDS, 1980-2007. JAMA 305:1450-1459, 2011
9. Althoff KN, Buchacz K, Hall HI, et al: U.S. trends in antiretroviral therapy use, HIV RNA plasma viral loads, and CD4 T-lymphocyte cell counts among HIV-infected persons, 2000 to 2008. Ann Intern Med 157:325-335, 2012
10. Kitahata MM, Rodriguez B, Haubrich R, et al: Cohort profile: The Centers for AIDS Research Net-work of Integrated Clinical Systems. Int J Epidemiol 37:948-955, 2008
11. Achenbach CJ, Cole SR, Kitahata MM, et al: Mortality after cancer diagnosis in HIV-infected in-dividuals treated with antiretroviral therapy. AIDS 25: 691-700, 2011
12. M ¨uller M, Wandel S, Colebunders R, et al: Immune reconstitution inflammatory syndrome in patients starting antiretroviral therapy for HIV in-fection: A systematic review and meta-analysis. Lancet Infect Dis 10:251-261, 2010
13. Cleveland WS, Devlin SJ: Locally-weighted regression: An approach to regression analysis by localfitting. J Am Stat Assoc 83:596-610, 1988
14. National Cancer Institute: SEER-Medicare Linked Database, 2014.http://appliedresearch.cancer. gov/seermedicare
15. Rebeiro P, Althoff KN, Buchacz K, et al: Re-tention among North American HIV-infected persons in clinical care, 2000-2008. J Acquir Immune Defic Syndr 62:356-362, 2013
16. Shiels MS, Pfeiffer RM, Engels EA: Age at cancer diagnosis among persons with AIDS in the United States. Ann Intern Med 153:452-460, 2010
17. Dunn GP, Bruce AT, Ikeda H, et al: Cancer immunoediting: From immunosurveillance to tumor escape. Nat Immunol 3:991-998, 2002
18. Olp LN, Jeanniard A, Marimo C, et al: Whole-genome sequencing of Kaposi’s sarcoma-associated herpesvirus from Zambian Kaposi’s sarcoma biopsy specimens reveals unique viral diversity. J Virol 89: 12299-12308, 2015
19. Kingma DW, Weiss WB, Jaffe ES, et al: Epstein-Barr virus latent membrane protein-1 onco-gene deletions: Correlations with malignancy in Epstein-Barr virus-associated lymphoproliferative dis-orders and malignant lymphomas. Blood 88:242-251, 1996
21. Yanik EL, Katki HA, Engels EA: Cancer risk among the HIV-infected elderly in the United States. AIDS 30:1663-1668, 2016
22. Unemori P, Leslie KS, Hunt PW, et al: Immunosenescence is associated with presence of Kaposi’s sarcoma in antiretroviral treated HIV in-fection. AIDS 27:1735-1742, 2013
23. Sullivan SG, Hirsch HH, Franceschi S, et al: Kaposi sarcoma herpes virus antibody response and viremia following highly active antiretroviral therapy in the Swiss HIV Cohort study. AIDS 24:2245-2252, 2010
24. Bihl F, Mosam A, Henry LN, et al: Kaposi’s sarcoma-associated herpesvirus-specific immune re-constitution and antiviral effect of combined HAART/ chemotherapy in HIV clade C-infected individuals with Kaposi’s sarcoma. AIDS 21:1245-1252, 2007
25. Bourboulia D, Aldam D, Lagos D, et al: Short-and long-term effects of highly active antiretroviral therapy on Kaposi sarcoma-associated herpesvirus immune responses and viraemia. AIDS 18:485-493, 2004
26. Achenbach CJ, Buchanan AL, Cole SR, et al: HIV viremia and incidence of non-Hodgkin lymphoma in patients successfully treated with antiretroviral therapy. Clin Infect Dis 58:1599-1606, 2014
27. Dolcetti R, Gloghini A, Caruso A, et al: A lymphomagenic role for HIV beyond immune sup-pression? Blood 127:1403-1409, 2016
28. Friedland GH, Naidoo P, Abdool-Gafoor B, et al: Case records of the Massachusetts General Hospital. Case 29-2013. A 32-year-old HIV-positive African man with dyspnea and skin lesions. N Engl J Med 369:1152-1161, 2013
29. Maurer T, Ponte M, Leslie K: HIV-associated Kaposi’s sarcoma with a high CD4 count and a low viral load. N Engl J Med 357:1352-1353, 2007
30. Barta SK, Lee JY, Kaplan LD, et al: Pooled analysis of AIDS malignancy consortium trials eval-uating rituximab plus CHOP or infusional EPOCH chemotherapy in HIV-associated non-Hodgkin lym-phoma. Cancer 118:3977-3983, 2012
31. Dunleavy K, Little RF, Pittaluga S, et al: The role of tumor histogenesis, FDG-PET, and short-course EPOCH with dose-dense rituximab (SC-EPOCH-RR) in HIV-associated diffuse large B-cell lymphoma. Blood 115:3017-3024, 2010
32. Lesko CR, Cole SR, Hall HI, et al: The effect of antiretroviral therapy on all-cause mortality, general-ized to persons diagnosed with HIV in the USA, 2009-11. Int J Epidemiol 45:140-150, 2016
AUTHORS’DISCLOSURES OF POTENTIAL CONFLICTS OF INTEREST
Changes in Clinical Context for Kaposi’s Sarcoma and Non-Hodgkin Lymphoma Among People With HIV Infection in the United States
The following represents disclosure information provided by authors of this manuscript. All relationships are considered compensated. Relationships are self-held unless noted. I = Immediate Family Member, Inst = My Institution. Relationships may not relate to the subject matter of this manuscript. For more information about ASCO’s conflict of interest policy, please refer towww.asco.org/rwcorjco.ascopubs.org/site/ifc.
Elizabeth L. Yanik
No relationship to disclose
Chad J. Achenbach
Consulting or Advisory Role:ABIVAX
Research Funding:Gilead Sciences
Satish Gopal
No relationship to disclose
Anna E. Coghill
No relationship to disclose
Stephen R. Cole
No relationship to disclose
Joseph J. Eron
Consulting or Advisory Role:Merck, Bristol-Myers Squibb, Gilead
Sciences, Janssen, AbbVie, ViiV Healthcare
Research Funding:Bristol-Myers Squibb, Gilead Sciences, AbbVie,
ViiV Healthcare
Richard D. Moore
No relationship to disclose
W. Christopher Mathews
No relationship to disclose
Daniel R. Drozd
No relationship to disclose
Ayad Hamdan
Speakers’Bureau:Mallinckrodt
Mary E. Ballestas
No relationship to disclose
Eric A. Engels
Acknowledgment
We thank the patients, principal investigators, co-investigators, and research staff at participating Centers for AIDS Research Network of Integrated Clinical Systems sites at the following institutions: Case Western Reserve University; University of Alabama at Birmingham; University of California, San Francisco; University of Washington; University of California, San Diego; Fenway Community Health Center of Harvard University; University of North Carolina at Chapel Hill; and Johns Hopkins University. In particular, we acknowledge Benigno Rodriguez at Case Western Reserve University and Elvin Geng at the University of California, San Francisco, for assistance.
Appendix
Log HIV RNA (log
10
copies/mL)
0 2 4 6
2000 2004 2008 2012
HIV RNA at DLBCL Diagnosis
Year of DLBCL Diagnosis
Fit 95% Confidence Limits
C
0 20 40 60 80 100
1996–2001 2002–2006 2007–2011
Calendar Period of DLBCL Diagnosis ART Start Before DLBCL Diagnosis
ART Start ≥ 6 Months Before Diagnosis
No ART
A
1996
CD4 Count (cells/
μ
L
)
Percent
0 200 400 600 800 1,000
2000
Year of DLBCL Diagnosis 2004
Fit 95% Confidence Limits
2008 2012
CD4 Count at DLBCL Diagnosis
B
ART Start < 6 Months Before Diagnosis
Fig A1. Antiretroviral therapy (ART), immune, and virologic status of patients with HIV in routine clinical care who were diagnosed with diffuse large B-cell lymphoma (DLBCL). (A) The proportion of DLBCL patient cases that occurred at various times relative to ART initiation over three calendar periods. (B) The distribution of CD4 counts at diagnosis of DLBCL across time, including a LOWESS curve to illustrate the smoothed trend over time. (C) The distribution of HIV RNA values on the log10scale at diagnosis of DLBCL across time, including a LOWESS