GOING WITH THE FLOW: LEFT WITHOUT BEING SEEN IN THE EMERGENCY DEPARTMENT
Sherry Lynette Leviner
A dissertation submitted to the faculty at the University of North Carolina at Chapel Hill in partial fulfillment of the requirements for the degree of Doctor of Philosophy in the School of Nursing.
Chapel Hill 2015
Approved by: Debbie Travers
Josephine Asafu-Adjei Sarah Birken
© 2015
ABSTRACT
Sherry Lynette Leviner: Going With the Flow: Left without Being Seen in the Emergency Department
(Under the direction of Debbie Travers)
Background: Emergency Department (ED) crowding negatively impacts patient care.
Delays in receiving care increases the probability that some patients will leave without being seen (LWBS) by a medical provider. The scope and significance of LWBS has prompted the Centers for Medicare and Medicaid to monitor LWBS and to reimburse hospitals based on LWBS rates. However, there is no plan to consider patient case mix or organizational characteristics in the LWBS reimbursement program. The new reimbursement policy may unfairly burden organizations providing care to vulnerable populations.
Objectives: The objectives of this study were to: verify the association between patient
characteristics and LWBS found in previous studies; determine if there is an association between organizational characteristics and LWBS and explore how organizational characteristics may moderate the relationship between patient characteristics and LWBS. Methods: A secondary analysis of national ED data from 2007-2010 was performed.
Results: This study verified the association between patient characteristics and LWBS found
in previous studies. The following were associated with higher LWBS rates in: younger patients, lower acuity (acuity 4 and 5), arriving after 11 a.m., and Black Non-Hispanic Race/ethnicity. This study also found an association between organizational characteristics and LWBS. There was variation in LWBS across hospitals, with higher LWBS rates in metropolitan and Southern EDs. Organizational characteristics were found to moderate the relationship between patient characteristics and LWBS, with significant cross-level
interactions for the following: Metropolitan Statistical Area (MSA) and arrival, ownership and race/ethnicity, and region and race/ethnicity.
Conclusions: The results of this study have several implications. Regarding policy, to avoid
ACKNOWLEDGEMENTS
TABLE OF CONTENTS
LIST OF TABLES ... xi
LIST OF FIGURES ... xii
LIST OF ABBREVIATIONS ... xiii
Chapter I. INTRODUCTION ...1
Description of the Problem ...1
Research Study Addresses Problem...5
II. LITERATURE REVIEW AND CONCEPTUAL FRAMEWORK ...7
Introduction ...7
Theoretical Framework and Conceptual Model ...8
Literature Review...10
Consequences of Poor Patient Flow ...12
Interventions Aimed at Improving Flow...14
National Regulations, Policies Regarding Flow ...16
Summary ...16
III. SPECIFIC AIMS ...17
Introduction ...17
Significance...17
Aim 1: What is the Relationship between Selected Patient
Characteristics and LWBS? ...21
Aim 2: What is the Relationship between Organizational Characteristics and LWBS? ...25
Aim 3: Do Organizational Characteristics Moderate the Relationship between Patient Characteristics and LWBS? ...27
Purpose Statement ...29
IV. METHODS ...30
Introduction ...30
Design ...30
Data Set ...31
Sample...33
Sample Size ...35
Measures ...36
Data Analysis ...36
Model Building ...39
Aim 2: What is the Relationship between High Volume Organizational Characteristics and LWBS? ...40
Aim 1: What is the Relationship between Selected Patient Characteristics and LWBS? ...41
Aim 3: Do Organizational Characteristics Moderate the Relationship between Patient Characteristics and LWBS? ...41
Limitations ...42
Summary ...44
V. RESULTS ...45
Study Sample ...45
Descriptive Statistics ...46
Bivariate Analyses ...47
Multivariate Analyses ...48
Summary ...55
VI. DISCUSSION ...57
Introduction ...57
Specific Aims and Hypotheses ...57
Main Findings ...58
Implications of the Findings ...65
Theoretical Implications ...65
Policy Implications ...66
Practice Implications ...67
Limitations ...69
Future Research ...71
Conclusions ...72
APPENDICES ...73
LIST OF TABLES
Table
1 Patient Characteristics and LWBS ...22
2 Organizational Characteristics and LWBS ...26
3 Potential Interactions ...74
4 Independent Variables ...76
5 Planned Analyses ...38
6 Study Sample Characteristics ...46
7 Descriptive Statistics ...82
8 Weighted Bivariate Analyses: Frequencies ...48
9 Weighted Bivariate Analyses Simple Logistic Regression ...85
10 Results Null Model ...49
11 Results Random Intercept, Fixed Effects Level-2 ...50
12 Results Random Intercept, Fixed Effects Level-1 ...52
13 Results Random Coefficients ...53
14 Results Cross-Level Interactions ...53
15 Comparison: Hypothesized versus Actual Findings ...54
16 Summary: Main Study Findings ...55
17 Simple Effects Comparisons MSA and arrival ...86
18 Simple Effects Comparisons Ownership and Race/ethnicity ...86
LIST OF FIGURES
Figure
1 Ideal Care ... 7
2 Conceptual Model of LWBS ... 9
3 Final Conceptual Model of LWBS ...20
LIST OF ABBREVIATIONS
ABC Achievable Benchmarks of Care
ACA Affordable Care Act
ANOVA Analysis of Variance
CMS Centers for Medicare and Medicaid Services DSH Disproportionate Share Hospital Programs
ED Emergency Department
EMTALA Emergency Medical Treatment and Active Labor Act HOQRP Hospital Outpatient Quality Reporting Program
ICU Intensive Care Unit
LOS Length of Stay
LWBS Left Without Being Seen MSA Metropolitan Statistical Area
MPML Multilevel Pseudo Maximum Likelihood
MLM Multilevel Modeling
NHAMCS-ED National Hospital Ambulatory Medical Care Survey—Emergency Department
CHAPTER 1
INTRODUCTION
Description of Problem
Emergency department (ED) crowding has brought the topic of patient flow into the national spotlight. ED crowding is a national problem negatively impacting the provision of safe, effective, patient-centered, timely, efficient, and equitable care (Clark & Normile, 2007; Institute of Medicine, 2006; Pines et al., 2009; Schull, Vermeulen, Slaughter, Morrison, & Daly, 2004) because of delays in care. Longer waiting time is the result of increased ED volume and decreased system capacity. When people wait longer in crowded EDs they are more likely to leave before they are treated (Baibergenova, 2006; Bindman, Grumbach, Keane, Ruach, & Luce, 1991; Batt & Terwiesh, 2012; Goldman, Macpherson, Schuh,
Mulligan, & Pirie, 2005; Hobbs, Kunzman, Tandberg, & Sklar, 2000; Liao et al., 2001; Stock et al., 1994).
some organizations to congestion, leading to delays that increase the risk of LWBS. Patient characteristics such as age, gender, triage acuity (a score indicating how quickly a patient needs to be treated), race, ethnicity, and arrival time have been associated with higher LWBS rates (Arendt, Sadosty, Weaver, Brent, & Boie, 2003; Baker, Stevens, & Brook, 1991;
Baibergenova, 2006; Bourgeois, Shannon, & Stack, 2008; Ding et al., 2006; Dos Santos, Stewart, & Rosenberg, 1994; Gilligan et al., 2009; Goldman et al., 2005; Goodacre & Webster, 2005; Hsia, Asch, et al., 2011; Johnson, Myers, Wineholt, Pollack, & Jusmiesz., 2009; Kronfol, Childers, & Caviness, 2006; Pham et al., 2009; Sun, Bindstadt, Pelletier, & Camargo, 2007).
Patients are categorized as LWBS when they leave the ED prior to examination by a medical provider. From 1998 to 2006, 1.8 million patients left EDs in the United States (U.S.) which is 1.7 per 100 ED visits (Pham et al., 2009). The scope and significance of LWBS has prompted regulatory agencies to address it. The Centers for Medicare and
Medicaid Services (CMS) have included LWBS in the Hospital Outpatient Quality Reporting Program (Medicare & Medicaid Programs, 2011). LWBS rates are reported on the hospital care website (Centers for Medicare and Medicaid, 2014a) as a measure of ED throughput and in 2014 CMS began a program to reimburse hospitals based on LWBS rates.
The LWBS measure is calculated as the percentage of patients who leave prior to being evaluated by a physician, Advanced Practice Nurse or Physician Assistant (the number of patients who LWBS is the numerator and the denominator is the total number of patients presenting to ED for care (Centers for Medicare and Medicaid, 2014b). Using the
The ABC methodology is promoted as an objective benchmarking tool (Kiefe et al., 1998). This tool is used to identify the top performers on a measure. Through use of this tool all organizations are compared based on LWBS. It does not stratify comparisons based on organizational characteristics or patient mix. While CMS has begun to reimburse top
performing organizations based on lower LWBS rates (e.g., hospitals with the lowest LWBS rates in their EDs), it does not consider characteristics of organizations or their patient mix. Failure to stratify LWBS based on these unmodifiable characteristics may unfairly burden organizations serving a higher proportion of vulnerable populations such as low-income and poorly insured patients (Hsia, Asch, et al., 2011).
The current research is focused heavily on patient-level determinants of LWBS such as age, triage acuity, race, ethnicity, arrival time, and perceived length of wait time in single-site studies (Arendt et al., 2003; Ding et al., 2006; Dos Santos et al., 1994; Johnson et al., 2009; Kronfol et al., 2006; Sun et al., 2007). However, patient characteristics alone do not fully explain why patients LWBS. For example, patients frequently report that they leave because they were tired of waiting due to prolonged waiting for treatment (Baker et al., 1991; Bindman et al., 1991; Stock et al., 1994). Which leads to the question, why are patients waiting for long periods of time in the ED? In order to understand why patients are waiting, we need to examine the context where care is provided in addition to patient characteristics. The context where care is provided has an influence on a patient’s decision to LWBS because of the delays that result from organizational efficiency. “An organization’s
Workflows may be intentionally designed or arise and evolve based on the needs of the organization (Cain & Haque, 2008). Due to design, some organizations may have more efficient workflows leading to fewer delays in care and as a result, fewer patients LWBS.
The needs of the organization are determined by organization-level variables such as the level of public accountability (ownership; Daft, 2010), and environmental demands (Daft, 2010) that the organization must manage that are represented by Metropolitan Statistical Area (MSA) status and region (Scott & Davis, 2007). Research examining the effect
organizational variables have on LWBS has been limited to single-site or (Hobbs et al., 2000; Polevoi, Quinn, & Kramer, 2004; Stock et al., 1994) single state studies (Hsia, Asch, et al., 2011). These studies have limited generalizability to the vast majority of hospitals in the United States (Governmental Accountability Office, 2009) that will be affected by CMS’s LWBS rate-based policy.
Although various patient and organizational characteristics have been associated with LWBS, they do not fully explain LWBS in EDs. For example, why are some patients with similar chief complaints (e.g., ankle injury) more likely to LWBS from inner city EDs than other patients? A system is “a set of connected or interdependent things” (Zimmerman, Lindberg, & Plsek, 2008, p. 8) but hospitals are more than just a connection or
the system (Zimmerman et al., 2008). The interactions among the component parts make the system nonlinear; the interaction among the parts changes behavior depending on the context of the interaction (Wheatley, 2006). This interaction makes the whole greater than the sum of the parts (Perez & Liberman, 2011). In other words, you cannot predict outcomes by studying parts of the system in isolation. When a system is reduced to component parts, information is lost (Perez & Liberman, 2011) because we are unable to understand how those parts interact.
Previous studies have not addressed the interaction between patient (an individual level variable or Level-1) and organizational (higher level or Level-2) variables and the effect this interaction may have on LWBS. Interactions between different levels are known as cross-level interactions. These cross-level interactions can be moderating effects and involve independent variables from level-1 and level-2 (Hox, 2010). The presence of a cross-level interaction indicates that the relationship between an independent variable and the outcome variable is dependent on a third variable (Heck & Thomas, 2009). The relationship between a predictor in a cross-level interaction and an outcome variable should not be interpreted without considering the interaction effect to provide a more accurate explanation of the results (Hox, 2010).
Research Study Addresses Problem
CHAPTER 2
LITERATURE REVIEW AND CONCEPTUAL FRAMEWORK
Introduction
Patient flow is the management and coordination of treatment in a hospital (Fieldston, n.d.); it implies progressive movement (National Health Service, 2011). Patient flow is one component of providing ideal care; it can lead to improvements in safety and reliability. Safe care is provided when patients are not harmed by healthcare manner (Nolan, Resar, Haraden, & Griffin, 2004). Harm can occur because of errors during the intervention or delays in performing the intervention. Reliability is “failure-free operation over time” (Nolan et al., 2004, p. 3). Healthcare is reliable when evidence-based care is provided and interventions are provided in a timely manner (Nolan et al., 2004). Ideal care occurs when the patient receives safe, reliable care, in a timely manner see Figure 1 (National Health Service, 2011). Optimal patient flow minimizes waiting (Hall, 2006). However, patient flow should never be
Poor patient flow impacts the quality of care (Ding, Jung, Kirsch, Levy, & McCarthy, 2007; Sikka, Mehta, Kauchy, & Kulstad, 2010). When patient flow is not optimal, patients experience delays in treatment (Hall, 2006) and increased risk of LWBS. ED crowding occurs when 100% of ED beds are filled and the number of patients waiting is greater than 50% of the ED beds (Kolb, Peck, Schoening, & Lee, 2008). The inability to move admitted patients out of the ED to an inpatient unit is the most common contributor to ED crowding (Pines et al., 2011). Admitted patients who remain in the ED because inpatient beds are not available impact the flow for all patients in the ED. The availability of inpatient beds is influenced by patient characteristics and organizational characteristics (Institute for Healthcare Improvement, 2014).
Theoretical Framework and Conceptual Model
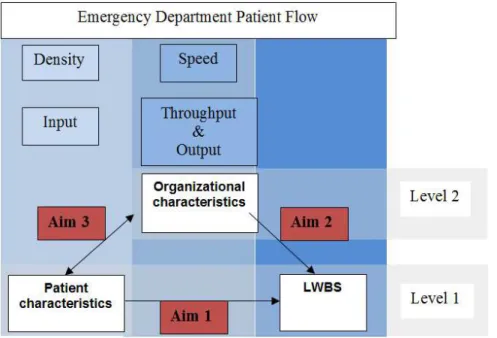
The theoretical framework for the study is identified from a review of the Emergency Medicine literature on ED crowding. The Input/Throughput/Output Model of patient flow (Asplin et al., 2003), along with concepts from Traffic Flow Theory (TFT), provides a framework for understanding patient flow. The conceptual model of LWBS in Figure 2 provides a framework for ED patient flow and depicts the relationships between key variables related to LWBS.
Figure 2. Conceptual Model of LWBS.
Congestion, excessive crowding, occurs when density and speed are not optimal. Congestion or poor flow occurs when density becomes so high that it limits speed (e.g., cars in rush hour traffic) or when speeds are slow, a slow moving car on a two-lane road that other cars cannot pass. Understanding why congestion exists is a key factor in improving flow. The most obvious method for improving flow, when congestion exists, is to increase capacity. However, increasing capacity is not always feasible due to limited financial resources.
of treatment (speed). These components are not mutually exclusive—density influences speed and speed, in turn, is influenced by density. Density is determined by the input
component of patient flow and speed is determined by the throughput and output components of patient flow.
Literature Review
The input component reflects the demand for ED services (Asplin et al., 2003). While the ED was originally established to treat and stabilize emergency medical conditions, this role has been expanded under the Emergency Medical Treatment and Active Labor Act (EMTALA). The ED is considered a safety net provider because EMTALA requires the ED to perform a medical screening exam on everyone who presents for treatment regardless of the ability to pay. EDs (county-owned and teaching hospitals) serving communities with a higher proportion of vulnerable populations (poorly insured and low income; Hsia, Asch, et al., 2011) will experience increased input (density of patients). As the density increases, the number who LWBS also increases due to increased wait times (Hing & Bhuiya, 2012).
The throughput component consists of treatment that is provided during the ED stay. Although this component is often thought to reflect organizational efficiency within the ED (Asplin et al., 2003), it is also affected by the input and output components. Throughput or length of stay (LOS) (speed of treatment) is dependent on patient and disease characteristics and organizational level factors (Asaro, Lewis, & Boxerman, 2007). Increased input
(density) has been significantly associated with longer LOS in the ED (Hing & Bhuiya, 2012; Timm, Ho, & Luria, 2008). ED length of stay (LOS) increases as hospital occupancy
Khanna, Boyle, Good, and Lind (2012) identified three critical occupancy levels, or choke points, where patient flow declines: 91%, 96% and 99% occupancy. These three choke points vary depending on the size of the hospital; smaller hospitals (0-300 beds) were able to operate more efficiently at higher occupancy levels than larger hospitals (301-900 beds and 901 or more beds; Khanna et al., 2012). However, relationship between demand and wait times is nonlinear and is impacted by average service time (Hall, 2006). So systems with faster average service time are expected to experience decreased average delays. For-profit hospitals, which typically see more insured individuals, have increased economic incentive to reduce average delays (Hall, 2006). Therefore, for-profit hospitals are expected to have fewer LWBS compared to hospitals that are owned by the county and government, and teaching facilities.
patients in the ED impacts the ability of the ED to care for new patients; as the density, the number of patients increase, flow and speed decrease.
Consequences of Poor Patient Flow
Poor patient flow is associated with prolonged waiting times and increased risk of LWBS (Bindman et al., 1991; Goldman et al., 2005; Ibanez, Guerin, & Simon, 2011; Stock et al., 1994). The amount of time people wait to be seen in the ED is the most commonly cited reason why people LWBS (Ding et al., 2006; Johnson et al., 2009; Kronfol et al., 2006). Patient satisfaction is closely related to waiting; as wait time increases patient satisfaction decreases (Pines, 2006).
Adverse outcomes. Patients receive quality care when they receive “standard clinical
treatment” (Nugus & Braithwaite, 2009, p.511). When patients LWBS from the ED, they do not receive standard clinical treatment. This has the potential to lead to adverse outcomes. Patients who LWBS from the ED are twice as likely to report worsening symptoms
compared to those who do not LWBS (Bindman et al., 1991). Patients who LWBS and return are more likely to require hospitalization (2.6%) compared to those who are admitted and return (0.6%) (Ding et al., 2007). In one study, 2.5% of patient who LWBS and returned were hospitalized for complications (deep vein thrombosis, drug allergy, chest pain
surveillance) following the LWBS visit (Ibanez et al., 2011).
studies (Fernandes, Daya, Barry, & Palmer, 1994; Johnson et al., 2009; Mohsin et al., 2007; Rowe et al., 2006).
Delayed care. During the period 1998-2006, the national LWBS rate was 1.7 per 100
ED visits (Pham et al., 2009). There was a total of 119.2 million ED visits in 2006 (Pitts, Niska, Xu, & Burt, 2008). In relation to the total ED visits, the LWBS rate is low, however these patients who LWBS are often disadvantaged and lack access to alternative care. Patients who LWBS are more likely to be: younger (Ding et al., 2006; Pham et al., 2009; Sun et al., 2007), minority (Pham et al., 2009; Sun et al., 2007), urban dwellers (Bourgeois et al., 2008; Sun et al., 2007), uninsured or underinsured (Ding et al., 2006; Pham et al., 2009; Sun et al., 2007), and lower triage acuity (Pham et al., 2009) compared to patients who do not LWBS. Therefore, LWBS leads to disparities in care because disadvantaged
populations (minorities and uninsured/underinsured individuals) lack other alternatives to care.
Other researchers have also found a relationship between crowding and timeliness of care. Sikka et al. (2010) found an association between ED occupancy rate and increased time to administer antibiotics to patients with pneumonia (Spearman ρ = 0.17, P = .008); increased occupancy rate was associated with decreased odds of receiving antibiotics within 4 hours (odds ratio [OR] =.31; 95% confidence interval [CI]: (0.13, 0.75).
Interventions Aimed at Improving Flow
Most interventions have targeted processes within the ED; few have targeted flow within the larger hospital system. Most of the interventions have made only a small impact in ED crowding overall because the interventions have lacked a system-wide focus.
Patient segmentation/streaming. Patient segmentation involves separating patients
based on triage acuity. The most widely implemented form of patient segmentation is fast track. Patients with lower triage acuity are seen in a separate area. Considine, Kropman, Kelly, and Winter (2008) performed a case-control study after fast track implementation. They found that overall length of stay decreased from 132 minutes to 116 minutes (p < .01). They also found that LOS decreased for lower acuity patients (p < .01). Coombs, Chapman, and Bushby (2006) found that the number of patients who LWBS decreased from 10% to 5.4% after implementing fast track. Leraci, Sonntag, Dann, and Fox (2008) also found reductions in the number of LWBS (from 6.2% to 3.1%) and additionally they found decreased wait times (from 55 minutes to 32 minutes) and treatment times (209 minutes to 191 minutes) after fast track was implemented.
Triage. Many interventions have been directed at improving the triage process.
(Chan, Killeen, Kelly, & Guss, 2005; Holroyd et al., 2007). Many studies have found that the number of LWBS decreased (Han et al., 2008; Holroyd et al., 2007). However, most of the interventions have not continued long term due to the lack of available physicians (Choi, Wong, & Lau, 2006).
The expense of placing physician in triage was not addressed by these studies. Russ, Jones, Aronsky, Dittus, and Slovis (2010) found that waiting room time and overall LOS increased but the amount of time patients spent in an ED bed decreased. Subash, Dunn, McNicholl, and Marlow (2003) found that a physician in triage significantly decreased time to triage (from 7 minutes to 2 minutes; p = .029) and time to doctor (from 32 minutes to 2 minutes; p = .029); however time to analgesia (from 37.5 minutes to 13 minutes; p = .4) and time to discharge (from 82 minutes to 37 minutes; p = .057) were not significantly impacted.
Holding unit. Holding units enable admitted patients to move out of the ED and open
up a treatment space for new patients. Gomez-Vaquero et al. (2009) examined the effect of a holding unit on the number of boarders in the ED, number of elective admissions, number of cancelled elective admissions, and ED LOS. The creation of a holding unit decreased the number of boarders by 55.6% (mean difference = -5.1; 95% CI: (-5.9, -4.3). The ED LOS increased 6.9% (p < .001) and the ED census increased 3.1% during the study period. There was no change in the number of elective admissions or the number of cancelled elective admissions.
Vertical patient flow. The idea behind vertical patient flow is to maintain open ED
This front-end initiative has the potential to increase throughput for lower acuity patients and decrease the number of LWBS.
National Regulations, Policies Regarding LWBS
LWBS has received the attention of regulatory agencies. The Joint Commission established standard LD.04.03.11 to address patient flow in hospitals (Joint Commission, 2004). The Centers for Medicare and Medicaid Services (CMS) have included LWBS as part of the Hospital Outpatient Quality Reporting Program (HOQRP) (Medicare & Medicaid Programs, 2011) and as of 2014 hospitals are now reimbursed based on LWBS rates.
The new CMS policy holds all organizations accountable to one standard LWBS rate. The policy will not consider patient or organizational factors, factors that influence LWBS rates. This new policy may adversely impact organizations providing a greater amount of care to populations who are more likely to LWBS. This includes low-income and poorly insured patients, as well as Medicaid and uninsured patients which are an indication of safety-net burden (Burt & Arispe, 2004). These hospitals would likely receive lower
reimbursement under the proposed plan and, therefore widen the gap of disparities in care. Summary
CHAPTER 3
SPECIFIC AIMS
Introduction
This chapter includes a discussion of the study’s significance and the final conceptual model, which provides a framework for ED patient flow and depicts the relationships
between key variables related to LWBS. The specific aims addressed in the study are also presented and discussed in this chapter. The specific aims are:
Aim 1: What is the relationship between selected patient characteristics and LWBS?
Aim 2: What is the relationship between organizational characteristics and LWBS?
Aim 3: Do organizational characteristics moderate the relationship between patient
characteristics and LWBS?
Significance
This study built on knowledge generated from previous studies about LWBS. Patient characteristics have been the focus of LWBS; however, the setting where care is delivered may be just as important as the characteristics of those who seek out care. Our current understanding of the relationships between patient and organizational characteristics and LWBS is limited because the researchers who have examined organizational characteristics (Hsia, Asch, et al., 2011; Pham et al., 2009) have not examined potential cross-level
and organizational characteristics; both of which the organization cannot control. The proposed research study is innovative because it represents a new approach to understanding LWBS. The proposed study will provide insight into the relationships between patient and organizational characteristics and LWBS using a national data source.
The study was significant because it examined the effect of cross-level interactions between patient and organizational characteristics on LWBS. This study has the potential to lead to new approaches in the management of LWBS, and it has significant policy relevance. The new CMS program to reimburse organizations based on LWBS rates (Medicare & Medicaid Programs, 2011) without considering patient mix and organizational characteristics has the potential to negatively impact organizations that provide safety net care. This could widen disparities in care since vulnerable populations often depend on the ED as a source of care.
safety net populations; this will be especially problematic in states that do not expand Medicaid eligibility and in areas with undocumented immigrants. The majority of the states not expanding Medicaid eligibility are located in the south (Heberlein, Brooks, Artiga, & Stephens, 2013).
As the demand for health services increases under the ACA, the ability to meet that demand will be affected by the automatic spending cuts that are occurring under the Budget Control Act of 2011. Medicare spending will decrease by 2% per year. Hospitals will need to decide how they will manage the decreased reimbursement. For some, this may mean doing more with less staff.
The findings of the proposed study can inform policy by examining the relationships between patient, organizational characteristics and LWBS. This study is timely because as the volume of ED visits is projected to increase, reimbursement for safety net care will be cut, and CMS is starting to reimburse hospitals based on LWBS rates.
Specific Aims
patient-level determinants of LWBS (Arendt et al., 2003; Ding et al., 2006; Dos Santos et al., 1994; Johnson et al., 2009; Kronfol et al., 2006; Sun et al., 2007). The majority of studies on LWBS have limited generalizability to hospitals nationally because they have been single-site studies (Ding et al., 2006; Hobbs et al., 2000; Johnson et al., 2009; Kronfol et al., 2006; Polevoi et al., 2004) or single-state studies (Hsia, Asch, et al., 2011).
Figure 3. Final Conceptual Model of LWBS.
Aggregation of patient-level predictors (Hsia, Asch, et al., 2011) has prevented some researchers from making inferences about the patient-level or cross-level interactions
The objectives of this multilevel study were to use a nationally representative dataset to: (a) verify the association between patient characteristics and LWBS found in previous studies with smaller samples, (b) determine if there is an association between high volume organizational characteristics and LWBS, and (c) determine if organizational characteristics moderate the relationship between patient characteristics and LWBS.
Aim 1: What is the Relationship between Selected Patient Characteristics and LWBS?
Patient characteristics reflect the input/density component in the conceptual model of LWBS (Figure 3). Previous research has found that patient characteristics influence LWBS (Arendt et al., 2003; Ding et al., 2006; Dos Santos et al., 1994; Johnson et al., 2009; Kronfol et al., 2006; Sun et al., 2007). However, these studies involve single hospitals. In the proposed study, the relationship between patient characteristics and LWBS will be verified using a nationally-representative data set. A summary of patient characteristics associated with LWBS that were examined in this study is provided in Table 1, which also includes a list of the previous studies on each variable.
Age. Patient age has been associated with LWBS. Older patients are less likely to
patients age 75 and older were the most frequent users of EDs (Garcia, Bernstein, & Bush, 2010).
Table 1
Patient Characteristics and Relationship with Left without Being Seen
Variables Relationship with LWBS Source of Evidence
Age Older patients less likely to LWBS
Younger patients (18-24 years) more likely to LWBS.
Baibergenova (2006) Ding et al. (2006) Johnson et al. (2009) Pham et al. (2009) Pines et al. (2012) Sun et al. (2007) Triage
Acuity
Lower triage acuity is associated with longer LOS. Lower triage acuity is associated with higher LWBS.
Baibergenova (2006) Bourgeois et al. (2008)
Gilboy, Tanabe, Travers, Rosenau, and Eitel (2011)
Gilligan et al. (2009) Goldman et al. (2005) Goodacre and Webster (2005) Liao et al. (2001)
Mohsin et al. (2007) Pham et al. (2009) Sun et al. (2007) Gender Males are more likely to LWBS.
Females have higher percentage of LWBS No significant difference in LWBS based on Gender
Baker et al. (1991) Bourgeois et al. (2008) Goodacre and Webster (2005) Johnson et al. (2009)
Mohsin et al. (2007) Pham et al. (2009) Sun et al. (2007) Race Black patients had higher risk of LWBS compared
to White patients.
Bourgeois et al. (2008) Ding et al. (2006) Hsia, Asch, et al. (2011) Pham et al. (2009) Shen and Hsia (2010). Ethnicity Hispanics have higher percentage of LWBS Pham et al. (2009) Arrival
Time
7p-11p greatest number of LWBS. 4p-11p greatest number of LWBS. Nights have higher LWBS
Bourgeois et al. (2008) Kronfol et al. (2006) Gilligan et al. (2009)
Goodacre and Webster (2005) Liao et al. (2001)
Day of week Sunday, Saturday, Monday highest LWBS Gilligan et al. (2009) Mohsin et al. (2007)
possible explanation for increased LWBS rates among younger patients is that these patients have family responsibilities and leave in order to meet these responsibilities.
Triage acuity. Triage acuity reflects patient illness level and predicted resource use
(Gilboy et al., 2011). Multiple researchers have found an association between LWBS and triage acuity; lower triage acuity (i.e., less urgent problem) is associated with higher LWBS rates (Baibergenova, 2006; Bourgeois et al., 2008; Gilligan et al., 2009; Goodacre &
Webster, 2005; Goldman et al., 2005; Liao et al., 2001; Mohsin et al., 2007; Pham et al., 2009; Sun et al., 2007). In the ED, patients are seen and treated based on triage acuity rather than time of arrival. The purpose of triage is to sort patients into categories and determine those patients who are unable to wait for care (Gilboy et al., 2011). This means that patients with lower triage acuity are deemed stable enough to wait for care. These patients with lower triage acuity leave because they are tired of waiting (Baker et al., 1991; Bindman et al., 1991; Stock et al., 1994) and due to the lower acuity they have the ability to leave. EDs that treat a greater percentage of high acuity patients have decreased throughput and increased LWBS because these patient require more diagnostic testing. Gardner, Sarkar, Maselli, and Gonzales (2006) found that LOS was longer for patients who received diagnostic testing.
Gender. Researchers have not found a consistent relationship between gender and
LWBS, possibly due to methodological differences in study design. Among those
willing to LWBS. Women are more likely to be caregivers and may leave to continue their duties.
Race and ethnicity. Race and ethnicity have also been associated with increased risk
of LWBS (Bourgeois et al., 2008; Ding et al., 2006; Hsia, Asch, et al., 2011, Pham et al., 2009; Shen & Hsia, 2010). Vulnerable populations may be more dependent on the ED for care (Shen & Hsia, 2010); non-Hispanic blacks had the highest ED utilization of any group in 2007 (Garcia et al., 2010). Compared to white patients, black patients had a higher risk of LWBS (Bourgeois et al., 2008; Ding et al., 2006; Hsia, Asch, et al., 2011; Pham et al., 2009; Shen & Hsia, 2010). Perhaps the increased risk of LWBS is due to perceived racism within the healthcare system; African Americans have stronger beliefs about racial discrimination than other racial groups (Chen, Fryer, Phillips, Wilson, & Pathman, 2005). Anecdotally, ethnic and racial minorities may think they are required to wait because of their racial or ethnic background.
Race and ethnicity also affect throughput. LOS is longer for Hispanics (Gardner et al., 2006); leading to decreased throughput and increased LWBS for other patients. The increased LOS for Hispanics may be related to language barriers and the need to use interpreter services.
Arrival Time. Patients who arrive after 4 p.m. have increased risk of LWBS
time due to shift change between 6 p.m. and 7 p.m., a time when the off-going shift is attempting to wrap up their work and the on-coming shift is getting oriented with their patient assignment. Typically, most hospitals operate inpatient units with reduced staff during night shifts. This may mean that the ED holds admitted patients longer and, therefore, the flow for new patients decreases.
Day of week. Rates of LWBS are higher on weekends and Mondays (Gilligan et al.,
2009; Mohsin et al., 2007). During the weekend, there is decreased availability of primary care. Therefore, patients have no option but the ED and this leads to increased input and higher density of patients on weekends. There may also be higher substance use on weekends which may predispose patients to LWBS (Mohsin et al., 2007). Most hospitals also operate inpatient units with decreased staffing during the weekends so admitted patients may spend more time being boarded in the ED.
Aim 2: What is the Relationship between Organizational Characteristics and LWBS?
Table 2
Organizational Characteristics and Relationship with Left without Being Seen
Variables Relationship with LWBS Source of Evidence
Metropolitan Statistical Area Urban- higher LWBS
Sun et al. (2007) Bourgeois et al. (2008) Pham et al. (2009)
Hospital ownership
County-owned has higher LWBS
Non-profit has higher LWBS
For-profit hospitals have lower LWBS
No differences in LWBS based on hospital ownership
Hsia, Asch, et al. (2011) Stock et al. (1994)
Bourgeois et al. (2008)
Handel et al. (2013)
Pham et al. (2009)
Region South has highest percentage
of LWBS
Bourgeois et al. (2008) Sun et al. (2007)
Metropolitan statistical area (MSA). A greater percentage of urban hospitals, 79%,
are over capacity compared to rural hospitals, 45%. (Lewin Group, 2002). Hospitals located in urban areas are more likely to be referral centers due to the increased number of specialty services they offer and therefore, have increased density. Hospitals in urban areas have slower throughput (Gardner et al., 2006); this may be related to the additional services available in urban areas. EDs located in socioeconomically disadvantaged areas have higher numbers of patients who LWBS (Hsia, Kellermann, & Shen, 2011; Hwang et al., 2011). Rates of LWBS may be lower in rural areas due to decreased availability of alternative options for healthcare.
Hospital ownership. Hsia, Asch, et al. (2011) found that county ownership was
hospitals see a greater number (density) of patients who are more likely to LWBS (Hsia, Asch, et al., 2011). However, ownership also reflects the level of public accountability and it is proxy for centralization. The level of centralization impacts the organization’s ability to respond to problems (Daft, 2010); such as poor patient flow. Organizations that are
publically accountable are more centralized and give less discretion to managers who could rapidly respond to issues that limit patient flow (Donaldson, 2001). Privately owned organizations are decentralized and give more discretion to their managers (Donaldson, 2001). Privately owned organizations, due to the communities they serve, have increased economic incentive to reduce average delays (Hall, 2006). Therefore, for-profit hospitals are expected to have fewer LWBS compared to hospitals that are owned by the county and government.
Region. ED utilization rates vary by geographic region (Pitts et al., 2008). Higher
average utilization levels (density) are associated with longer waiting times (Hall, 2006). The South has the highest percentage of LWBS (Bourgeois et al., 2008; Sun et al., 2007). The increased LWBS rates in the South may be due to higher utilization related to
educational, income, and health disparities (Centers for Disease Control [CDC], 2013). Aim 3: Do organizational characteristics moderate the relationship between patient characteristics and LWBS?
An organization can provide the highest quality care and the patient can still experience poor outcomes due to patient characteristics. Comorbidities such as diabetes predispose the patient to poor outcomes. When evaluating patient outcomes it is important to consider the context of care delivery and patient mix.
Interaction or moderation occurs when the relationship between two variables changes based on a third variable (Heck & Thomas, 2009; Sahai & Ageel, 2000). When the variables involved in an interaction are measured at different levels in the data hierarchy, the interaction is known as a cross-level interaction (Heck & Thomas, 2009). A cross-level interaction between patient and organizational characteristics is suspected based on heterogeneity in reported LWBS rates among hospitals (Hsia, Asch, et al., 2011). The presence of an interaction between patient and organizational characteristics would indicate that the effect of patient characteristics on LWBS is dependent on hospital characteristics. Hsia, Asch, et al. (2011) examined group-level data from 262 California hospitals and concluded that certain individuals were at higher risk of LWBS because of the hospitals they visit. If this relationship is consistent in a national dataset, the presence of an interaction between patient and organizational characteristics has important implications for
interventions aimed at decreasing LWBS by highlighting the organizations most in need and the best areas to target with the intervention.
hypothesized that patients who have characteristics associated with a higher likelihood of LWBS would be more likely to leave when presenting at EDs that have characteristics associated with higher LWBS or at times when EDs more are crowded.
Purpose Statement
The objective of this study is to understand how organizational characteristics
moderate the relationship between patient characteristics and LWBS. The central hypothesis is that the relationship between patient characteristics and LWBS will be moderated by organizational characteristics leading to higher than expected rates of LWBS in organizations with increased density or input. The rationale for the proposed study is that, we currently do not have an adequate understanding of the impact that organizational characteristics have on the relationship between patient characteristics and LWBS and, yet, in the near future reimbursement will be tied to LWBS without regard to differences in patient casemix and organizational characteristics. The new CMS reimbursement program has the potential to make access worse in organizations seeing a higher proportion of patients with characteristics that make them more likely to LWBS. Once the relationship among these variables is
CHAPTER 4
METHODS
Introduction
This study was a secondary analysis of a nationally-representative dataset of visits to EDs in the U.S. and focused on identifying factors associated with patients who left the ED without being seen (LWBS) by a provider. This chapter describes the methods that were used to examine the relationships between the patient and organizational characteristics and LWBS. The data used for this analysis were collected by the National Center for Health Statistics using a complex, multistage sampling framework (McCaig & McLemore, 1994). In order to identify patient and organizational variables that were associated with LWBS and to determine the impact organizational variables have on the relationship between patient variables and LWBS, a multilevel modeling approach was employed in the analysis.
Design
This study examined data from the National Hospital Ambulatory Medical Care Survey Emergency Department (NHAMCS-ED) 2007-2010. Multilevel models were
constructed This study was not considered to be human subjects research by the University of North Carolina at Chapel Hill Institutional Review Board see Appendix C for IRB
Data Set
NHAMCS-ED is an annual, national survey of visits to non-federal, general, and short-stay hospitals in the United States conducted by the CDC and the National Center for Health Statistics (NCHS). NHAMCS-ED was selected for this study because it is readily available and has clearly defined measures that will facilitate a population-based analysis of LWBS. The data were collected using a standardized collection form (see Appendix A) and includes a representative sampling of EDs in the U.S. Patient level variables (age, sex, triage acuity, day of week, arrival time, race and ethnicity) and the organizational level variables (ownership, MSA status, and region) are publically available from the NCHS. For this study, additional variables (hospital identification code, patient identification code, sample weights for patients and EDs, setting type, and year) were included to assist with the dataset creation and analysis.
The NHAMCS sample is a nonrandom sample meaning that hospitals and individuals did not have an equal chance of being selected. Sample weights were included in NHAMCS-ED to account for the unequal selection probabilities at the patient and NHAMCS-ED level. These sample weights allow estimation of population totals thereby enhancing the generalizability of the results. The weights were adjusted by NCHS for survey nonresponse within time of year, geographic region, MSA status, and ownership. The mean of the patient weights was 3542.53 with values ranging from 18 to 15067. The mean of the ED weights was 13.51 with values ranging from 1 to 69.
level should reflect this conditional probability of selection. This is because when using survey data with multistage sampling, the simple weighting of sample observations in Multilevel Modeling (MLM) creates biased estimates (Pfefferman, Skinner, Holmes, Goldstein, & Rabash, 1998; Rabe-Hesketh & Skrondal, 2006) because the conditional probability of selection is not accounted for.
Another consideration when applying sample weights to MLM in SAS is that the sum of the weights, supplied with the dataset, is the population size and most model-based
statistical packages, including SAS, use the population size in the analysis (Hahs-Vaughn, 2005). The use of scaled weights allows the actual sample size to be used in the calculation of standard errors and test statistics. Scaled weights are created by multiplying the weights by a scaling constant (Asparouhov, 2004).
For this study, an analysis weight was created using the MPML-WT macro from Chantala, Blanchette, and Suchindran (2011) and the scaling procedure from Wei and
Parsons (2009). The MPML-WT macro was constructed for SAS users and was based on the multilevel pseudo maximum likelihood estimation method for weighting that was developed by Asparouhov (2004). The MPML-WT macro created a composite weight, mpml_wtai,j, by
dividing the product of the level 1 weight component for unit i sampled from cluster j and the level 2 weight component for cluster j by the average of the level 1 weight components for units sampled from cluster j (Chantala et al., 2011). See Figure 4 from Chantala et al. (2011, p. 9) for more information on composite weight calculation.
The sum of these scaled composite (analysis) weights is equal to the total number of observations in the sample. Thus, correct calculations could be obtained in SAS PROC GLIMMIX (Version 9.4. SAS Institute, Inc., Cary, NC) since the sum of the analysis weights equals the total number of observations and not the population size.
Figure 4. Composite Weight Calculation. Sample
Inclusion criteria for the sample were an ED visit between 2007 and 2010, with data available on patient characteristics (age, acuity, sex, race, ethnicity, day of week, arrival time), and organizational characteristics (region, MSA status, and ownership). The years 2007 to 2010 were chosen because they included the most recent data available in
NHAMCS-ED collected using consistent methods and done so prior to the enactment of the Affordable Care Act (ACA). Multiple years of data were combined to improve reliability of estimates (McCaig & Woodell, 2006). The level 1 unit of analysis for NHAMCS-ED is the patient visit. The multistage sampling method that the NCHS used to obtain annual national probability sample for NHAMCS-ED is described below.
First-stage sample. The first-stage sample is obtained from primary sampling units
The NHIS PSU sample was selected from 1900 geographically defined PSUs, which were stratified by socioeconomic and demographic variables, including metropolitan statistical area (MSA) status, and then selected with a probability proportional to their size (National Center For Health Statistics, 2011). Twenty-six PSUs within the largest populations were included with certainty. One-half of the next 26 largest PSUs were included. From the remaining PSUs, one was selected from each of the 73 PSU strata. A total of 112 PSUs were selected for the first-stage sample.
Second-stage sample. The second-stage sample consisted of hospitals within the 112
PSUs. The sampling frame for NHAMCS-ED was the Healthcare Market Index and Hospital Market Profiling Solution (National Center for Health Statistics, 2011). Federal, military, and Veterans Administrations were not included in the sample. Criteria for inclusion were: average length of stay less than 30 days and general hospitals (medical, surgical, and children’s). Criteria for exclusion were federal hospitals, hospital units of institutions, and hospitals with less than six staffed beds for patient use.
The sample included all hospitals in non-certainty PSUs with five or fewer hospitals. Hospitals in non-certainty PSUs with more than five hospitals were stratified by hospital class (ownership and size). Five hospitals were selected from each PSU with a probability proportional to the number of ED and outpatient visits. Hospitals in certainty PSUs were stratified (by region, class, ownership, and size) and hospitals were selected based on probability proportional to size.
each subset was assigned to one reporting period (four weeks). The reporting periods rotate across each survey year and, thus, the reporting period is not the same time every year.
Third-stage sample. The third-stage sample consisted of emergency service areas
(ESAs) within hospitals. An ESA describes the services and population that is served by the ED. For example, an ESA could be general, adult, pediatric, fast track, or psychiatric
(National Center for Health Statistics, 2010).
Fourth-stage sample. The fourth-stage sample consisted of patient visits during a
four week period within ESAs. A visit was defined “as a direct, personal exchange between a patient and a physician, or a staff member acting under a physician’s direction, for the purpose of seeking care and rendering health services” (National Center For Health Statistics, 2011, p. 8). Using systematic random sampling, one hundred patient record forms were completed at each ED (Hing, Gousen, Shimizu, & Burt, 2003).
Sample Size
Sample size determination in multilevel designs is complicated by the presence of multiple levels and cross-level interactions. It is the number of groups, not the total sample size, which affects the ability to detect effects at higher levels and cross-level interactions (Hox, 2010). Hox (2010) suggests the 50/50 rule, 50 groups with 50 individuals per group to detect effects in nonlinear designs. An a priori estimate determined that the final sample would include between 300 to 400 hospitals per year representing 4800 EDs in the U.S. and each year would contain approximately 34,000 observations. Using the 50/50 rule
Measures
Dependent variable. LWBS was the outcome variable and is defined as an ED visit
during which the patient was initially registered but leaves before being seen by a medical provider. For this study LWBS was characterized as either “true” (the patient registered but was not seen by a provider) or “false” (the patient was registered and seen by a provider). A visit is defined as a direct exchange between a patient and a provider for the purpose of obtaining health care (National Center for Health Statistics, 2011).
Independent variables. The independent variables examined in this study are
provided in Table 4 located in Appendix B. While these variables have been associated with LWBS in earlier LWBS research, it is not known if they will still be associated with LWBS in a multilevel model. Additionally, including them provided the opportunity to examine the effect organizational variables have on the relationship between patient variables and LWBS.
Data Analysis
The approximation of the marginal log likelihood improves with the number of quadrature points. Due to difficulty with model convergence, the number of quadrature points was set to one for the analysis. Specifying the number of quadrature points reduces the computational burden of the procedure by eliminating the need for GLIMMIX to
adaptively determine the number of points where the cumulative frequency is sampled (SAS Institute Inc., 2014).
Estimates of covariance parameters and fixed effects are potentially biased when estimating generalized linear models due because of the approximation of the marginal log likelihood (SAS Institute, 2014). Using robust standard error estimators makes the analysis robust against misspecification of the covariance structure (Kauermann & Carroll, 1999). The robust standard error estimators perform well with data that is not normally distributed (Zhu, 2014).
Parameter estimation was improved by accounting for clustering in the data using the between-within method to calculate the denominator degrees of freedom for the F tests. The between-within method is an approximate method for calculating degrees of freedom in unbalanced likelihood-based designs. In contrast, calculation of the degrees of freedom for the Analysis of Variance (ANOVA) F statistic is a method used with linear balanced designs.
This between-within method divides the denominator degrees of freedom into
between-subject and within-subject degrees of freedom (Schluchter & Elashoff, 1990; Wang, Xie, & Fisher, 2012). Specifically, for each fixed effect, the between-within method
region, ownership) change within hospitals. In a model that only assesses the effect of these variables on LWBS, the between-within method would compute the denominator degrees of freedom for each effect using between-subject degrees of freedom, which would equal (total number of hospitals) – (total number of estimated parameters) in this case.
Prior to analyses, analysis weights were created as previously described in the data set section of this chapter. The use of scaled weights permits calculation of unbiased parameter estimates (Carle, 2009) because the scaled weights sum to the actual sample size but retain the representativeness of the population (Osborne, 2011). Descriptive statistics were calculated for all patient and organizational variables using the SAS SURVEY procedures FREQ and LOGISTIC (SAS Institute, Inc., 2014). Table 5 includes a list of planned analyses.
Table 5
Planned Analyses for Variables
Descriptive Analyses Variables
Frequency and percentages All Variables
Chi-square Association between:
Region and LWBS Ownership and LWBS
Metropolitan area status and LWBS Gender and LWBS
Day of the week and LWBS Race and ethnicity and LWBS
Multivariate Analyses Variables
Aim 1: What is the relationship between selected patient characteristics and LWBS?
Random Intercept, Fixed Effects with Level-1 Variables
Age, Gender, Race/ethnicity, Arrival time, Day of Week, Acuity
Aim 2: What is the relationship between organizational characteristics and LWBS?
Random Intercept, Fixed Effects with Level-2 Variables
Region, MSA status, Ownership Aim 3: Do organizational characteristics
moderate the relationship between patient characteristics and LWBS?
Random Slope Coefficients
Model Building
Model building used an exploratory approach as described by Hox (2010). This approach was used to explain potential sources of variation (within- and between-group) in LWBS. Model building began with the null model (intercept only). Parameter estimates, statistical significance, model fit (deviance), and changes in explained variance were examined at each stage and significant predictors were retained.
The null model (Equation 1) is a random intercept model without any predictors; only the intercept is allowed to vary. The null model was used to calculate the intraclass
correlation (ICC) statistic and to compare model fit for subsequent models. A significant ICC confirms the need for MLM and identifies the amount of variance in the outcome variable that is explained at the group level (Level-2).
(Equation 1) Logit (P(Yij= 1) = β0j
β0j = γ00 + u0j u0j~N(0, τ00)
(Combined) Logit (P(Yij= 1) = γ00 + u0j
We define Yij as the outcome variable corresponding to LWBS, where Yij= 1 if patient
i in hospital j LWBS and Yij=0 if the person did not LWBS. In Equation 1, P(Yij= 1) and
logit(P(Yij= 1) = log[P(Yij= 1)/(1- P(Yij= 1)] denote the probability and log odds,
respectively, of LWBS for patient i in hospital j. In addition, β0j denotes the random intercept
for hospital j, which is comprised of a grand mean term γ00 and a random error term u0j for
hospital j, which is assumed to follow a normal distribution with mean 0 and variance τ00
(i.e., u0j~N(0, τ00)). Therefore, we construct in Equation 1 a multilevel regression model
The organizational model (Aim 2) was elaborated first. Next, the patient model (Aim 1), was elaborated followed by the cross-level analyses (Aim 3) between group-level
variables and significant level-1 random coefficients. Visual aids and bivariate analyses were examined prior to introducing predictors in order to guide specification of the terms in the model. Diagnostic measures were examined to aid in correct model specification. Analysis weights were used so that the results were generalizable to the population of interest.
Aim 2: What is the Relationship between High Volume Organizational Characteristics and LWBS?
Organizational characteristics influence the process of care, what is done for the patient, and the timeliness of treatment (speed) (Figure 4). High volume organizational characteristics were hypothesized to be associated with increased LWBS because patients in these organizations will experience delays in treatment.
Based on previous research, variation in LWBS across hospitals was expected. Hsia, Asch, et al. (2011) found that LWBS for county-owned hospitals was 5.0% compared to 2.5% for not-for-profit hospitals, 5.1% for teaching hospitals compared to 2.5% for nonteaching hospitals, and 3.9% for trauma centers compared to 2.5% for non-trauma centers.
Using the approach of Singer (1998), Level-2 explanatory variables were added first in an effort to explain variation in LWBS across groups. The random intercept, fixed slope model with Level-2 predictors expanded the null model and included the group-level variables region, ownership, and MSA status (Equation 2). The intercept, β0j, was the only
(Equation 2) Logit (P(Yij= 1)) = β0j
β0j = γ00 + γ01MSAj + γ02Ownerj + γ03Regionj + u0j
(combined) Logit (P(Yij= 1)) = γ00 + γ01MSAj + γ02Ownerj + γ03Regionj + u0j
Aim 1: What is the Relationship between Selected Patient Characteristics and LWBS?
Level-1 predictors were added to the model in order to compare patients who LWBS from the same hospital (Equation 3). During this step, all Level-1 predictors were treated as fixed-effects and only the intercept is allowed to vary across hospitals. Within each hospital, the log odds of LWBS was modeled as a function of patient age, acuity, race and ethnicity, visit day of the week, and arrival time.
(Equation 3) Logit (P(Yij= 1)) = β0j + β1jAgerij + β2jVdayrij + β3jGenderij + β4jAcuityij +
β5jArrival1ij + β6jRaceeth4ij
β0j = γ00 +u0j u0j~N(0, τ00)
β1j = γ10
β2j = γ20
β3j = γ30
β4j = γ40
β5j = γ50
β6j = γ60
(Combined) Logit (P(Yij= 1)) = γ00 + γ10Agerij + γ20Vdayrij + γ30Genderij + γ40Acuityij +
γ50Arritime_cat4ij + γ60Raceeth4ij + u0j
Aim 3: Do Organizational Characteristics Moderate the Relationship between Patient Characteristics and LWBS?
The current literature does not address moderation of the relationship between patient characteristics and LWBS by organizational characteristics. However, moderation was suspected based on known variation in LWBS across hospitals. If organizational
characteristics did not moderate the relationship between patient characteristics and LWBS, there should be little to no variation in LWBS between hospitals with similar patient
From a statistical perspective, it is important to test for interactions. Interactions indicate that the relationship between the independent variable and the outcome are dependent on a third variable (Sahai & Ageel, 2000). Therefore the effects of variables involved in an interaction cannot be interpreted independently of that interaction. Failing to consider the interactions can lead to misleading interpretations.
Aim 3 was tested after level-1 predictors were found to have significant random effects (Equation 4; see Appendix D). Due to the computational intensity of the quadrature method, models were used to test each random effect individually. A significant random effect for each level-1 predictor indicated that the strength of the relationship between the level-1 predictor and outcome varied between hospitals. Testing cross-level interactions allowed this variance to be explained. Predictors from Equations 2, 3 and 4 were tested for interaction effects. To ensure convergence, each interaction was tested individually
(Equation 5; see Appendix D).
Limitations
Due to the cross-sectional design of the study, causal inference is difficult to establish (Hulley, Cummings Browner, Grady, & Newman, 2007). However, the goal of this study was to determine association, not causation, between selected patient and organizational factors with LWBS. The cross-sectional study design provided an efficient method, in terms of time and money, for obtaining a large sample of hospitals across the U.S. The large sample of hospitals that were examined in this study enhanced the generalizability of the findings.
organization chooses how it defines LWBS. Anecdotally a patient may leave prior to being registered. In this instance there is no record that the patient ever presented for care.
NHAMCS-ED was chosen for this study because of the inclusion of required variables, namely LWBS, and a large sample of hospitals across the U.S. However,
NHAMCS-ED has the potential for errors in data collection and coding because abstractors are trained in data collection but there is no verification or oversight of their work. There is also an inability to identify duplicate hospitals and patients within the sample.
A large percentage of data for race, ethnicity, and acuity was missing (acuity 15.5% in 2007 and 15% in 2008, 18% in 2009, 20% in 2010; Ethnicity 22% in 2007, 24% in 2008, 13% in 2009 and 2010; Race 13% in 2007, 15% in 2008, 10% in 2009, 11% in 2010). Single imputation was used by NCHS to impute these variables for NHAMCS-ED.
allows them to impute variables with less bias than researchers without access to this information.
Summary
CHAPTER 5
RESULTS
Introduction
Patient flow has become an important topic for providers, patients, and regulatory agencies due to the delays in care that are a result of ED crowding. The Joint Commission has a standard addressing patient flow and CMS is linking financial reimbursement to patient flow metrics. LWBS is a commonly measured patient flow metric. The purpose of this study was to identify patient and organizational variables that were associated with LWBS in a multilevel study and to determine how organizational variables impact the relationship between patient variables and LWBS. The results of the analyses are presented in this chapter. The chapter begins with a brief description of the study sample. The results of the descriptive and bivariate analyses are presented first followed by the multivariate results. The results of the multivariate analyses are presented for each model that was fit.
Study Sample
1,752 (1.7% of the weighted sample) visits were coded as LWBS. A total of 1,026 hospitals were included the dataset. The study sample characteristics are presented in Table 6. Table 6
Study Sample Characteristics
2007 2008 2010 Final Sample
Visits
Unweighted 35490 34134 34936 104560
Visits
Weighted 116,802,066 123,761,419 129,843,377 370,406,862
LWBS % 1.6% 1.6% 1.8% 1.7%
LWBS #
Unweighted 577 531 644 1752
LWBS #
Weighted 1,926,453 2,008,797 2,358,610 6,293,860
Hospitals
Unweighted 340 336 350 1026
Descriptive Statistics
The characteristics of the patient visits and hospitals in the final study sample are included in Table 7 (Appendix E). The sample consisted of 54.5% females and 45.5% males.
Data for acuity and arrival time were missing for some visits. Acuity was missing for 15.5% of the records from 2007 and 2008; however the NCHS imputed only 3% of these visits. The remaining (N = 10,171) were listed as missing in the final sample and are excluded from Tables 6 and 7. In the 2010 sample, 20.4% (N = 7118) of the visits were missing acuity and all of these values were imputed by the NCHS. Since SAS performs complete case analysis, 10,171 visits were excluded from the final analyses involving acuity because of the missing values for acuity. There was a significant association between the missing values for acuity and LWBS
(p < .0001).
Arrival time was missing for 1% (N = 1088) of the sample. Values for arrival were not imputed for any of the years. All of these 1,088 visits were excluded from the final analyses and are not included in Table 6 and Table 7 (see Appendix E). While the percentage of missing values was small, it was determined that these missing values had a significant, positive association with LWBS (p < .0001). This is discussed further in the limitations section.
Bivariate Analyses
Bivariate analyses were conducted to identify predictor variables that were associated with LWBS. The results of the analyses are in Table 8 provided below and Table 9
provided in Appendix E. To account for the complex sampling, the Modified Rao-Scott Chi-square (χ2R-S) was used to determine which variables had a significant association with
Race/ethnicity, metropolitan area, and the South had the highest percentage of LWBS. Due to the binary outcome variable, LWBS, and the ordinality of the predictor variables, the bivariate analyses for age, arrival, and acuity were performed using a simple logistic regression. Age, arrival, and acuity were significantly associated with LWBS (p < .0001). Younger age, arriving after 11 a.m., and lower acuity (acuity 4 and 5) had higher odds of LWBS. Gender and ownership did not have a significant association with LWBS. Table 8
Weighted Bivariate Analyses: Associations between Nominal Independent Variables and LWBS
Independent Variables
Rao-Scott Chi-square χχχχ2
Degrees of
Freedom p-value
Day of Visit 26.10 6 0.0002
Race/Ethnicity 56.11 6 < .0001
Gender 1.34 1 0.2468
MSA 72.04 1 < .0001
Ownership 0.14 2 0.9331
Region 78.03 3 < .0001
Note. Values in bold are significant.
Multivariate Analyses
Model building used an exploratory approach similar to Hox (2010) and Singer (1998) to explain potential sources of variation (within- and between-group) in LWBS. Model building began with the null model (intercept only) model; in this model only the intercept was allowed to vary across Level-2 groups (hospitals in this study). Intraclass correlation (ICC) was calculated using the null model.
Null model. The null model or random intercept model does not contain any