Mechanical Properties and Dislocation Substructure
of Inconel 690 Alloy Impacted at Cryogenic Temperatures
Woei-Shyan Lee
+and Ming-Chia Hsu
Department of Mechanical Engineering, National Cheng Kung University, Tainan 701, Taiwan
The mechanical response and dislocation substructure of Inconel 690 during impact deformation are investigated at strain rates of 2©103³6©103s¹1and temperatures of¹150°C, 0°C and 25°C using a compressive split-Hopkinson pressure bar system. The results show that theflow stress, work hardening rate and strain rate sensitivity all increase with increasing strain rate or decreasing temperature. By contrast, the activation volume reduces as the strain rate increases or the temperature decreases. Moreover, the temperature sensitivity increases with both increasing strain rate and increasing temperature. Optical microscopy observations show that adiabatic shear bands are formed at the highest strain rate of 6©103s¹1in all of the tested specimens. In addition, it is shown that adiabatic shear localisation is the major cause of specimen failure in every case. The dislocation density increases, and the cell size decreases, as the strain rate is increased or the temperature decreased. The change in the dislocation density and cell size is found to have a significant effect on theflow stress and work hardening behaviour of the Inconel 690 specimens; particularly at high strain rates or low temperatures. [doi:10.2320/matertrans.M2014165]
(Received May 1, 2014; Accepted August 12, 2014; Published October 3, 2014)
Keywords: Inconel 690, impact, cryogenic deformation, strain rate effect, dislocation
1. Introduction
Inconel 690 is one of the most important nickel-based superalloys, and is used extensively in the construction of gas turbines, nuclear reactors, spacecraft, liquid-fuel rocket engines, autonomous underwater vehicles, cryogenic storage tanks, and combustion systems due to its good corrosion resistance, high strength and outstanding weldability.1,2) In
many applications, Inconel 690 components are subject to deformation at both high strain rates and cryogenic temper-atures. For example, in autonomous underwater vehicles,3)
cryogenic storage tanks and liquid-fuel rocket engines,4)the
components frequently operate at strain rates of 102³104s¹1
and temperatures as low as¹200°C. The literature contains many investigations into the response and microstructural evolution of Inconel 690 under quasi-static or dynamic loading conditions at room or elevated temperatures.510) By contrast, the high strain rate deformation behaviour of Inconel 690 under cryogenic temperatures has attracted relatively little attention. However, in designing Inconel 690 structural components for implementation in arduous operat-ing conditions, such an understandoperat-ing is urgently required.
The mechanical properties of engineering metals and alloys are significantly dependent on the strain rate and temper-ature.1115)Generally speaking, the work hardening behaviour
and flow stress of such materials increases with increasing strain rate or decreasing temperature. Moreover, the strain rate sensitivity of the flow stress increases significantly at strain rates greater than 103s¹1. Various rate-controlling mecha-nisms have been proposed to explain this deformation behaviour, including dislocation damping, thermal activation and dislocation generation.16,17) In practice, the dynamic deformation behaviour of metallic materials at high strain rates is determined by the result of a competition process between the work hardening effect induced by plastic deformation and the thermal softening effect induced by the heat produced during deformation. For deformation under
adiabatic conditions, the thermal softening effect exceeds the work hardening effect, and thus material instability occurs. Once an unstable condition is attained, extreme localisation of the deformation occurs; resulting in the formation of adiabatic shear bands.18,19)The literature contains various proposals for the possible mechanisms responsible for the initiation and propagation of adiabatic shear bands2022)and for constitutive
equations to describe their behaviour.2325)
Many studies have shown that impact loading leads to the formation of dislocations in the deformed microstructure, which result in turn in a change in the mechanical proper-ties.2628) In addition, it has been widely reported that the
dislocation density increases with increasing strain and strain rate.2931)Moreover, the square root of the dislocation density is inversely related to the flow stress.3234) The high strain rates associated with impact loading result in a rapid multiplication of the dislocations, and thus the equilibrium structure of high stacking fault FCC metals and alloys is characterised by a large number of dislocation cells.35)As the strain rate increases, the size of the dislocation cells reduces; leading to a greater rate of work hardening and an enhanced
flow resistance. It has been shown that the relationship between the average dislocation cell size, theflow stress and the hardening behaviour can be described using a common power law model.36)
The present study utilises a compressive split-Hopkinson pressure bar (SHPB) system to investigate the impact response of Inconel 690 at temperatures ranging from
¹150³25°C and strain rates of 2©103³6©103s¹1. Transmission electron microscope (TEM) observations are performed to examine the dislocation substructures of the deformed specimens. Finally, the correlation between the properties of the deformation microstructure and the me-chanical response of the Inconel 690 specimens is system-atically examined and discussed.
2. Experimental Procedure
The Inconel 690 alloy used in the present study was
+Corresponding author, E-mail: wslee@mail.ncku.edu.tw
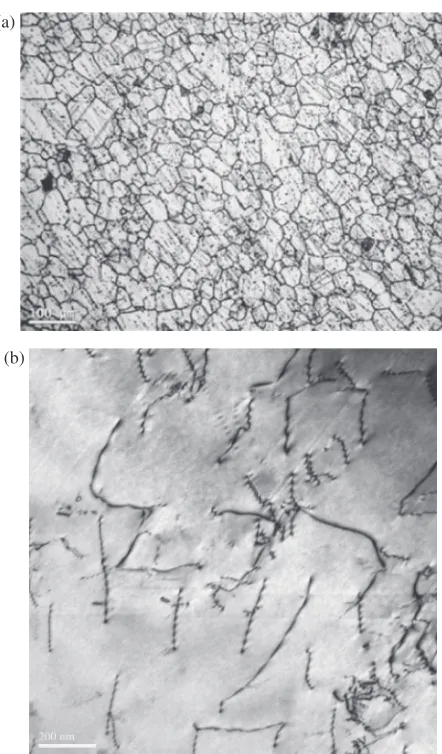
acquired in plate form from Inco Alloys International (Huntington, Virginia, USA). Prior to receipt, the plates were solution annealed at 1150°C for 1 h and then quenched in water. The chemical composition of the as-received solution-annealed alloy (mass%) was as follows: 29.33% Cr, 10.01% Fe, 0.29% Ti, 0.19%Al, 0.10% Cu, 0.03% Co, 0.02% Mo, 0.02% W, 0.01% C, and a balance of Ni. Figure 1(a) presents an optical micrograph of a typical specimen prepared from the as-received plate. As shown, the microstructure consists of equiaxed grains with an average size of 42 µm and a small number of annealing twins. In addition, discrete inter- and intra-granular (M23C6) chromium
carbides and titanium carbonitrides Ti(C,N) are also observed within the matrix. The M23C6and Ti(C,N) particles create a
barrier effect, which accelerates the generation and accumu-lation of dislocations during impact deformation. Figure 1(b) presents a TEM image of the dislocation structure of the as-received alloy. It is seen that the microstructure contains a relatively small number of dislocations. It is further observed that most of the dislocations have an edge characteristic and are aligned along specific crystallographic planes. Cylindrical specimens with a length of 5«0.1 mm and a diameter of 5.2 mm were machined from the alloy plates with the impact axes parallel to the longitudinal direction and werefinished to afinal diameter of 5«0.1 mm via a centre-grinding process.
The dynamic impact tests were conducted using a SHPB system at strain rates of 2©103s¹1, 4©103s¹1 and 6©103s¹1, respectively, and temperatures of ¹150°C, 0°C and 25°C. The striker bar, incident bar and transmitter bar of the SHPB apparatus (see Fig. 2) were made of DC53 die steel and had a diameter of 15 mm. The incident bar and transmitter bar each had a length of 1 m, while the striker bar had a length of 317 mm. In performing the tests, the specimens were sandwiched between the incident bar and the transmitter bar, and the incident bar was then impacted by the striker bar (fired by a gas gun). To ensure a uniaxial deformation state (i.e., frictionless conditions), the end surfaces of each specimen were lubricated using commercial molybdenum disulfide (Molykote). The low testing temper-atures of 0°C and ¹150°C were obtained by fitting a refrigeration system around the specimen. Liquid nitrogen and alcohol were added to the system at the beginning of the experimental tests and were replenished periodically in order to maintain a constant fluid level. Following impact, the strain pulses within the incident and transmitter bars were detected by means of strain gauges mounted at the midpoint of each bar. The compressive stress-strain response of the specimen was then established in accordance with uniaxial elastic wave theory.37) Specifically, based on the recorded
values of the incident, reflected and transmitted pulses (i.e., ¾i,¾rand¾t, respectively), the average compressive
engineer-ing strain¾e, nominal strain rate¾, and average compressive_
engineering stress·ewere calculated as follows:
¾e¼ ð2C0=L0Þ Z
¾rdt; ð1Þ
_
¾¼2C0¾r=L0; ð2Þ
·e¼EðA=A0Þ¾t; ð3Þ
whereC0is the longitudinal wave velocity;L0is the effective
gauge length of the specimen; Eis the Young’s modulus of the split-Hopkinson bars; andAandA0are the cross-sectional
areas of the split-Hopkinson bars and specimen, respectively. Having obtained the engineering stress-strain data, the true stress (·T) and true strain (¾T) were determined respectively
as
·T ¼·eð1¾eÞ: ð4Þ
¾T¼ lnð1¾eÞ: ð5Þ
To ensure the reliability of the experimental results, three tests were performed under each of the considered strain rate/ temperature conditions. The stress-strain curves for each test condition were then obtained by means of a least-squares
fitting technique.
Following the impact tests, the deformed specimens were ground progressively using abrasive papers with grit sizes ranging from 180 to 1200 mesh. The ground specimens were polished with a micro-cloth dipped in a slurry of water and 0.3-µm alumina particles, and were then etched in a solution comprising 70 ml of H3PO4 and 30 ml of D.I. water. The (a)
(b)
Fig. 1 Micrographs of test specimen prepared from solution-annealed Inconel 690 plate: (a) Optical microscope, and (b) TEM.
[image:2.595.59.280.65.442.2] [image:2.595.306.547.68.105.2]specimens were observed using an Axiovert 200 Mat optical microscope. Thin foils and discs for TEM observations were prepared from the deformed specimens by cutting slices with a thickness of 0.5 mm in a direction perpendicular to the compression axis. The slices were ground to afinal thickness of 0.2 mm using 1200 grit size soft paper and discs with a diameter of 3 mm were then trepanned from each slice using an electron discharge machining system. The foils were electro-polished in a solution of 10% perchloric acid and 90% methanol at a temperature of ¹20°C using a twin-jet polishing machine with an agitation voltage of 20 V DC. The specimens were observed using a JEOL TEM-3010 scanning transmission electron microscope with an operating voltage of 300 kV. In addition, the detailed characteristics of the fracture features were examined using a Philip’s XL-40FEG scanning electron microscope (SEM) with an operating voltage of 20 kV.
3. Results and Discussions
3.1 Stress-strain curves
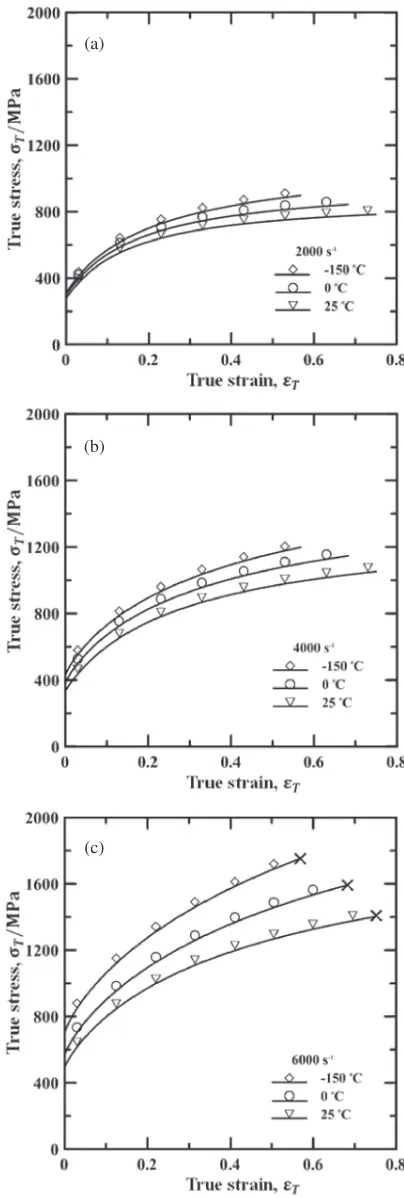
Figures 3(a)³3(c) show the true stress-strain curves of the Inconel 690 specimens tested at strain rates of 2©103s¹1, 4©103s¹1and 6©103s¹1, respectively. It is seen that the
flow behaviour of the specimens is strongly dependent on both the strain rate and the temperature. Specifically, theflow stress increases with increasing strain rate or decreasing temperature. From inspection, the maximum increase in the
flow stress is found to be 420 MPa as the temperature is reduced from 25°C to¹150°C at a strain rate of 6©103s¹1
(Fig. 3(c)). For each strain rate and temperature, the rate at which the flow stress increases with increasing strain is different; indicating a difference in the work hardening rate under different loading conditions. Furthermore, for a given strain rate, the maximum true strain decreases with decreasing temperature. Thus, it is inferred that a loss of ductility occurs at lower deformation temperatures. It is noted that none of the specimens fail when tested at strain rates lower than 4©103s¹1. However, at the highest strain rate of 6©103s¹1, catastrophic failure occurs in all of the specimens. In other words, the Inconel 690 specimens experience a loss in toughness and fracture resistance when deformed under higher strain rates and cryogenic temper-atures.
The true stress-strain curves shown in Fig. 3 indicate that the work hardening rate (@·=@¾) is dependent on the strain, strain rate and temperature. Table 1 shows the variation of the work hardening rate with the temperature at true strains ranging from 0.04 to 0.7 and strain rates of 2©103s¹1,
4©103s¹1and 6©103s¹1, respectively. It is observed that for a given strain rate and temperature, the work hardening rate decreases with increasing strain; indicating that a greater rate of dislocation generation and multiplication takes place during the early stages of the deformation process. For a constant true strain, the work hardening rate increases with increasing strain rate, but decreases with increasing temper-ature. Thus, it is inferred that a higher strain rate induces a more intensive generation and accumulation of dislocations during deformation, while a higher temperature prompts a stronger microstructural recovery process.
3.2 Strain rate sensitivity and thermal activation volume
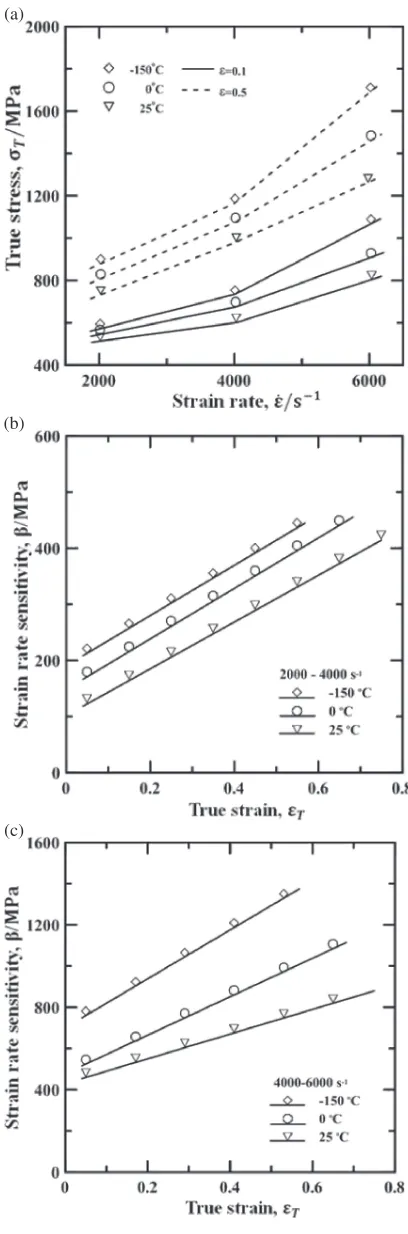
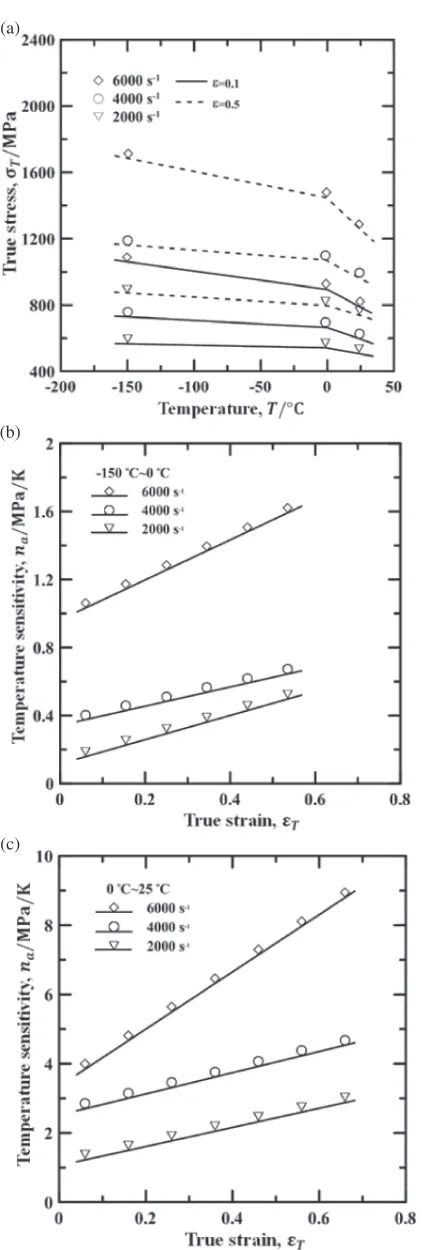
Figure 4(a) shows the variation of theflow stress with the logarithmic strain rate as a function of the temperature at true strains of 0.1 and 0.5, respectively. It is seen that for both values of the true strain, the flow stress increases more
(a)
(b)
(c)
[image:3.595.324.526.68.667.2]rapidly at strain rates in the range of 4©103³6©103s¹1. In
other words, the strain rate sensitivity of the Inconel 690 alloy specimens increases at higher strain rates. Some researchers have argued that the abrupt increase in the strain rate sensitivity of engineering metals and alloys at higher strain rates is the result of a change in the rate-controlling mechanism from thermal activation to dislocation drag.16) However, other studies have attributed the enhanced strain rate sensitivity to an increased rate of dislocation generation, the rapid formation of twin structures, or a greater degree of martensite transformation.17,28)
The strain rate sensitivity of the Inconel 690 specimens can be characterised via the following parameter:
¢¼ ð@·=@ln _¾Þ ¼ln·2ð¾_·1
2=_¾1Þ; ð6Þ
where the compressive stresses·2 and ·1 are obtained from
tests conducted at average strain rates of _¾2 and _¾1, respectively. Figures 4(b) and 4(c) show the variation of the strain rate sensitivity with the strain as a function of the temperature given strain rate ranges of 2©103³4©103s¹1 and 4©103³6©103s¹1, respectively. Comparing the two
figures, it is seen that for a given strain and deformation temperature, the strain rate sensitivity increases with increas-ing strain rate. In addition, it is observed that for a given strain rate range, the strain rate sensitivity increases with increasing strain, but decreases with increasing temperature. At low strain rates (i.e., 2©103³4©103s¹1), the rate of increase of the
strain rate sensitivity with increasing strain is almost the same for all three deformation temperatures. However, at high strain rates (i.e., 4©103³6©103s¹1), the strain rate sensitivity
increases more rapidly with increasing strain as the temper-ature reduces. It is thought that the increase in the strain rate sensitivity at higher strain rates and lower temperatures is the result of a greater dislocation multiplication rate.
The plastic deformation of metals and alloys is known to be governed by a thermal activation process. For a given material, the activation volume,¯, can be computed as38,39)
¯ ¼@G @· ¼KT
@ln _¾
@·
¼KT¢ ; ð7Þ
where G is the activation energy associated with the plastic deformation process,Kis the Boltzmann constant and
has a value of K=1.38©10¹23J K¹1, T is the absolute
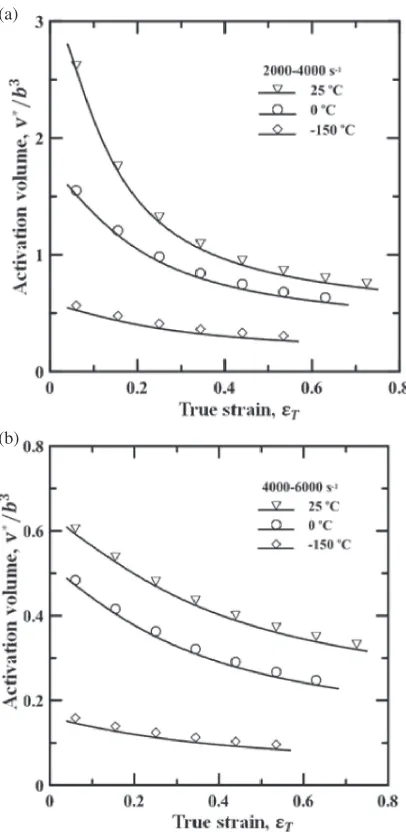
[image:4.595.323.527.69.686.2]temperature, and ¢is the strain rate sensitivity. Figures 5(a) and 5(b) show the variation of the activation volume with the true strain as a function of the temperature given strain rate
Table 1 Variation of work hardening rate of Inconel 690 specimens as function of strain, strain rate and temperature.
T (°C)
Strain Rate (s¹1)
Work Hardening Rate (MPa/Unit Strain)
¾=0.04 ¾=0.1 ¾=0.3 ¾=0.5 ¾=0.7
¹150
2000 2698 1725 652 345 ®
4000 2986 2041 970 600 ®
6000 3508 2520 1460 1040 ®
0
2000 2574 1604 542 268 ®
4000 2890 1956 887 520 ®
6000 3253 2329 1290 880 ®
25
2000 2487 1487 466 222 129
4000 2749 1879 806 454 290
6000 3016 2120 1070 680 480
(a)
(b)
(c)
[image:4.595.48.293.94.244.2]ranges of 2©103³4©103s¹1 and 4©103³6©103s¹1, respectively. It is noted that the values of the activation volume are normalised by dividing¯ byb3, whereb is the
Burgers vector and has a value of 2.47©10¹10m for Inconel
690 alloy.10)It is seen that for a constant strain and strain rate
range, the activation volume increases with increasing temperature. However, for a constant temperature, the activation volume decreases with increasing strain and strain rate. The increased activation volume at a higher temperature implies that the stress required to accomplish deformation is reduced due to the assistance of the thermal activation energy. An inspection of the two figures shows that the normalised activation volume is more than unity only for the specimens tested at 0°C and 25°C under strain rates of 2©103s¹1³4©103s¹1 and true strains of less than 0.2 and 0.35, respectively (Fig. 5(a)). This indicates that the deformation of the present Inconel 690 specimens is not dominated by thermal activation, but is in fact determined mainly by enhanced dislocation generation, as reported by Conrad.38,39)
3.3 Temperature sensitivity
Figure 6(a) shows the variation of theflow stress with the deformation temperature as a function of the strain and strain rate. The results show that a significant thermal softening effect occurs as the deformation temperature is increased. In addition, it is seen that the rate of reduction in theflow stress with increasing temperature is particularly apparent in the specimen deformed at the highest strain rate of 6©103s¹1. The temperature sensitivity of the deformed specimens can be quantified as follows:
na¼@·=@T ¼ jð·2·1Þ=ðT2T1Þj; ð8Þ
where the compressive stresses·2and·1are obtained in tests
conducted at temperatures of T2 and T1, respectively.
Figures 6(b) and 6(c) show the variation of the temperature sensitivity with the true strain as a function of the strain rate for temperature ranges of ¹150³0°C and 0³25°C, respec-tively. It is observed that for a given temperature range, the temperature sensitivity increases with increasing strain and strain rate; indicating a deformation-induced heating effect. Moreover, for a constant strain and strain rate, the temper-ature sensitivity increases with increasing tempertemper-ature. For both temperature ranges, the temperature sensitivity increases more rapidly at a strain rate of 6©103s¹1. This is most likely the result of a greater adiabatic heating effect during the dynamic deformation process, and accounts for the fact that specimen failure occurs only at the highest strain rate of 6©103s¹1, as shown in Fig. 3(c).
3.4 Fracture feature observations
Figures 7(a)³7(c) present optical micrographs of the Inconel 690 specimens deformed at a strain rate of 6© 103s¹1 and temperatures of 25°C, 0°C and ¹150°C,
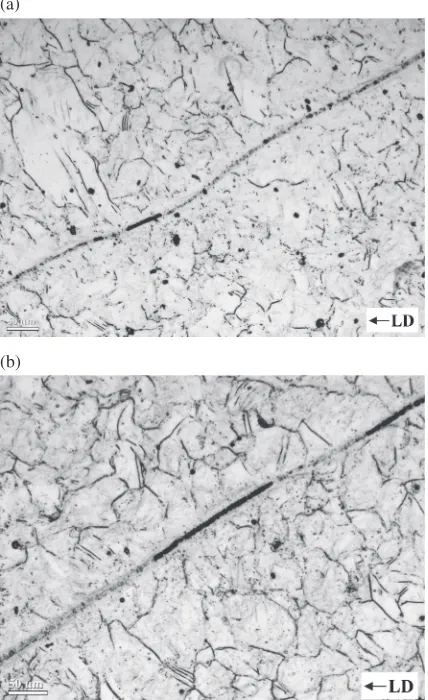
respectively. Note that the loading direction (LD) is perpendicular to the image plane. In all three micrographs, a narrow adiabatic shear band is observed tracing a circular path along the transverse section perpendicular to the impact direction. A close inspection reveals the presence of micro-crack nucleation, growth and coalescence within the shear bands. Figures 8(a) and 8(b) present optical micrographs of the cross-section parallel to the loading direction for speci-mens deformed at a strain rate of 6©103s¹1 and
temper-atures of 25°C and¹150°C, respectively. Bothfigures show the presence of an adiabatic shear band running across the specimen at an angle of 45° to the loading direction. Overall, the images presented in Figs. 7 and 8 suggest that crack initiation and propagation occurs within these adiabatic bands, and leads to the eventual catastrophic failure of the specimens.
Figures 9(a)³9(c) present SEM fractographs of the speci-mens deformed at a strain rate of 6©103s¹1 and temper-atures of 25°C, 0°C and¹150°C, respectively. It is seen that the fracture surfaces contain dimple- and/or cleavage-like features. For the specimen deformed at 25°C, the dimples are evenly distributed over the fracture surface; indicating a ductile failure mode. At a lower deformation temperature of 0°C, the fracture surface contains both dimple structures and cleavage structures. However, the dimples are smaller and fewer in number than those in the specimen deformed at 25°C. For the lowest deformation temperature of ¹150°C, (a)
(b)
[image:5.595.67.270.69.485.2]the fracture surface is comprised almost entirely of cleavage structures. Overall, the fractographs indicate that the Inconel 690 specimens experience a significant loss in ductility at
lower deformation temperatures. Note that this finding is consistent with the flow stress-strain results presented in Fig. 3(c), which show that the fracture strain reduces with reducing temperature.
3.5 Dislocation substructure observations
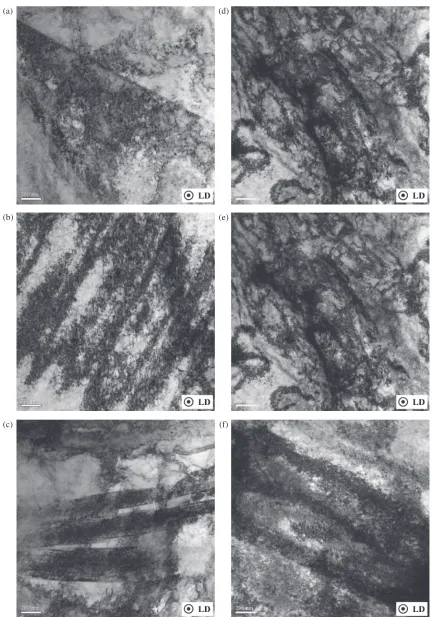
Figures 10(a)³10(c) present TEM images of the Inconel 690 specimens deformed at a strain rate of 2©103s¹1 and
temperatures of 25°C, 0°C and ¹150°C, respectively. Note that the loading direction (LD) is perpendicular to the image plane. It is seen that the microstructure of the specimen (a)
(b)
(c)
Fig. 6 (a) Variation offlow stress with deformation temperature as function of strain and strain rate. Variation of temperature sensitivity with true strain as function of strain rate over temperature ranges of: (b)¹150 to 0°C; and (c) 0 to 25°C.
(a)
(b)
(c)
[image:6.595.65.276.62.687.2] [image:6.595.317.534.75.599.2]deformed at 25°C consists predominantly of cell-like structures with a high dislocation density in the cell wall and a somewhat reduced dislocation density in the cell interior (Fig. 10(a)). It has been reported that dislocation cell structures are readily formed in materials having a stacking fault energy greater than 60 mJ/m2.35)Inconel 690 alloy has a stacking fault energy of 61 mJ/m2,40)and thus the existence
of cell structures in the deformed microstructures is not unexpected. An observation of Fig. 10(b) shows that when the deformation temperature is reduced to 0°C, the dislocation density increases. Furthermore, the dislocation cells are seen to have an elongated structure and an increased degree of dislocation tangling in the walls. At the lowest deformation temperature of¹150°C, both the number of cell structures and the degree of dislocation tangling increase (Fig. 10(c)). Furthermore, the size of the individual dis-location cells decreases. It is inferred that the smaller, denser and more tangled structures at this cryogenic temperature lead to a greater work hardening and strengthening effect. Figures 10(d)³10(f ) present TEM images of the Inconel 690 specimens tested at the highest strain rate of 6©103s¹1. It is
noted that while the temperature-dependent morphologies of the deformed microstructures are similar to those shown in Figs. 10(a)³10(c), the dislocation density and cell size are different. Specifically, the dislocation density at a strain
rate of 6©103s¹1 is higher than that at a strain rate of
2©103s¹1. However, the dislocation cell size at 6©103s¹1
is smaller than that at 2©103s¹1. The increased dislocation density prompts the formation of a tangled dislocation substructure, which reduces the mobility of the dislocations and therefore enhances the resistance of the Inconel 690 alloy to plastic deformation. Thus, as shown in Fig. 3, for a constant true strain, theflow stress increases with increasing strain rate or decreasing temperature.
An observation of Figs. 10(a)³10(f ) shows that the dislocations in the impacted microstructure become tangled under higher strain rates and lower temperatures. As a consequence, the resistance encountered by the moving
(a)
(b)
(c)
Fig. 9 SEM fractographs of Inconel 690 specimens deformed at strain rate of 6©103s¹1and temperatures of: (a) 25°C; (b) 0°C; and (c)¹150°C. (a)
(b)
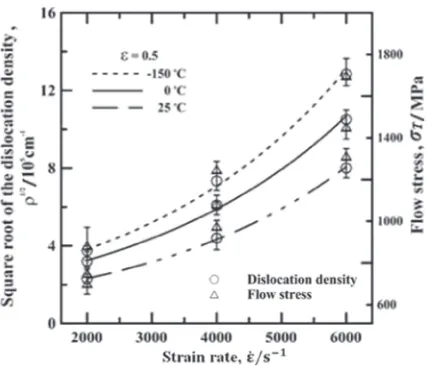
[image:7.595.63.277.74.424.2] [image:7.595.311.540.77.587.2]dislocations increases; leading to an enhanced work harden-ing effect. Figure 11 shows the variation of the square root of the dislocation density with the strain rate as a function of the temperature given a true strain of 0.5. (Note that the
corresponding variation in the flow stress is also shown.) It is seen that the square root of the dislocation density increases with increasing strain rate, but decreases with increasing temperature. Moreover, the rate of increase of the (d)
(e)
(f) (a)
(b)
[image:8.595.82.515.65.682.2](c)
dislocation density is more evident at¹150°C than at 0°C or 25°C. In other words, the work hardening rate of the Inconel 690 specimens increases as the deformation temperature reduces.
4. Conclusions
The impact deformation behaviour and dislocation sub-structure of Inconel 690 alloy have been examined at strain rates of 2©103to 6©103s¹1and temperatures of¹150°C,
0°C and 25°C using a split-Hopkinson pressure bar system. The results have shown that the flow stress increases with increasing strain rate, but decreases with increasing temper-ature. Moreover, the strain rate sensitivity and work hardening rate increase with increasing strain rate and decreasing temperature. The thermal activation volume increases with increasing temperature and decreasing strain rate. Meanwhile, the temperature sensitivity increases with increasing strain rate and increasing temperature. The OM and SEM observations have shown that at the highest strain rate of 6©103s¹1, the Inconel 690 specimens facture at
each of the considered deformation temperatures as a result of adiabatic shear localisation and cracking. In addition, it has been shown that for each considered strain rate, the Inconel 690 specimens become increasingly brittle as the deformation temperature is reduced. The dislocation density increases markedly with increasing strain rate and decreasing temperature, and results in a smaller dislocation cell size. Finally, the enhancement of the flow stress and work hardening response in the present Inconel 690 specimens is directly related to a change in the dislocation density and cell size.
Acknowledgements
The authors gratefully acknowledge the financial support provided to this study by the National Science Council of the Republic of China under Grant No. NSC101-2221-E-006-144.
REFERENCES
1) J. Kai, G. Yu, C. Tsai, M. Liu and S. Yao:Metall. Mater. Trans. A20 (1989) 20572067.
2) C. Leroy, T. Czerwiec, C. Gabet, T. Belmonte and H. Michel: Surf. Coat. Tech.142144(2001) 214247.
3) A. Brighenti:IEEE J. Oceanic Eng.15(1990) 179188.
4) J. B. Calvo and K. Hannemann: Numer. Experim. Fluid Mech. VII NNFM112(2010) 441448.
5) V. Venkatesh and H. J. Rack:Int. J. Fatigue21(1999) 225234.
6) J. M. Boursier, D. Desjardins and F. Vaillant:Corrosion Sci.37(1995) 493508.
7) M. K. Lim, S. D. Oh and Y. Z. Lee:Nucl. Eng. Des.226(2003) 97105.
8) B. Wang, S. H. Zhang, M. Cheng and H. W. Song: J. Mater. Eng. Performance (2013)DOI:10.1007/s11665-013-0520-4.
9) S. Guo, D. Li, H. Pen, Q. Guo and J. Hu:J Nucl. Mater.410(2011) 52 58.
10) W. S. Lee, C. Y. Liu and T. N. Sun:Int. J. Impact Eng.32(2005) 210 223.
11) J. E. Field, S. M. Walley, N. K. Bourne and J. M. Huntley:J. Phys. IV, Colloque C8, supplément au Journal de Physique III,4(1994) C8-3 C8-22.
12) A. Mishra, M. Martin, N. N. Thadhani, B. K. Kad, E. A. Kenik and M. A. Meyers:Acta Mater.56(2008) 27702783.
13) W. S. Lee, C. F. Lin, T. H. Chen and W. Z. Luo:J. Nucl. Mater.420 (2012) 226234.
14) M. A. Meyers, Y. J. Chen, F. D. S. Marguis and D. S. Kim:Metall. Mater. Trans. A26(1995) 24932501.
15) W. S. Lee, C. F. Lin, T. H. Chen, W. Z. Luo and M. C. Yang:Mater. Sci. Eng. A527(2010) 31273137.
16) P. S. Follansbee and U. F. Kocks:Acta Metall.36(1988) 8193.
17) F. J. Zerilli and R. W. Armstrong:Acta Metall. Meter.40(1992) 1803 1808.
18) A. G. Odeshi, S. Al-ameeri, S. Mirfakhraei, F. Yazdani and M. N. Bassim:Theor. Appl. Fract. Mech.45(2006) 1824.
19) W. S. Lee, C. F. Lin, T. H. Chen and W. Z. Luo:J. Nucl. Mater.420 (2012) 226234.
20) V. F. Nesterenko, M. A. Meyers and T. W. Wright: Acta Mater.46 (1998) 327340.
21) D. Peirce, R. J. Asaro and Needieman:Acta Metall.31(1983) 1951 1976.
22) L. Anand and S. R. Kalinidi:Mech. Mater.17(1994) 223243.
23) T. W. Wright:J. Mech. Phys. Solids38(1990) 515530.
24) J. A. DiLellio and W. E. Olmstead:Mech. Mater.29(1998) 7180.
25) F. Zhou, T. W. Wright and K. T. Ramesh:J. Mech. Phys. Solids54 (2006) 904926.
26) D. R. Chichili, K. T. Ramesh and K. J. Hemker:Acta Mater.46(1998) 10251043.
27) H. Jarmakani, J. M. McNaney, B. Kad, D. Orlikowski, J. H. Nguyeu and M. A. Meyers:Mater. Sci. Eng. A463(2007) 249262.
28) W. S. Lee and C. F. Lin:Metall. Mater. Trans. A33(2002) 28012810.
29) B. Zhang and V. P. W. Shim:Acta Mater.58(2010) 68106827.
30) M. Huang, P. E. J. Rivera-Diaz-del-Castillo, O. Bouaziz and S. van der Zwaag:Mech. Mater.41(2009) 982988.
31) B. L. Hansen, I. J. Beyerlein, C. A. Bronkhorst, E. K. Cerreta and D. D. Koller:Int. J. Plasticity44(2013) 129146.
32) W. S. Lee, T. H. Chen and S. C. Huang:J. Nucl. Mater.402(2010) 17.
33) W. S. Lee, T. H. Chen and H. H. Hwang:Metall. Mater. Trans. A39 (2008) 14351448.
34) W. S. Lee, T. H. Chen, C. F. Lin and W. Z. Luo:Metall. Mater. Trans. A 43(2012) 39984005.
35) L. E. Murr: International Conference on Metallurgical Effects of High StrainRate Deformation and Fabrication, ed. by M. A. Meyers and L. E. Murr, (Plenum Press, New York, 1981) pp. 607613.
36) Y. Tomota, P. Lukas, S. Harjo, J. H. Park, N. Tsuchida and D. Neov:
Acta Mater.51(2003) 819830.
37) H. Kolsky:Proc. Phys. Soc. B62(1949) 676700.
38) H. Conrad and H. Wiedersich:Acta Metall.8(1960) 128130.
39) L. Shi and D. O. Northwood:Acta Metall. Mater.43(1995) 453460.
[image:9.595.63.277.68.251.2]40) J. Unfried-Silgado, L. Wu, F. F. Ferreira, C. M. Garzon and A. J. Ramirez:Mater. Sci. Eng. A558(2012) 7075.