Workload Alerts - Using Physiological Measures of Mental
Workload to Provide Feedback during Tasks.
HORIA A. MAIOR,University of Nottingham
MAX L. WILSON,University of Nottingham
SARAH SHARPLES,University of Nottingham
Feedback is valuable for allowing us to improve on tasks. While retrospective feedback can help us improve for next time, feedback “in action” can allow us to improve the outcome of on-going tasks. In this paper, we use data from functional Near InfraRed Spectroscopy to provide participants with feedback about their Mental Workload levelsduringhigh-workload tasks. We evaluate the impact of this feedback on task performance and perceived task performance, in comparison to industry standard mid-task self assessments, and explore participants’ perceptions of this feedback. In line with previous work, we confirm that deploying self-reporting methods affect both perceived and actual performance. Conversely, we conclude that our objective concurrent feedback correlated more closely with task demand, supported reflection in action, and did not negatively affect performance. Future work, however, should focus on thedesignof this feedback and the potential behaviour changes that will result.
ACM Reference format:
Horia A. Maior, Max L. Wilson, and Sarah Sharples. 2018. Workload Alerts - Using Physiological Measures of Mental Workload to Provide Feedback during Tasks..ACM Trans. Comput.-Hum. Interact.1, 1, Article 1 (January 2018),30pages.
https://doi.org/10.1145/3173380
1 INTRODUCTION
Although computers are very good at performing repetitive rule-based tasks, humans can excel at ‘knowledge-based’ tasks that involve decision-making processes, generating new solutions for rapidly changing problems, and developing solutions based on past experience and innovation. Consequently, as technology pervades our everyday life, our own tasks are increasingly“dominated by mental rather than physical task components”[49]; the human role has moved towards a supervisory and decision making role for such intelligent systems. This move has the potential to increase the demands on people’s mental resources due to the amounts of data being generated and the amount of concurrent tasks and decisions we take every day. Sharples and Megaw [2015] describe Mental Workload as
“the relationship between primary task performance and the resources demanded by the primary task”, identifying operator overload as a root cause of reduced performance - humans have a limited capacity when it comes to the number of things they can manage at any one moment. Assessing, predicting, and managing peaks of Mental Workload, therefore, can become particularly important, especially in the context of safety-critical domain such as Air Traffic Control.
In HCI, we are concerned with understanding users’ capabilities and limitations in terms of their mental workload, in order to assess the demands placed upon them whilst interacting with
Permission to make digital or hard copies of part or all of this work for personal or classroom use is granted without fee provided that copies are not made or distributed for profit or commercial advantage and that copies bear this notice and the full citation on the first page. Copyrights for third-party components of this work must be honored. For all other uses, contact the owner/author(s).
© 2018 Copyright held by the owner/author(s). 1073-0516/2018/1-ART1
computer-based systems. While some work focuses onadapting the taskthat users need to perform [1,64], this work focuses on making participants more aware of their workload so that they can better manage e.g. non-adaptable tasks. An individual’s awareness of workload, therefore, would potentially allow them to regulate their resource allocation to the primary task, therefore avoiding risky high (and significantly low) workload conditions as described above.
There are a variety of subjective and objective methods used for measuring mental workload, including primary and secondary task analysis [40], physiological or psycho-physiological techniques [24,33,44,52], as well as user opinions using subjective techniques [23,31]. The most commonly used method for mid-task workload monitoring in industry, as a form of secondary task analysis, is ISA (Instantaneous Self Assessment) and relies on people self reporting their levels of workload at time intervals. Self reporting in this way is used successfully, but has also been shown to either increase workload or negatively affect task performance itself [55]. In this paper, we evaluate the use of functional Near Infra-Red Spectroscopy (fNIRS) data to give people feedback of their current Mental Workload levels during tasks, as a form of unobtrusive objective feedback, in comparison to ISA as an intrusive subjective self assessment. Such objective measures have become more realistic in natural task conditions, as fNIRS, unlike other brain sensing techniques, is a) particularly resilient to artefacts associated with natural computer usage and b) sensitive to changes in Mental Workload [44,52]. Further, by presenting feedback about current Mental Workload levels, we also explore initial insights into how participants monitor their own performance, and respond to the feedback.
In the following sections, we first review related work on working memory, mental workload, the methods used to measure workload, meta-cognition and feedback. We then present the workload feedback mechanism developed and the methods used to assess workload during tasks. The paper continues by describing a study comparing the impact of workload feedback to a traditional method of asking users to self-assess and report their own mental workload. We then present the results of the study, discuss the findings in terms of what we can learn about feedback of workload in general, and recommendations for further exploring thedesignof feedback and potential user behaviour changes.
2 RELATED WORK
This section presents four key areas of related work: 1) Mental Workload literature, 2) techniques for measuring workload, 3) measuring workload with Brain Sensors, including fNIRS, and 4) key literature on reflection and meta-cognition.
2.1 The concept of Mental Workload
In order to discuss and better understand Mental Workload, we review a) literature that underlies the concept, and b) how it relates to task demand and performance.
2.1.1 Background literature on Mental Workload.At its origins, Mental Workload is grounded in Baddeley’s well established model of Working Memory [7], which includes a Central Execu-tive process that manages the use of three ‘slave’ systems: 1) a visuo-spatial sketch pad holding information in an analogue spatial form (e.g. colours, shapes, maps, etc.), 2) a phonological loop holding verbal information in an acoustical form (e.g. numbers, words, etc.), and 3) an episodic buffer dedicated to linking verbal and spatial information in chronological order [6].“The concept of working memory proposes that a dedicated system maintains and stores information in the short term, and that this system underlies human thought processes.”(A. Baddeley [2003]). These concepts are well established, and appear in similar models by Welford [1968] and Whiting [1969], both models reflecting the same process, however, using slightly different terminology.
time. The Limited Resource Model (LRM), more recently summarised by Sharples & Megaw [2015], highlights the impact of the limited resources on experienced workload and performance. The authors present the concept of Mental Workload as the relationship between a) the resources allocated to the primary task, b) the resources demanded by the primary task, and c) how performance is “affected” at different stages of demand. Workload, therefore, is a concept that refers to the amount of resources and necessary “effort” required by all the processes mentioned above in relation to the demands of a task. Similar notions of limited capacity for a task are also noted by Cognitive Load Theory [41], as a similar concept developed in the context of educational learning materials. Based on this principle, work in HCI has considered adaptive technologies that try to dynamically match the demand of a task with the users current Mental Workload. Yuksel et al [2016], for example, increased the difficulty of piano music as the participants needed less mental effort to play their current piece.
Although the LRM captures the limitations of our combined mental resources, one limitation is that it does not capture the different subsystems of Baddeley’s view of WM. Wickens proposed, therefore, the Multiple Resource Model (MRM) [61], which highlights that verbal and spatial modalities are handled separately at all stages, from perception, to processing (in WM), and during response. In principle, this means that two tasks that utilise different resources (one visual and one verbal) would utilise separate resources and thus mask or confound the experiences of underload and overload. Again, this similar concern is present in the design of learning materials in Cognitive Load Theory [41]. In the MRM, however, the complex interaction described between stages means that any study of workload has to be considerate of which resources are being demanded. In related HCI work, Maior et al showed that different physical artefacts affect spatial and verbal Mental Workloads differently [39]. In this study, we are focusing on a purely spatial task, but the inclusion of self-reporting workload with the ISA scale (described later) might be considered a verbal task. We discuss this complex interaction later in the paper.
[image:3.486.68.420.432.589.2]2.1.2 Mental Workload, Task Demands, and Performance.To better understand the implica-tions for evaluating Mental Workload, in relation to the study presented in this paper, we use the framework in Figure1[49] to formalise the concept and set our hypotheses.
Fig. 1. A Framework for mental workload definition and evaluation [49]
the work demands the participant faces.As the demands may have different impact on different individuals, it is important to not only capture the externally imposed demands, but also consider measuring the perceived demand.
Operator workloadis “equivalent to measures of operator strain or effort”. A lot of the workload measurement techniques, therefore, simply focus on capturing the operator experience during and after the task via subjective questionnaires like NASA TLX [23], but measures of effort from behaviour indices and the impact of effort on operators’ physiology should also be measured.
Performancerefers to the measures often described in terms of speed and error rates. However, performance measures can become problematic as task complexity increases, but also when closely analysing the relationship between the three mental workload components of demand, workload and performance;“contrary to what is expected, as task demands increase it is not compulsory to expect an increase in operator workload, or decrease in task performance”.
External and internal influencesrelates to other factors that can affect workload, such as secondary tasks or interruptions. It is these external influences that we must consider when we change people’s environments during tasks or ask them to perform self assessments as a secondary task.
Sharples and Megaw also identify the five key relationships between these components (numbered in Figure1):
(1) Operator workload is influenced by how the task is perceived by the operator, and it is not just a simple relationship between demand and workload. It can be seen as a consequence of demand created by not only the task demands, but also by a combination of external and internal influences [43]. Pickup et. al. presents workload being influenced by intrinsic factors such as operator skill and amount of training and attitude towards a task. Therefore, these intrinsic factors can influence the strategies the operator can take towards performing a task and the workload perceived by the operator, and indicate that measures of operator workload will not necessarily reflect an objective measure of task demand. In this study, we will investigate the factors that influence operator workload during tasks, by combining objective and subjective measures of workload in contrast with measures of task demands.
(2) Although there is an expected relationship between operator workload and performance, with higher workload associated with relatively poorer performance, this is not always the case. Sharples and Megaw discuss that even with a highly sensitive performance measure, it is likely to be difficult to determine differences in how hard an individual is working to maintain a good level of performance. User performance will be monitored during this study, and insights into the relationship between workload and performance will be presented.
(3) Feedback, both unconscious and explicit, allows operators to monitor their own performance. This may change the way they perceive a task, but also their decision making, strategy and attitudes towards a task. Additional to the performance, this study is focused on understanding the impact of workload feedback on operators, therefore feedback is further discussed later in the section.
(4) Performance outcomes may impact task demands. An error that may have occurred due to high demands on the operator, can lead to subsequent task demands to increase, this further increasing the demands placed upon the operator. On the other hand, a good performance may lead to lower demands to the subsequent tasks.
2.2 Measuring Workload
Measuring mental workload has been a long-term research challenge, and multiple attempts from different authors have been made to establish the appropriate criteria for it. In this section, we discuss various empirical measures, which can be divided into primary and secondary measures, subjective and psycho-physiological techniques.
2.2.1 Primary and secondary task measures. Primary task measures of workload rely on evaluating the performance of the primary task to estimate changes in operator workload. They have limitations, however, when being used alone: it is difficult to discriminate between levels of effort the operator is going trough while the demand changes and performance does not. Consequently, primary task measures should be combined with other workload measures. Secondary task techniques involve the inclusion of an additional task to the primary one, where allocating more resources to the primary task might maintain performance, but reduce their capacity to handle a second task. Gwizdka, for example, used the Stroop test as a secondary task analysis to measure spare cognitive capacity [21]. These secondary measures are used, therefore, in cases where the primary task demands would allow enough available resources for a secondary task to be completed concurrently.
2.2.2 Subjective Measures of Mental Workload. Subjective measures of mental workload attempt to capture users’ reflection and perspective on how much effort was expelled in completing the task. They are currently the most popularly used and accepted techniques due to their nature of being easy to administer, cheap, and with high face validity. NASA-TLX (Task Load Index), developed by Hart and Staveland [1988], is an example of a widely used subjective measure of workload. NASA-TLX is a multi-dimensional tool that uses perceived workload ratings in order to assess a task after performing it [37,44,46]. This makes the measure suitable for providing an overview of the task retrospectively, however it does not provide insight into users workload at a given moment during the task.
Concurrent alternatives to NASA TLX exist, including ISA (Instantaneous Self Assessment), developed by Jordan and Brennen [1992] and have been validated as being a reliable workload measure [35,55]. ISA was derived for use within Air Traffic Control settings, and it is one of the most frequently used techniques for workload assessment in real-time simulations. ISA measures mental workload using a single five-point unidimensional rating scale, to provide immediate subjective ratings of work demands during the performance of primary work tasks. Users are prompted at regular time intervals during the primary task to rate their current workload levels, where performance in providing ISA ratings can be utilised as a secondary task measure. Naturally, however, any concurrent self report measure can directly interfere with the performance of the primary task, especially when the operators are highly engaged in the primary task due to high task demands. There are conflicting findings in existing literature: there are cases of detectable [55] and non-detectable [35] task intrusions. Regardless, however, the measure has been considered preferable to other measures, such as Subjective Workload Assessment Technique (SWAT) [47], and Workload profile [56], as it requires less mental effort and time from the operator due to its unidimensional nature.
example, as the cognitive demands on the operator increase, and the rate of eye blinking decreases as the visual demands increases. Mental Workload changes, in particular, have been obtained by recording: cardiac activity [10,22,62], electrodermal response (EDR) and galvanic skin response (GSR) [14,50], eye function (pupil diameter) [9,32], imaging the brain [8,52], and even facial skin temperature [53]. As Mental Workload is a concept, each of these techniques essentially detect the changes in the autonomic nervous systems, which are then used to infer workload levels. Most related to this paper, are physiological measures that focus directly on the brain. There are several key approaches to measuring Mental Workload with brain sensors, including MRI, EEG, and more recently fNIRS. Experiments that have used Magnetic Resonance Imaging (MRI) in a study typically place a mirror above the participant such that they can see a display in another room. Li et. al [2013] for example, used real time fMRI to control the animation speed of a virtual human runner. Normal direct computer use, however, is not practical in an fMRI scanner due to the large magnetic field and requirement that participants remain still, lying down inside it. Electroencephalography (EEG) typically uses between 16 and 64 sensors on the scalp to detect varying electrical charge within the brain. With the introduction of commercially available bluetooth EEG sensors, like the Emotiv1, EEG has become an affordable option for brain sensing [17]. Frey et al [2013] presents a review of the technology for the detection of workload, attention, vigilance, fatigue, error recognition, emotions, engagement, flow and immersion as being recognizable by EEG. In a different study, Frey et al [2016] presents a framework for mental workload assessment in the context of HCI and User Experience. For measurement of Mental Workload, however, EEG data is highly susceptible to motion artefacts, and so formal laboratory studies typically restrict movement.
fNIRS- Functional Near Infrared Spectroscopy - uses blood oxygenation, rather than electrical levels, for determining the activation of areas in the brain, where more blood flow indicates higher activity. Recent research has shown that fNIRS’ related measurements of cortical oxygenation are less affected by body movement compared to techniques that measure the electrical activity of the brain (such as EEG). The reason EEG is more affected from motion artefacts is because of the dominant muscle activity related noise. Therefore, fNIRS could be a more appropriate brain sensing technology for measuring Mental Workload in HCI [25,34,39,42]. Because it takes several seconds for blood to flow to the brain [27,58], fNIRS has been largely discounted for real-time interaction with systems [54]. However the lightweight nature of the professional fNIRS scanners, described below, and its resilience to movement artefacts has made it popular for evaluation of Mental Workload in more ecologically valid contexts. Pike et al. presented a more detailed comparison of brain sensing technologies, with a focus on their suitability for measuring Mental Workload in HCI settings [44].
2.3 Using fNIRS to measure Mental Workload in HCI
fNIRS is based on the use of near infrared spectroscopy (NIRS), introduced by F.F. Jobsis in 1977 [30], which started to be used later for functional brain imaging [13,57,58]. fNIRS uses near infrared (NIR) light to measure regional hemodynamic responses associated with neuron behaviour, namely changes in blood volume and cortical oxygenation. This is possible due to the properties of our biological tissue, in our case the skull, that is relatively permeable to electromagnetic (EM) radiation of different frequencies and intensities. Light penetrates the skull well at near infrared range, allowing the NIR light to reach different molecules that are known to absorb different wavelengths of EM radiation to different degrees (in this case light). For fNIRS imaging, the concerned molecule is haemoglobin, which is the oxygen carrier for the red blood cells.
fNIRS has been successfully used to measure brain activity in different brain regions such as, prefrontal cortex [5], motor cortex [26] and auditory cortex [45]. In relation to Mental Workload,
much research demonstrates that fNIRS can be used to reflect the demands placed upon individuals whilst performing a task by observing the relative changed in oxygen concentration in the PFC. fNIRS has been used in various tasks, including remotely operating vehicles [5,16], mental arithmetic [44], n-back tasks [5,16], and other complex cognition tasks such as video games [5,11,28].
HCI researchers are typically concerned with using fNIRS to assess workload, although some research, for example, has used fNIRS to measure anger by detecting frontal asymmetry in the PFC [2]. Measuring Mental Workload with fNIRS, however, can then be used as an additional channel of information about users during interaction with technology. Recent research has proven fNIRS to be more suitable (compared to other brain sensing techniques) for assessing workload in HCI user studies [1,39,52,63] due to the robustness in noisy environments. Lukanov et al [2016] used fNIRS to assess workload during usability testing of three versions of an insurance claim form. fNIRS has also been used for implicit input. Afergan et al [2014] used fNIRS as implicit input to control and dynamically adjust task difficulty based on user’s mental state. Yuksel et al [2016] used the same technology for adapting learning during piano lessons. In this work, rather than designing a technology that adapts the task demands given to the user, we investigate how fNIRS can be used to provide users with feedback of their mental workload during tasks, such that they can better manage their workload.
2.4 Feedback and Reflection
Feedback allows us to review, reflect, and improve our performance, and in this study, we provide people with mid-task Feedback about something that is typically hidden from observation: Mental Workload. As our study is not focused on the design of Feedback itself, but in studying how Feedback on Mental Workload affects actual and perceived performance, we present some core literature in this area to provide a context for reading. Starting from knowledge, Schon et al [1983] presents the following properties of “knowing”:
• There are actions, recognitions and judgements which we do not have to think about during or prior their performance. So knowing, we will carry these out spontaneously.
• We are often not aware of learning new things, “we simply find ourselves doing them”. • Whether we are/were aware or not of the understandings for certain actions, we are usually
unable to describe the knowing which our action reveals.
To explain reflection, Schon then discusses the “feeling” when doing something right or wrong. When one notices doing something good, that let him/her repeat the exact thing that he/she did before that proved successful, one would have a “feeling” that would allow him/her to do that something again. Schon describes that “studying the winning habits”, makes us think about the “know-how” that enabled us to win. This process of understanding and thinking about various patterns of actions, while we perform various tasks or after, can be referred to as reflecting on action and, in some cases,
reflecting in action.
“Reflecting-in-action. If common sense recognizes knowing-in-action, it also recognizes that we sometimes think about what we are doing. Phrases like ‘thinking on your feet’, ‘keeping your wits about you,’ and ‘learning by doing’ suggest not only that we can think about doing but that we can
think about doing something while doing it. Some of the most interesting examples of this process occur in the midst of a performance”.[48]
performance, task cues and other states in order to assess their workload throughout the task and ‘act’ accordingly. One consideration of subjective measures is that rating your own mental workload will also make you aware of this information, potentially having an impact on your meta-cognitive state. The interest of this paper in meta-cognition, is the potential for supporting such acts by presenting mental workload feedback, but in a way that does not require task interruption the same way subjective rating tools do.
3 WORKLOAD FEEDBACK SYSTEM, USING FNIRS
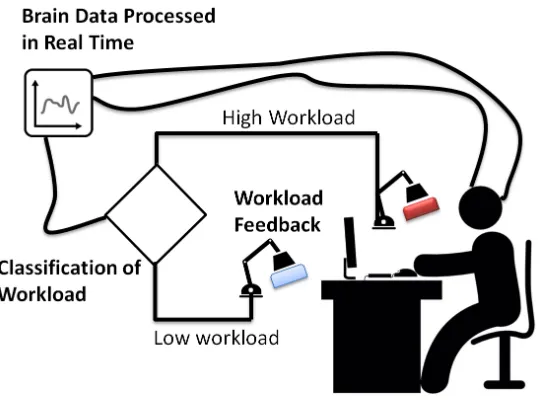
While Brain-Computer Interfaces (BCIs) were traditionally focused on users with disabilities, pro-viding them direct control or interface with the outside world, current advances investigate the use of brain as an additional channel of information about healthy users interacting with technology. This “passive” rather than “active” channel, sometimes called implicit [51], can act as a complementary source of information about users’ state, that can be combined with traditional methods, or used as an input to system, task, or interface. In this section, we present a Workload Feedback System (WFS - see Figure2) that uses passive BCI to 1) measure, 2) detect, and 3) feedback users’ workload during
[image:8.486.109.379.294.498.2]tasks.
Fig. 2. Mental Workload feedback mechanism
3.1 Monitoring Mental Workload using fNIRS
[29]. The tissue is radiated by the light sources and the detectors receive the light after the interaction with the tissue.
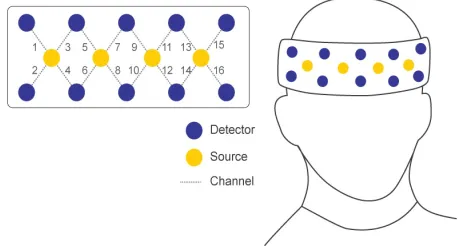
Fig. 3. Sensor layout for the Biopac fNIRS used.
For real time use, COBI Studio requires collecting baseline signal levels that are used in order to calculate oxygenation in real time, via the Modified Beer Lambert Law (MBLL) [57]. The resulting data was used as an input for the WFS detection.
3.2 Detection of state
As our fNIRS device provides 16 locational channels of data with two readings per second, an important step before the study could began was identifying localised Hb/HbO changes for each participant. There are three reasons for this step: 1) fNIRS data is highly sensitive to individual differences between participants, 2) the physical placement of the 16 channels varies between participants (based on the shape and size of the forehead), and 3) different forms of workload create changes in Hb/HbO in different regions of the forehead [39]. We used training tasks to identify the most sensitive region, and identified the most valuable channel for the WFS system to focus on; the post-task evaluation, however, utilised recordings from all 16 channels.
3.2.1 Configuration task.With workload having so many different aspects related to the operator performing a specific task, instead of using e.g. N-Back tasks that are well known for eliciting increased levels of workload, we used variations of a task intended to be more representative of the complexity of a real world task, with manipulations corresponding to increased variation of difficulty. This way, we observed the responses associated with increased demand to our actual task for all the 16 channels and two measures (Hb and HbO). The study task, described further below, consisted of an Air Traffic Control game, where participants had to coordinate the landing and departure of aeroplanes. The calibration phase, therefore, included a 30 seconds resting state of relaxing and not performing the task, followed by two 30 second variations of increased demands: low-normal load (3-5 aeroplanes to control), and normal-high load (>7 aeroplanes to control). Averages of HbO and Hb values were used to calculate range thresholds for the three periods (rest, low, and high), that were used later on in detecting significant increases and decreases of workload.
channel) by comparing each new real-time value with the rolling average. A high workload state would be detected if HbO/Hb increase/decrease value was higher than the threshold set during the calibration stage. A low workload state would be detected in the opposite conditions.
3.3 Feedback choice
Once the participant state was detected, the WFS produces a binary integer that can be used for changing the state of a feedback mechanim. For the purpose of this study, we specifically designed feedback to be noticeable, but at the same time transparent and in the background of the task, such that a minimum of resources would be used by operators. For our study, the output of the WFS was used to invoke changes in the desk lighting around the participant, using Philips Hue Bulbs (programmable light bulbs) in desk lamps. Initially, the lighting was set as normal white lighting, which would turn red when participants entered states detected by the fNIRS measurements to have High Workload and return to white as participants returned to lower levels of Mental Workload. We discuss this colour choice further, however, in the study methodology below.
4 EXPERIMENT DESIGN
As stated above, our aim was to investigate whether providing people with real-time feedback on their mental workload, now that we can objectively and reliably measure it with fNIRS, could facilitate a form of Reflection-in-Action during tasks: that participants, in knowing their Mental Workload levels, can take action to manage their task or workload. Sharples & Megaw [2015], said “Operator workload or effort is not simply a function of task demands, but is influenced by how the task is perceived by the operator...”. In this case, we are making the Operator Workload explicit in the model, and examining the impact on both performance, and the demands of the task. Our primary aim, therefore, was to evaluate the effectiveness of using the Workload Feedback System (WFS) to aid an individual’s self awareness of current workload, such that they could a) be more aware of their mental workload, and b) achieve good performance outcomes. As a secondary aim, we wanted to examine these outcomes against one of the widely used techniques for keeping people aware of their workload during tasks: Instantaneous Self Assessments (ISAs); ISA, described further below, requires people to self-report their workload at intervals in order to keep them self-aware of it.
4.1 Study Conditions
Based on the aims of the study, our two primary independent variables were: 1) the use, or not, of the WFS and 2) the use, or not, of ISA reporting. This created four within-subject repeated-measure conditions, as shown in Table1. Initially, however, we designed the WFS lights to turn red (from normal white) when participants were experiencing high workload. However, midway during the study we noted that multiple participants reported in interviews that the red colour acted as a stressor to their experience. We decided to identify the participants thus far asPhase 1, and introduced a 3rd between-subjects independent variable to create aPhase 2with the colours reversed: turning white from red when participants experience high workload. In both lighting phases, the lights returned to their base colour when workload reduced, and thus could change back and forth multiple times during each task. We include the colour-based independent variable in the results, and examine the implications of colour choice in the discussion.
4.2 Air Traffic Control (ATC) Task
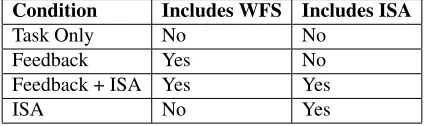
Table 1. Four main conditions in the study
Condition Includes WFS Includes ISA
Task Only No No
Feedback Yes No
Feedback + ISA Yes Yes
ISA No Yes
available Airport Madness 4 Game2, shown in Figure4, in all task conditions. Participants had to coordinate the landing and departing of as many aeroplanes as possible, without causing incidents (e.g. collision between aeroplanes); the number of aeroplanes increased over time, thus increasing the demand as the task progressed. Planes are managed by clicking on the desired plane icon and selecting an appropriate action - ‘Land at runway X’, ‘Go Around’, ‘Increase/Decrease speed’, ‘change direction’. Similar options existed for planes requiring take off e.g. ‘line up’, ‘immediate take off’. These controls allowed participants to use various strategies to reduce their mental workload during moments of high demands by e.g. sending aeroplanes around, managing all landings on one lane and departures on other. The task interface also presented participants with direct measures of performance (seen in Figure4), such as the number of landed/departed aeroplanes.
4.3 Participants and Study Protocol
A total of 32 participants were recruited to take part in the experiment. Fifteen participants (9 male, 6 female) with an average age of 25.3 (SD = 2.31) experienced the white-to-red lighting in Phase 1, and seventeen (9 male, 8 female) with an average age of 25.5 (SD = 8.05) experienced the red-to-white lighting in Phase 2. All participants had normal or corrected vision and reported no history of head trauma or brain damage. Participants were given a £10 voucher as a thank you and remuneration for their contribution to the project. The study protocol below was approved by the School of Computer Science ethics committee.
After gaining informed consent, participants began with a task familiarisation tutorial. All partici-pants watched the same recorded video that introduced all the interactions with the video, and then were given the opportunity to practice the task until they felt confident in the game play; participants determined the time when they were ready to begin the experiment. The WFS was then calibrated for each participant, as described in Section 3.
Participants completed each of the four study conditions, which were counterbalanced using Latin-square design to account for learning effects. In each condition, they were required to perform the study task from scratch for a period of seven minutes. If they were to cause more than three major incidents within a condition, the game would automatically stop and the study condition would end (this however was not common). Seven minutes was enough to see numerous workload changes in the lights, but keep the full length of participation, including training, calibration, four tasks and between-task rest periods, to approximately one hour. After each condition, participants filled in a questionnaire to record perceived performance, before moving onto the next condition. After all four conditions, the study finished with a short interview, where participants had the chance to discuss the study experience and the way they perceived the WFS.
2More information about the study task and a free trial version of the game can be found here:https://www.bigfatsimulations.
Fig. 4. Airport Madness 4 - Screenshot of participant managing the landing of an aeroplane.
4.4 Measures of Dependent Variables
We collected three forms of data from each condition in the study: fNIRS data, ISA data, and Performance Data. We also recorded debriefing interviews to gain insights into participants responses to the conditions that were not otherwise observable in data.
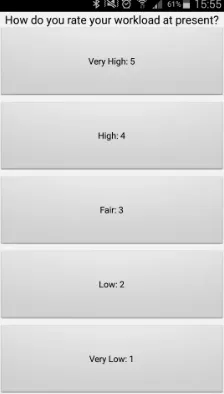
4.4.2 ISA data.During ISA conditions, participants had to respond to the 5-point rating scale on a mobile device (Figure5) every 30 seconds, prompted by an audible notification; 1 means very low and 5 very high experienced workload. Although the question ‘how do you rate your workload at present?’ had a small font on the device, all participants were instructed and familiar with the tool, and had the chance to play with the mobile app before the start of the experiment. The ISA scores were recorded, as was time-to-respond to the prompt. It is common for secondary task performance, as with reporting ISA scores, to drop during periods of extremely high workload. If participants did not respond to the ISA prompt during a 30 second period, the score was recorded as a 5 (high workload); time-to-respond was calculated from the most recent prompt.
Fig. 5. Instantaneous Self Assessment (ISA) Recorder App
4.4.3 Performance data.The task was screen captured and recorded for subsequent analysis. Actual performance was analysed in two ways: 1) the performance outcomes (number of planes landed, number of take-offs) at the end of each condition, and 2) demand levels at moments during the task either a) at each ISA interval (number of planes in the air and on the ground), or b) demand levels when WFS lighting changed (number of planes in the air and on the ground). Informally, we were also able to examine the actions and timing of actions taken by the user after key events such as plane accidents, WFS changes, and after ISA responses (go around, increase speed, decrease speed, change direction). After each condition,perceived performancescores were collected using a five point rating scale (1 - poor, 5 - excellent performance).
4.5 Study Hypotheses
To better understand the relationship between Feedback, ISA, workload, and performance, we state our hypotheses based on an adapted version of Sharples & Megaw’s Framework for Mental Workload Measurement [2015], where we controlled the External Influences. Essentially, as shown in Figure6, our two primary independent variables are shown as alternatives to the External Influences boxes.
• H1 -Variation in task demand will create measurable differences in Mental Workload.
Fig. 6. Framework for Mental Workload Measurement: the relationship between MWL Feedback, ISA, performance and workload. (Adapted from [49])
levels of workload, we therefore expect that changes in task demands should be observable in both the ISA ratings and the objective measures of workload. We expect ISA ratings (H1i in Figure6) to increase with increased task demand, and fNIRS measures to correlate (H2f), either positively or negatively, with task demand.
• H2 -Participants’ performance will be affected, positively or negatively, when made aware of their mental workload.
Ideally participants may perform better because they are more aware of their workload without having to self-report using ISA, but may also have decreased performance if the feedback affects their ability to focus. We expect a lower performance in the presence of ISA (H2i) because of the activity involved in self-reporting. However, we do not expect a negative impact on performance from the WFS lighting changes (H2f).
• H3 -Participants’ perception of performance will be affected positively or negatively, when made aware of their mental workload.
As operators monitor their own performance, unconsciously or explicitly, having their workload levels presented during tasks should allow operators better reflect on performance. Aside from actual performance, participant’s perception of their performance might be affected as they are made aware of their workload levels - increased workload could create a sense of poorer performance or higher performance for both independent variables (H3i and H3f).
• H4 -Participants’ perception and management of the task demands will be affected, positively or negatively, when made aware of their mental workload.
5 RESULTS
Below, we address each of the four hypotheses in subsections; statistical tests were conducted across both phases to determine whether feedback or ISA conditions had any impact on task performance and workload. Additional between-phase tests were used, when relevant, to examine whether there was an effect created by the tertiary variable of feedback colour (Phase1 vs Phase2).
5.1 H1) Variation in task demand will create measurable differences in Mental Workload
To begin our analysis, we first sought to confirm that our measures of participant mental workload were affected by and related to the task demand. To do this, task demand was quantified as the total number of aeroplanes participant was monitoring every 30 seconds (the frequency at which ISA scores were collected). Below we analyse how both our subjective ratings (ISA) and objective measures (fNIRS) correlate with these task demands over time.
5.1.1 Subjective ratings from ISA.We found strong correlations between demand and ISA measures, with examples shown in Figure7, further showing the hypothesis H1i in Figure6. The average correlation value across all participants, between ISA and demand (measured every 30 seconds) wasr .68 with the maximum value ofr .899p .006 for Participant4 in Phase 2. This correlation was strong for some participants, where P1’s ISA correlation with task demand in Phase 2 during the ISA Condition, for example, wasr .808,p .003, andr .751,p .003 in the Feedback+ISA condition. There were, however, several cases across participants, where ISA did not reflect well its relationship to task demand, such as when participants were either too busy or to focused on the task and thus did not respond to the ISA questions (Figure7a). This range of correlations highlights one of the known limitations of using mid-task self assessment scales, as they rely on operators rating their workload during tasks.
5.1.2 Objective measures from fNIRS.As described in the previous subsection, ISA was not always able to reflect the user’s state (See Figure7aand Figure7c), and mainly because it relies upon users subjectively reporting how theyfeel. For the same conditions and the same participants, Figure 7band Figure7dshow how OXY correlates more objectively with the task demand. The average correlation value across participants, between fNIRS OXY and demand (measured every 30 seconds) wasr .81 with the maximum value ofr .973p .001 for Participant6 in Phase 2. This shows how fNIRS could be used to assess workload without relying on a subjective measure such as ISA.
5.1.3 Summary of H1 Results.Based on these results, we are able reject the null hypothesis and accept H1, as both subjective and objective measures provide evidence that participants’ mental workload was associated with task demand. We conclude, however, that our objective measure (hypothesis H1f in Figure6) was able to provide stronger and more consistent evidence of increased workload than subjective ratings (hypothesis H1i).
5.2 H2) Participants’ performance will be affected, positively or negatively, when made aware of their mental workload
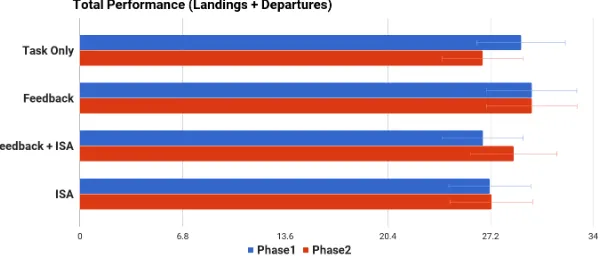
Considering all participants across both phases, a series of two-way repeated measure ANOVAs showed no statistical significance in the three performance measures (Total Departures, Total Land-ings and Total Performance) between the four conditions. Total Performance, shown in Figure8for example, was different between the two phases. Similarly, the number of departures3and landings
3There was one outlier in the Total Departures and the Total Performance data, which had a studentized residual value greater
(a) Participant2: Demand VS ISA (b) Participant2: Demand VS fNIRS-OXY
[image:16.486.52.437.86.437.2](c) Participant6: Demand VS ISA (d) Participant6: Demand VS fNIRS-OXY
Fig. 7. Emphasizing the value and limitations of ISA (when participants fail to self-report values of their workload (a) it becomes hard to understand what happened during the task).
varied between phases, especially during the presence of both Feedback + ISA (see Figure9). Par-ticipants performed slightly worse in Task Only condition in Phase 2 (the mean Total Departures was 10.2 for Phase 1 and 11.13 for Phase 2, and the mean Total Landings was 18.15 for Phase 1 and 17.36 for Phase 2), and slightly better in Feedback+ISA condition in the same study, compared to Phase 1 (the mean Total Departures was 11.1 for Phase 1 and 9.93 for Phase 2, and the mean Total Landings was 16.46 for Phase 1 and 18.43 for Phase 2).
Fig. 8. Total performance difference between Phase 1 and Phase 2 - mean scores across conditions
There was no statistical significance found in the Total Departures with feedback impactF1,12
.055,p .819, and ISA impactF1,12 2.476,p .142 as assessed by a two-way repeated measure ANOVA. There was also no statistically significant two-way interaction either between Feedback and ISA effect,F1,12 .014,p .907. For the Total Landings, the presence of feedback showed no significant impactF1,12 1.147,p .305, however ISA significantly reduced performanceF1,12 5.637,p .035 as assessed by a two-way repeated measure ANOVA. These results indicate that participants who responded to the ISA scale during task performance performed less well on the task, hence, hypothesis H2i in Figure6suggests a negative impact of ISA use on performance. There was no statistically significant two-way interaction between Feedback and ISA effect,F1,12 .014,p
.907. A two way repeated measure ANOVA additionally showed the impact of ISA on the Total Performance measureF1,12 5.368,p .039, and no effect of the presence of feedback was found
F1,12 .675,p .427, nor the two way interaction between the two,F1,12 .007,p .937. From this we conclude that objective feedback provided via the change in lighting colour had no explicit negative impact on performance scores, and thus all the significant differences are caused by the deployment of ISA.
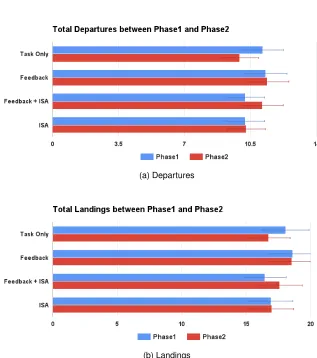
5.2.2 Phase 2 performance data.InPhase 2(red light changed to white in periods of high workload as detected via fNIRS), looking at the red bars in Figure9, the negative effect of ISA was not found to be significant. Instead, the graph suggests a higher average performance during the presence of Feedback, after the colour change via lighting. This may suggest that workload feedback, and hypothesis H2f in Figure6may have a positive impact on performance.
Feedback showed no significant impact on performance with Total DeparturesF1,14 .008,p
.932, Total LandingsF1,13 0.127,p .727, and Total PerformanceF1,13 0.072,p .793. ISA had no longer significant impact on performance, with Total DeparturesF1,14 .229,p .639, Total LandingsF1,13 .011,p .919, and Total PerformanceF1,13 0.064,p .804 There was a statistically significant two-way interaction between ISA and Feedback effect on all performance measures; Total DeparturesF1,14 7.565,p .015, Total LandingsF1,13 6.475,p .024, and Total Performance
F1,13 9.388,p .009. The average performance across participants was lower in the absence of Feedback and ISA, compared to all other conditions as shown in Figure9.
(a) Departures
[image:18.486.76.393.82.440.2](b) Landings
Fig. 9. Performance data across the 2 phases
impacted by ISA - an effect that was exaggerated when also being given feedback by our WFS - but overall we did not see performance being impacted by the WFS alone.
5.3 H3) Participants’ perception of their performance and workload will be affected, positively or negatively, when made aware of their mental workload
5.3.1 Perceived Performance Scores.A five point rating scale was used to capture participants’ subjective perception of performance after each condition. Across both phases, a Friedman test was conducted to understand the within-subjects effects between all levels of the two factors: Feedback and ISA onperceivedperformance scores with Feedback-NoFeedback x ISA-NoISA conditions. Results showed a statistically significant difference between conditions,N 30,X2
Fig. 10. Combined Phase 1 and Phase 2 mean perceived performance scores across conditions
These results show how ISA significantly reduces participants’ perceived performance (hypotheses H2i and H3i), while the presence of feedback has no negative impact (hypotheses H2f and H3f).
For each of the two phases, the subjective performance scale generally showed lower perception of performance during the presence of ISA as showed in Figure11, this being somewhat expected. This is directly related to hypotheses H4i, H2i, and H3i in Figure6. It is interesting to observe how the perception of performance increased during the presence of ISA for Phase 2 compared to Phase 1, this effect being significant in Feedback+ISA condition. This suggests an impact caused by the feedback type. To investigate the within-subjects effects between all levels of the two factors Feedback and ISA onperceivedperformance scores, a Friedman test was conducted with Feedback-NoFeedback x ISA-NoISA conditions for each phase separately.
5.3.2 Phase 1 perceived performance.InPhase 1, the test showed statistically significant difference between conditions,X2 12.756,p .005,d f 3. Pairwise comparisons were performed with a Bonferroni correction for multiple comparisons. This shows that ISA presence significantly impacted the perceived performance scores in the presence of feedbackp .003, but also compared to the baseline conditionp .013. However, the presence vs absence of workload feedback had no impact on the perceived performance indicating that the presence of ISA negatively affected perceived performance. From these results we concluded that, in contrast to feedback and the hypotheses H2f and H3f, ISA and the hypotheses H2i and H3i significantly reduced task performance as well as perceived task performance; this was further significantly exaggerated by objective feedback.
5.3.3 Phase 2 perceived performance. Similar to the performance data, the subjective percep-tion of performance data increased for the Feedback + ISA condipercep-tion inPhase 2(Figure11). The Friedman test revealed no more significance in the perceived performance data between conditions, the presents of ISA having no longer significant impactX2 1.38,p .71,d f 3.
Fig. 11. Mean perceived performance scores across conditions
performance scores between Phase 1 and Phase 2. The test showed statistical significance between the two studies in the presence of both workload feedback and ISA. The distribution of perceived performance scores between Phase 1 and Phase 2 was different as assessed by visual inspection. Mean rank value for Phase 1 was 12.47 (N=15) and for Phase 2 18.53 (N=15). The test showed significant statistical difference in perceived performance scores between the two studies in the Feedback + ISA condition, withN 30,U 158, and Asymptotic Sig. (2-sided test) p 0.05. This finding suggests there was a difference between the feedback type used, with Phase 2 type having higher perceived performance scores.
5.3.5 Summary of H3 Results. We found that the deployment of ISA significantly reduced participants’ perceived performance (hypotheses H2i and H3i), while the presence of feedback had no negative impact (hypotheses H2f and H3f in6). However, as with actual performance, it is interesting to note that the mean ISA score (across participants) revealed higher perceived workload in the presence of our WFS (see Figure11). We again conclude that the impact of deploying ISA was exaggerated by additional demands, since participants’ perception of workload was affected by presence of ISA, but not by WFS alone. Overall, we have enough evidence to reject the null hypothesis and accept H3 for ISA, but not in the case of the WFS.
5.4 H4). Participants’ perception and management of the task demand will be affected, positively or negatively, when made aware of their mental workload
(a) Phase 1 (b) Phase 2
Fig. 12. The impact of different feedback on participants
5.4.1 Impact of Feedback on participants. In Phase 1, 11/15 of participants reported feedback affected them, 3/15 reported feedback did not affect them in any way and just 1/15 was not sure about it (See Figure12a). In Phase 2, only 6/17 reported feedback affected them, 6/17 reported feedback did not affect them, and 4/17 were not sure about it (See Figure12b). This finding suggests that one particular feedback type (Phase 1) had more of an effect on participants, or the case where feedback in Phase 2 was more transparent, hence, not directly affecting participants’ perception. However, it does not reflect the type of effects (negative or positive) the feedback had.
Participants were affected in different ways by the feedback. Some participants described feedback as a good indicator of “how much” is going on during the task; P11 (Phase 1) gave an example of how he/she used the feedback during the task:“helpful in that you knew there was a lot going on and you are concentrating, which meant you had to pay extra attention to the details. When the lights went red, it meant that, yeah, I am probably concentrating a lot, that means I am probably miss some of the smaller aircrafts, and I would try and go back and have a look around to see if I was missing any small planes”. P9 (Phase 1) had similar feelings”They did help me to figure out how I was feeling, and how I was going. Sometimes when it went bright red, I thought to myself, I need to be calm, and think for a second what was going on in the game again. It made me take a second and just relax, that is all”.
In other cases participants felt that feedback was stressing them even more and making them feel anxious: P1 (Phase 1) said“So whenever it went red, it was kind of stressful ... and I felt like why are you showing me red if I am stressed? ... It was NOTICEABLE! So in the sense that if I was doing a thing and I was stressed as I was playing that game, and I was trying to focus on the game, then I am being told that I need to focus more on the game, than that does not really help me, does it?”, and P7 (Phase 1) said“It does not really inform me about my next decision, because I did not stop even when the lights were red. It actually added to the stress. I tried to be calm...”Similar feelings were found in participants’ opinions for Phase 2. P17 (Phase 2) used the feedback to ‘relax’ during stressful moments“I enjoyed the experience and I think the feedback is very... indicative. Though not very specific... But for the person interacting with the system, is like.... oh now I am tensed... maybe I should relax”.
(a) Phase 1 (b) Phase 2
Fig. 13. The impact of ISA on participants perception.
5.4.2 Validity, Accuracy, and Delay.Participants also questioned the validity and correctness of the feedback. There were mixed views on what the feedback was informing, and how it worked. P29 (Phase 2) said“I noticed that when I would get calmed they would change to red. But sometimes I thought that I was working and they would still be red.”, P2 (Phase 1) said“...most of the times it was accurate...”, and P4 (Phase 1) said“I was impressed though, they seemed what was not immediately responsive, but accurate. They seemed to change red when I was under a higher workload. When I was under more stress I said: crap...another plane is coming in, they will crash!”. It did seem to pick up on that quite a lot which was cool”. These comments imply that, despite being able to perceive the delay caused by the hemodynamic response [57], participants found the WFS to be mostly accurate to their current perceived workload.
5.4.3 Granularity and other limitations. One of the limitations identified by participants during the study was the granularity of the WFS feedback; P1 (Phase 1) said“I was a bit annoyed in a way, because the changes were not gradual, it is like uh, it is now white and it is suddenly turning red ekhhhhh (electroshock noises) ... I think if I were to align it with what I felt my workload to be at that point in time, then the colour changes would be much more frequent”, and P13 (Phase 1) also suggested a more transparent modality of communicating the feedback“...they seem to switch from an extreme to another and apart from them being in my eyes and bothering me while I was looking at the screen I didn’t really pay attention to them”. P14 (Phase 1) added to this“If it was in the background more in the background it would have been nicer. Now it was straight in your face”.
impact,“Sometimes I would hear the notification in my subconscious, and I did not pay attention because I was very concentrated on the task”.
Others said they ignored answering the questions when concentrating on the task: P7 (Phase 1) reported“I do not think I paid much of attention of answering the questions. I know I missed some, and for some questions I did not really think about the question, I just answered it”, and similar view was found with P9 (Phase 1)“I forgot about the questionnaire as the task demand went higher. I completely blanked out. I focused on it when I was relaxed. When I got busy it went down my mind. Ignored it sometimes...”. Some participants, however, considered ISA easy and fast, and ISA presence improving their performance in some cases: P8 (Phase 1) reported“...it is very easy it took less than a second, and the buttons were really big. I think it was a normal performance, even better than normal”, and P13 (Phase 1) had similar feelings“just another button I had to press, I do not think it has an impact on my performance”; P21 (Phase 2) described ISA as an“automatic move”.
5.4.5 Summary of H4 Results.This hypothesis was mostly examined through the post-experiment interview and participants’ opinions, since we did not have any objective measurements of how people reflected on the feedback mid-task. It is clear that both ISA and feedback had an impact on participants’ management of the task. Although the opinions were divided, and participants were “af-fected” differently by the feedback and ISA, the findings were very constructive and informative. We found insights to confirm that participants noticed the feedback and considered it at a meta-cognitive level during the task, and therefore have enough evidence to reject the null hypothesis in case of H4. In comparison to ISA, P24 (Phase 2) said“I think the lights are more effective, because the cellphone app (ISA) just made me feel more busy. They lights show me when I am busy, where ISA made me feel busy”. In the discussion section below, we consider what future work may do to investigate this finding in more detail.
6 DISCUSSION
This paper described an alternative way to raise self-awareness of metal workload, through providing workload feedback based upon a concurrent objective measure, and our results showed that it did so without negatively affecting performance (as with ISA). We expected that if users are alerted that they are approaching a drop/dip in performance because of high/low workload, then they might be able to take action to avoid it. Table2summarizes the results of the study that relate to the hypotheses visualised in Figure6.
6.1 Impact of ISA
Table 2. Summary of key findings, by hypothesis
Hypotheses Expected effects Results
H1 Participants’ workload gen-erated by the task demands would have measurable ef-fects with ISA and fNIRS
• We found both fNIRS and ISA measures sensitive to task demands (in our case the number of aeroplanes to control during an ATC game).
• We found high correlation coefficients between fNIRS and demand, and we showed how it can be used to assess workload without relying on participants’ ability to self-report during the task (See Figure7).
H2 & H3 ISA would have a nega-tive impact on performance. Feedback would have no explicit negative impact on performance. Workload and perception of performance would increase or decrease in the presence of both ISA and our WFS.
• We presented evidence supporting ISA’s negative impact on both performance and perceived performance measures. • In contrast to ISA, we found mental
workload feedback having no explicit negative impact.
• Figure11suggests similar or slightly im-proved performance with the WFS and workload feedback.
H4 In contrast to our WFS, ISA will create additional phys-ical and cognitive task de-mands.
• Although we found no direct evidence, the performance and perceived perfor-mance results suggested a negative im-pact in the presence of ISA, most likely due to the additional required resources. This was not the case with our WFS. • During the interview, participants had
mixed feelings about the impact of ISA; views were divided into participants af-fected by ISA, participants who consid-ered ISA having no negative impact (de-scribing it “easy” and “fast”), and partici-pants who ignored ISA when concentrat-ing on the task.
6.2 Impact of Objective Feedback
The aim of our study was to investigate whether presenting users with real time mental workload feedback, would make them aware of their load without notably reducing either actual or perceived performance. This was presented in contrast to ISA measure, which requires the user to reflect upon their mental workload and take action to report it. In our results, feedback did not affect actual and perceived performance in a negative way. Although not significant within our sample, feedback appeared to slightly improve actual performance and participants perceived that they performed slightly better (Feedback Condition - See Figure11). The findings alone, however, do not tell us whether participants noticed the feedback, understood their workload, and took action to reduce them.
In interviews, some participants indicated that they did take note of the feedback:“When the lights become red, it works as a reminder to take a big breath and relax [...] it is like a warning ...”
(P15 Phase1). For some, this was positive, with P14 (Phase 1) saying“I really liked it! The whole experience ... If I would get another chance I would do it again”. Some, however, were frustrated that they couldn’t do much about it:“It is actually affecting me. When the feedback is red, I try to relax. To try to make it white. But it did not work, because I felt even more concentrated ... because I was looking at the planes and to the lights as well, so it added up really to my concentration”(P14). Other participants felt that feedback had no use as they already know when they are busy and when not: P1 (Phase 1) said“I felt like: why are you showing me red if I already know that I am busy?”
even though he said later that“I am usually really bad at judging my own workload”. These insights confirm that participants noticed the feedback and considered it at a meta-cognitive level during the task. For some participants the feedback, however, perhaps increased the sense of anxiety (especially in the first phase), when participants were not able to take action to change it. Because of this, P15 (Phase1) went further to suggest that although the objective measure of their workload was useful, they would have preferred to see it afterwards, rather than during the task:“I would like to add that it would be much more interesting for me to have a feedback to reflect on but not a concurrent one. So maybe record it and reflect on it later on.”. This may be an interesting area of future work, as a mental workload parallel to life-logging and tracking daily fitness activity - a form ofMental Workload Fitnesstracker. Further more participants suggested various levels of feedback would be much more useful“rather than a cut off point ... a gradual transition in a way”(P1 Phase 1).
Overall, the results show strong support for helping people to reflect, in action, on their current workload but without negatively impacting performance or indeed their Mental Workload. We did not, however, manage to observe improved performance, nor changes in behaviour because of the feedback they received. We discuss these more below.
6.3 Future Work
(a) Example 1 (b) Example 2
Fig. 14. Participant Oxygenation Levels measured with fNIRS after a “crash” event
In future work, we would like to more directly evaluate and, associate these reactions to events, whilst still giving people reliable feedback about their mental workload. Such future work may also focus on using other measures of workload, as emotional reactions are typically more observable through other physical reactions. We used an fNIRS device, which has been shown to be suitable for HCI user study evaluations, but more commercially available devices like the NeuroSky4EEG device might be more suitable for day to day feedback. Similarly, even less invasive measures of mental workload could be taken from Heart Rate Variability [24] through smart watches, remotely detected by pupil dilation [33] or facial skin temperature [53] with cameras. Many of these other measures also better detect emotional responses, and perhaps concepts like stress and anxiety, and so might better serve future work on recording both Mental Workload and emotional response.
6.3.2 Designing different feedback types.In general, the binary feedback of workload was alerting users of a high workload when a sudden increase in Oxygenation was measured using fNIRS. In the same way, a sudden decrease would cause a low workload alert after. The changes were visible to participants, such that they could monitor and use their workload feedback presented by the WFS. However, future work could first examine more granular forms of feedback, as noted qualitatively by participants. It was interesting, however, to first informally observe, and then analytically find differences between the choice of lighting feedback in two phases in the study. This post-hoc independent variable in our analysis revealed interesting results that imply that confirm Sharples & Megaw’s [2015] description that workload is closely affected by way in which participants experience that workload. In Phase1, red colour was used for feeding back high workload states, and white colour for low workload states, and in Phase2 the colours were swapped. Having white light to alert of high workload made some participants feel “right” being on the white colour rather than red making them feel they are not working enough; P29 (Phase 2)“...when they were red, I thought I am not working enough. When they were white it felt right, it felt that I was paying a lot of attention, it was in the right track”. On the other side, having colour red to alert of high workload generated pressure when “being” on red, P9 (Phase 1) reported that “When the lights become red, it works as a reminder to take a big breath and relax”. It would be extremely interesting in future work to artificially manipulate changes in feedback, and to observe changes in workload in a similar way to when participants experienced crashes (like in Figure14). Such an analysis would help us to separately examine the impact of mental workload created by feedback and mental workload created
by task demand. Future work should also, therefore, explore the design and mode of feedback, as well as the granularity of feedback.
6.3.3 Studying behaviour change. One large research area is behaviour change, and this study was not designed to measure and observe it. Although this study was not focused on measuring in-task, or future-task behaviour change, qualitative anecdotes, however, imply that people did reflect on their mental workload and consider their current status. It would be highly interesting in future work to more directly study whether or not there are behavioural markers for when participants take action based on their feedback. Such work would need more accommodating task conditions that allow people to manage, delay or even share their workload with others.
7 CONCLUSIONS
In this paper, we considered whether brain sensing techniques, which are increasingly becoming commercially available, could be used to give people concurrent feedback about their Mental Workload levels. Although existing techniques, like the Instantaneous Self Assessment (ISA) tool, are designed to help people to report and reflect on their current Mental Workload levels, they also often have a negative impact on the primary task at hand. We hoped that, with objectively measuring and providing concurrent feedback during tasks, participants would be able to reflect on the mental workload levels, without the associated performance drops. In order to capture and understand these effects, we have adapted the Framework for mental workload evaluation (presented in Figure1). We “controlled” the “external factors” presented in the relationship 5 of the framework (in our case the presence of ISA and the presence of Feedback). Our results first confirmed both approaches to measuring Mental Workload during tasks, accurately correlating the measures with task demands. We then confirmed prior research findings that self-reporting techniques had an impact on both actual and perceived performance, as well as increasing the task demands on the participants. Our results, however, showed no such drops in performance were found with our Mental Workload Feedback System. Using the framework, we confirmed the existing relationships between the physical and cognitive task demands, and the operator workload (see relationship 1 in Figure1), as well as the direct connection between operator workload and performance (see relationship 2 in Figure1). Further, our interviews confirmed that feedback led participants to reflect on their mental workload during tasks, but that the choice of feedback (using red lights to warn them of high Mental Workload) created a negative stressor to their experience. This effect was removed after changing the choice of colour in our feedback mechanism. The results suggested that participants do use the feedback of workload, therefore showing the relevance of relationship 3 in the same framework. Relationship 4 was not directly studied in this paper, however, the future work section presents the authors interest in associating various physiological reactions to events (e.g. such as task failure). We conclude that objectively measured concurrent feedback of Mental Workload can help people to understand and actively manage their behaviour during tasks, but without the negative affects on performance created by self-reporting techniques. Such personal insight would be important for safety critical tasks like Air Traffic Control, but has the potential to more broadly help us to understand and manage our own mental workload across the many tasks that fill our lives. Future work, however, should focus on the design of mental workload feedback mechanisms, to provide people with insight without increasing their workload and stress levels.
ACKNOWLEDGMENTS
![Fig. 1. A Framework for mental workload definition and evaluation [49]](https://thumb-us.123doks.com/thumbv2/123dok_us/8559185.365123/3.486.68.420.432.589/fig-framework-mental-workload-definition-evaluation.webp)