Transcriptome analysis of mRNA
and miRNA in skeletal muscle
indicates an important network
for differential Residual Feed
Intake in pigs
Lu Jing1, Ye Hou1, Hui Wu1, Yuanxin Miao1, Xinyun Li1, Jianhua Cao1, John Michael Brameld2, Tim Parr2 & Shuhong Zhao1
Feed efficiency (FE) can be measured by feed conversion ratio (FCR) or residual feed intake (RFI). In this study, we measured the FE related phenotypes of 236 castrated purebred Yorkshire boars, and selected 10 extreme individuals with high and low RFI for transcriptome analysis. We used RNA-seq analyses to determine the differential expression of genes and miRNAs in skeletal muscle. There were 99 differentially expressed genes identified (q ≤ 0.05). The down-regulated genes were mainly involved in mitochondrial energy metabolism, including FABP3, RCAN, PPARGC1 (PGC-1A), HK2 and PRKAG2. The up-regulated genes were mainly involved in skeletal muscle differentiation and
proliferation, including IGF2, PDE7A, CEBPD, PIK3R1 and MYH6. Moreover, 15 differentially expressed miRNAs (|log2FC| ≥ 1, total reads count ≥ 20, p ≤ 0.05) were identified. Among them, 136, 30e-5p, 1, 208b, 199a, 101 and 29c were up-regulated, while 215, miR-365-5p, miR-486, miR-1271, miR-145, miR-99b, miR-191 and miR-10b were down-regulated in low RFI pigs. We conclude that decreasing mitochondrial energy metabolism, possibly through AMPK
- PGC-1A pathways, and increasing muscle growth, through IGF-1/2 and TGF-β signaling pathways,
are potential strategies for the improvement of FE in pigs (and possibly other livestock). This study provides new insights into the molecular mechanisms that determine RFI and FE in pigs.
Feed accounts for more than 60% of the costs for pig production, therefore improving feed efficiency (FE) is one of the major ways to reduce costs in the pig industry. FE can be measured as feed conversion ratio (FCR) or residual feed intake (RFI)1. FCR is the feed intake divided by the weight gained during a specified period. RFI is defined as the difference between the actual and the predicted dry matter (DM) intakes of each animal, based on its metabolic body weight and average weight gain during a specified period2. Thus, animals with higher RFI/FCR are less efficient at converting feed into body mass, whereas those with lower RFI/FCR are more efficient. Previous studies indicated that the heritability of RFI is 0.14–0.40 and FCR is 0.13–0.313–5, and a strong correlation exists between them (R equals 0.76–0.99)3.
With microsatellite typing based QTL mapping, Zhang and his colleagues identified three genomic regions on SSC2, SSC7 and SSC9 in a White Duroc × Chinese Erhualian F2 segregated population6, associated with the feed consumption and feeding behavior traits, average daily feed intake (ADFI), feed conversion ratio (FCR), number of visits to the feeder per day (NVD) and average feeding rate (AFR).
1Key Lab of Agricultural Animal Genetics and Breeding, Ministry of Education, College of Animal Science and
Veterinary Medicine, Huazhong Agricultural University, Wuhan, 430070, P. R. China. 2Division of Nutritional
Sciences, University of Nottingham, School of Biosciences, Loughborough, Leics. LE12 5RD, United Kingdom. Correspondence and requests for materials should be addressed to S.Z. (email: [email protected]) Received: 14 October 2014
Accepted: 10 June 2015 Published: 07 July 2015
Recently, a whole genome association analysis study showed that SNPs located on SSC7, SSC13, SSC14 and SSC17 were significantly associated with the RFI trait in a Yorkshire pig population selected for high and low RFI7. Furthermore, 10 SNPs identified using high-density SNP chip analysis8 had significant association with FCR in a Duroc pig population, 2 of them were on SSC4 and the others were on SSC 14. However, by comparing chromosome regions and genes related with FE, it is hard to find a single region or one major candidate gene. Hence, the candidate genes relating to FE in pigs are not well understood.
Three biological processes have been reported to be associated with FE in pigs through microar-ray transcriptome analysis, including glucose metabolism, lipid metabolism and muscle development (myogenesis). Gene expression profiling in liver and adipose tissue following acute caloric restriction of pigs, suggested that lipid metabolism, mitochondrial activity and glucose synthesis were all related with FE9. Moreover, lipogenic and steroidogenic genes were down-regulated in both liver and adipose tissue of Yorkshire gilts with lower RFI10. In cattle, 161 genes were differentially expressed between animals with high and low RFI. These genes were related with several gene networks, including cell growth and differentiation, lipid metabolism and carbohydrate metabolism11. No major gene has been identified to regulate FE in pigs12.
MicroRNAs (miRNAs) are small noncoding RNAs of 18 to 23 nucleotides, which play important roles as post-transcriptional regulators13. miRNAs have also been reported to be associated with feed efficiency and energy metabolism. In cattle, the distribution of SNPs in miRNA motifs associated with RFI was much more significant compared with SNPs in other regions14. In addition, one SNP of the stearoyl-CoA desaturase (SCD) gene, within a predicted target site for 2 miRNAs (ssc-miR-185 and ssc-miR-491), was significantly associated with daily body weight gain and FCR in cattle15. Besides, there are some differ-entially expressed miRNAs in fish with different growth rates, with let-7j, miR-140, miR-192, miR-204, miR-218a, miR-218b, miR-301c and miR-460 all being down regulated in fast-growing fish. Moreover, let-7b, let-7c, miR-133, miR-152, miR-15a, miR-193a, miR-30b and miR-34 were all up regulated in fast-growing fish16. In March 2015, Li and his colleagues presented the first systematic identification and characterization of lincRNAs in fetal porcine skeletal muscle, which identified 570 porcine lincRNAs, but most were related to skeletal muscle development17. However, to our knowledge there are as yet no studies relating porcine FE and miRNA expression.
In this study, we used mRNA and miRNA sequencing to profile the skeletal muscle transcriptome and thereby identify genes and miRNAs that were differentially expressed between pigs with different feed efficiencies. We identify a number of genes and miRNAs that were significantly differentially expressed between high and low RFI pigs. Importantly, mitochondrial energy metabolism regulatory pathways (e.g. PGC-1a and AMPK) were down-regulated and muscle growth regulatory pathways (e.g. IGF-1/2 and TGF-β) were upregulated in skeletal muscle from the more efficient (low RFI) pigs.
Results
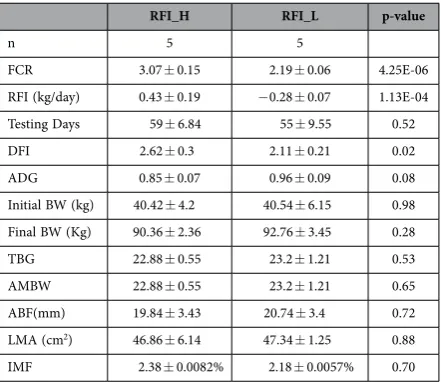
Animal performance. An original 238 castrated purebred Yorkshire boars were grown from 30 to 90 kg (average body weight) on a commercial pig feed (see Materials and Methods). Daily feed intake (DFI) and average daily gain (ADG) were measured and the FCR and RFI determined. From this data, two sub-groups were selected with Low or High RFI (RFI_L and RFI_H respectively). Importantly, the total weight gained and the time taken to do so was not significantly different between the two groups. The High RFI group (RFI_H) had RFI and FCR values of 0.43 ± 0.19 (Kg/day) and 3.07 ± 0.15 respec-tively, compared with − 0.28 ± 0.07 (Kg/day) and 2.19 ± 0.06 for the more efficient, Low RFI group (RFI_L, p < 0.05 for both RFI and FCR, Table 1). The lower FCR seen in the RFI_L group was achieved by a reduced DFI (p = 0.02) and, interestingly, a trend for an increase in ADG (p = 0.08) compared with the RFI_H group (Table 1). Although the average metabolic body weight gain (AMBW) was higher in the RFI_L group, it was not statistically significant (p = 0.65). Two assessments of body fat, average back fat (ABF) thickness and intramuscular fat (IMF) content, showed no significant differences, suggesting that changes in RFI or FCR were not mediated by significant changes in body fat.
RNA sequencing data mapping and annotation. A total of 6 cDNA libraries were sequenced from the longissimus dorsi muscle of RFI_L and RFI_H groups (n = 3 from each). The RNA sequence reads have been submitted to the NCBI Gene Expression Omnibus under accession E-MTAB-2946. After removing the adaptors and filtering, RNA-seq yielded from 7.8 M to 9.6 M single-end reads for all 6 samples, more than 99.99% reads were qualified (Supplementary Table S1).
miRNA sequencing data mapping and annotation. A total of 2 cDNA libraries were sequenced from the longissimus dorsi muscle of RFI_L and RFI_H groups (1 pool of n = 5 for each group), each cDNA library included the 3 samples used for RNA sequencing). After sequencing, a total of 13,307,888 reads were obtained from the RFI_H group and 11,744,483 reads from the RFI_L group. The miRNA sequence reads have been submitted to the NCBI Gene Expression Omnibus under accession E-MTAB-2949. After removing reads with non-canonical letters or with low quality, the 3’ adapter was trimmed and the sequences shorter than 18 nt discarded. In total, 12,503,358 (RFI_H), and 10,408,712 (RFI_L) clean reads were obtained, which corresponded to 93.95% and 88.63% respectively of the raw reads from each small RNA library. The length distribution of clean reads showed that most of the reads were between 21–23 nt in length, and read counts with 22 nt were highest (Supplementary Figure S2a).
A total of 402 mature miRNAs were identified. Among them, 152 were annotated porcine miRNAs already present in miRbase v20, 153 were miRNAs homologous to human or mouse, while 97 were novel miRNAs not homologous to any other species (Supplementary Figure S2b). The distribution of miRNAs on each chromosome depended on the number of annotated miRNAs on each chromosome (Supplementary Figure S2c).
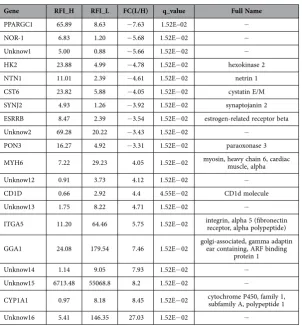
Differentially expressed genes between low and high RFI pigs. In the present RNA-seq study, 30,484 genes were detected in the skeletal muscle of all 6 individuals. A total of 645 genes were differen-tially expressed, with a criteria of at least a 2 fold difference and a p-value less than 0.05 (|log2FC| ≥ 1, p < 0.05), of which 99 genes had a q-value ≤ 0.05. Of the 99 differentially expressed genes, 60 genes were well annotated on the Sus Scrofa genome (version Sscrofa10.2.72), with 45 genes being up-regulated and 54 genes down-regulated in the low-RFI group (Supplementary Table S2). Table 2 shows the top 20 differentially expressed (DE) genes, the top 10 genes with either higher or lower expression in low RFI compared to high RFI pigs.
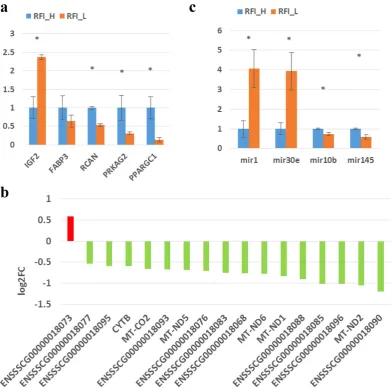
To validate the differential expression of genes, eight genes were selected for qRT-PCR analysis. Compared with the RFI_H group, expression of FABP3, RCAN, PPARGC1, and PRKAG2 mRNA were all lower in RFI_L muscles, whereas expression of IGF2 mRNA was higher in RFI_L muscles (Fig. 1a). Expression of 4 of the selected genes (IGF2, RCAN, PPARGC1 and PRKAG2) showed significant dif-ferences between the RFI_H and RFI_L groups. Hence the qRT-PCR analyses largely confirmed the RNA-seq data, with the correlation coefficient of the fold-change (FC) values from the two methods being 0.99 and the R2 for the linear regression also being 0.99, indicating the reliability of the RNA-seq analysis.
In addition, we analyzed the expression levels of various mitochondrial genes. There were 17 mito-chondrial coding genes detected (log2FC ≥ 0.5) and 16 genes (94.1%) were down regulated in the skeletal muscle from low RFI pigs (Fig. 1b, Supplementary Table S3).
Differentially expressed miRNAs between low and high RFI pigs. In the miRNA-sequencing study, 25 miRNAs were differentially expressed with a criteria of at least a 1.5 fold difference and total
RFI_H RFI_L p-value
n 5 5
FCR 3.07 ± 0.15 2.19 ± 0.06 4.25E-06 RFI (kg/day) 0.43 ± 0.19 − 0.28 ± 0.07 1.13E-04 Testing Days 59 ± 6.84 55 ± 9.55 0.52 DFI 2.62 ± 0.3 2.11 ± 0.21 0.02 ADG 0.85 ± 0.07 0.96 ± 0.09 0.08 Initial BW (kg) 40.42 ± 4.2 40.54 ± 6.15 0.98 Final BW (Kg) 90.36 ± 2.36 92.76 ± 3.45 0.28 TBG 22.88 ± 0.55 23.2 ± 1.21 0.53 AMBW 22.88 ± 0.55 23.2 ± 1.21 0.65 ABF(mm) 19.84 ± 3.43 20.74 ± 3.4 0.72 LMA (cm2) 46.86 ± 6.14 47.34 ± 1.25 0.88
[image:3.595.156.377.45.236.2]IMF 2.38 ± 0.0082% 2.18 ± 0.0057% 0.70
reads count no less than 20 (|logFC| ≥ 1, total ≥ 20, p ≤ 0.05). Of these 25 miRNAs, 14 were up-regulated and 11 down-regulated in RFI_L pigs (Table 3). Six of them were not found in the Sus scrofa miRNA database (miRbase v20), but are homologous with human. Six novel miRNAs were identified as being differentially expressed; the secondary structures of which were predicted by mirDeep2 (Supplementary Figure S3) and the predicted scores from mirDeep2 listed in Supplementary Table S4.
To validate the differential expression identified by the miRNA sequencing, miR-1, miR-30e, miR-10b and miR-145 were selected for qRT-PCR analysis. Compared to RFI_H muscles, expression of miR-1 and miR-30e miRNAs was higher, whereas expression of miR-10b, and miR-145 was lower in RFI_L muscles (Fig. 1c). All the selected miRNAs showed significant differences between RFI_H and RFI_L groups, confirming the results of miRNA-seq, and the correlation coefficient for the fold-change values (FC) from the two methods was 0.99 and the R2 for linear regression was also 0.99, indicating the reliability of the miRNA-seq analysis. The differentially expressed miRNAs were functionally involved in energy metabolism processes and pathways, which were all down regulated in low RFI pigs.
Pathway analysis of differentially expressed genes. For gene ontology (GO) biological processes analysis, 54 well annotated genes among the 99 significant DE genes were submitted and 45 of these genes were available in DAVID v6.7.
A total of 26 GO terms were enriched (Fisher Exact Probability Test, p < 0.05), which can be divided into 5 major groups: 1) Genes relating to general metabolism, 2) Genes relating to energy metabolism, 3) Genes relating to lipid metabolism, 4) Genes relating to cell differentiation, and 5) Genes relating to biosynthetic processes (Table 4).
Most genes related to energy metabolism, cell differentiation and biosynthesis were down regulated in pigs with low RFI. For example PPARGC1, PRKAG2, HK2 are related to energy metabolism; NOR-1, RCAN, ESRRB, ESRRG and JUNB are related to cell differentiation; and LIPG and GM2A are related to lipid catabolism. The significant down regulation (p ≤ 0.05) of all those genes indicates that low RFI pigs may be more efficient due to (i) a decrease in energy expenditure because of an inhibition of metabolic processes and/or (ii) an increase in skeletal muscle growth.
Gene RFI_H RFI_L FC(L/H) q_value Full Name
PPARGC1 65.89 8.63 − 7.63 1.52E–02 −
NOR-1 6.83 1.20 − 5.68 1.52E− 02 −
Unknow1 5.00 0.88 − 5.66 1.52E− 02 −
HK2 23.88 4.99 − 4.78 1.52E− 02 hexokinase 2 NTN1 11.01 2.39 − 4.61 1.52E− 02 netrin 1 CST6 23.82 5.88 − 4.05 1.52E− 02 cystatin E/M SYNJ2 4.93 1.26 − 3.92 1.52E− 02 synaptojanin 2 ESRRB 8.47 2.39 − 3.54 1.52E− 02 estrogen-related receptor beta Unknow2 69.28 20.22 − 3.43 1.52E− 02 −
PON3 16.27 4.92 − 3.31 1.52E− 02 paraoxonase 3 MYH6 7.22 29.23 4.05 1.52E− 02 myosin, heavy chain 6, cardiac muscle, alpha Unknow12 0.91 3.73 4.12 1.52E− 02 −
CD1D 0.66 2.92 4.4 4.55E− 02 CD1d molecule Unknow13 1.75 8.22 4.71 1.52E− 02 −
ITGA5 11.20 64.46 5.75 1.52E− 02 integrin, alpha 5 (fibronectin receptor, alpha polypeptide) GGA1 24.08 179.54 7.46 1.52E− 02 golgi-associated, gamma adaptin ear containing, ARF binding
protein 1 Unknow14 1.14 9.05 7.93 1.52E− 02 −
Unknow15 6713.48 55068.8 8.2 1.52E− 02 −
[image:4.595.156.459.42.369.2]CYP1A1 0.97 8.18 8.45 1.52E− 02 cytochrome P450, family 1, subfamily A, polypeptide 1 Unknow16 5.41 146.35 27.03 1.52E− 02 −
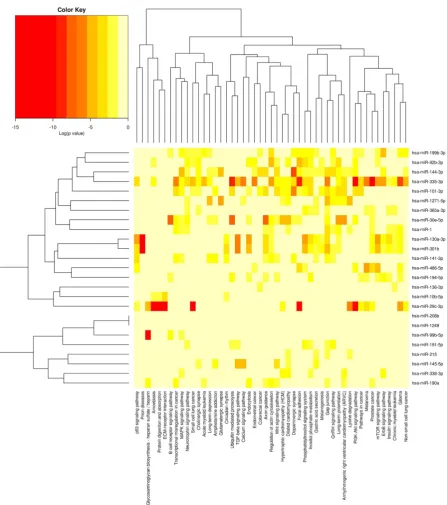
Pathway analysis of differentially expressed miRNAs. To better understand the biological func-tions of the 25 differentially expressed miRNAs identified, we predicted the potential target genes of these miRNAs. There were 12,687 terms of target genes returned, including 6,744 unique genes (Supplementary Table S5). Through the miRNA-targeted pathway union analysis, we found 55 KEGG pathways signif-icantly (Fisher Exact Probability Test, p < 0.05) related with genes targeted by up or down-regulated miRNAs (Supplementary Table S6). A lot of pathways were involved in energy metabolism and skeletal muscle growth, including the TGF-beta signaling pathway, PI3K-Akt signaling pathway, mTOR signaling pathway, GnRH signaling pathway and Hypertrophic cardiomyopathy (HCM).
To further classify and predict the function of differentially expressed miRNAs, we also performed hierarchical clustering of differentially expressed miRNAs and their target pathways (Fig. 2). Some NAs with the same regulation pattern or similar function were clustered together, for example miR-130a-3p and miR-301b-3p were clustered together. After checking the mature sequences of these two miRNAs, we found they have exactly the same seed sequences and both of them are in the same miRNA family.
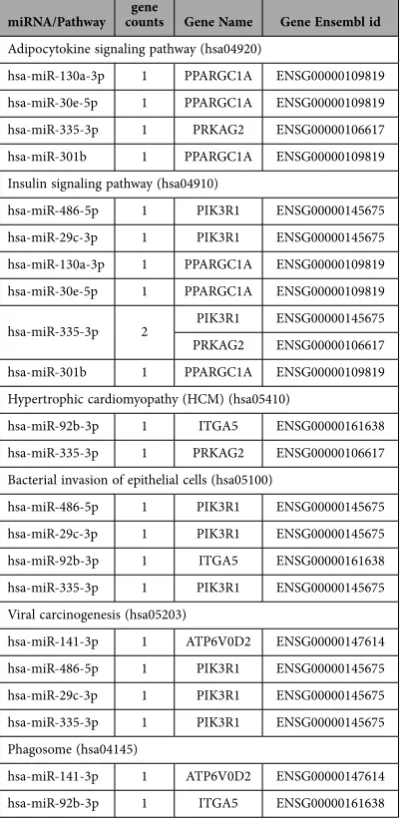
[image:5.595.158.551.43.434.2]The mRNA – miRNA Regulatory network analysis. We investigated the miRNA-gene interactions between 54 well annotated differentially expressed genes and 25 differentially expressed miRNAs. There were 6 significantly enriched pathways (Fisher Exact Probability Test, p < 0.05, Supplementary Table S7), including Adipocytokine signaling pathway, Insulin signaling pathway, Hypertrophic cardiomyopathy (HCM), Bacterial invasion of epithelial cells, Viral carcinogenesis, and Phagosome.
The genes and miRNAs related to those KEGG pathways are listed in Table 5. These pathways were mainly related to energy metabolism and skeletal muscle growth, and include PPARGC1A, PIK3R1, PRKAG2, hsa-miR-130a-3p, hsa-miR-30e-5p, and hsa-miR-335-3p.
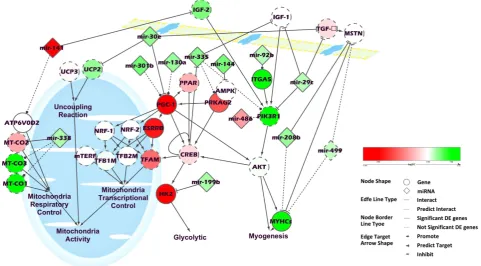
A key network of mRNA and miRNA in pig muscle potentially regulates RFI in pigs. Cytoscape v3.0.1 was used to integrate a potential network of differentially expressed genes and miRNAs interacting in pig skeletal muscle that might lead to differences in RFI (Fig. 3). When looking into the differentially expressed genes, we found that most of those genes were involved in mitochondrial activity, glycolysis or myogenesis pathways and were actually connected directly or indirectly through just one or two genes. In this network, the mitochondrial activity was separated into 3 parts: the uncoupling reaction, the mitochondria respiratory control and the mitochondria transcriptional control.
In mitochondrial activity, the expression levels of PGC-1, ESRRB and TFAM were down-regulated in the low RFI pigs more than other genes, which suggests that the down-regulation of mitochondrial activity might possibly be through mitochondria transcriptional control.
In the glycolysis pathway, the upstream genes of CREB were also involved in mitochondria tran-scriptional control. Most of these genes were down-regulated in low RFI pigs, such as PGC1, PPAR and PRKAG2. HK2, the gene downstream of CREB, was also down-regulated in low RFI pigs. HK2 is a hex-okinase that phosphorylates glucose to produce glucose 6-phosphate18. Hexokinase regulates glycolysis as the first rate-limiting enzyme19. Moreover, the miRNAs, which were reported or predicted to target and therefore inhibit these genes, were all up-regulated in low RFI pigs, including 30e, 301b, mir-130a, mir-335 and mir-199b. This suggests an overall decrease in glycolysis and mitochondrial activity in skeletal muscle of low RFI pigs.
In contrast, most genes involved in the myogenesis pathway were up-regulated in low RFI pigs, such as IGF-2, ITGA5, PIK3R1 and MYHCs. Also, TGF-β, which is an inhibitor of myogenesis, was down-regulated in low RFI pigs. Interestingly, mir-141, which targets IGF-2, was down-regulated and
Ssc miRNA Ref miRNA FC(L/H) p-value q-value Mature Sequence
[image:6.595.157.554.45.401.2]ssc-miR-215-5p hsa-miR-215-5p − 673.96 4.57E-27 1.48E-24 augaccuaugaauugacagaca ssc-new-1 hsa-miR-141-3p − 23.34 2.12E-04 1.73E-02 uaacacugucugguaaagaug ssc-miR-194-5p hsa-miR-194-5p − 19.66 8.87E-09 1.44E-06 uguaacagcgacuccauguggac ssc-miR-365-3p hsa-miR-365a-3p − 1.94 0.09 1 uaaugccccuaaaaauccuuau ssc-new-2 hsa-miR-1249 − 1.74 0.41 1 acgcccuucccccccuucuuca ssc-miR-486-5p hsa-miR-486-5p − 1.69 0.04 1 uccuguacugagcugccccgag ssc-miR-1271-5p hsa-miR-1271-5p − 1.64 0.13 1 cuuggcaccuaguaagcacuca ssc-miR-145-5p hsa-miR-145-5p − 1.6 0.18 1 guccaguuuucccaggaaucccu ssc-miR-99b-5p hsa-miR-99b-5p − 1.51 0.17 1 cacccguagaaccgaccuugcg ssc-miR-191-5p hsa-miR-191-5p − 1.5 0.15 1 caacggaaucccaaaagcagcug ssc-miR-10b-5p hsa-miR-10b-5p − 1.45 0.14 1 uacccuguagaaccgaauuugu ssc-miR-29c-3p hsa-miR-29c-3p 1.48 0.35 1 uagcaccauuugaaaucgguua ssc-miR-92b-3p hsa-miR-92b-3p 1.5 0.44 1 uauugcacucgucccggccucc ssc-miR-101-3p hsa-miR-101-3p 1.55 0.19 1 uacaguacugugauaacugaag ssc-miR-338-3p hsa-miR-338-3p 1.56 0.37 1 uccagcaucagugauuuuguu ssc-miR-199b-3p hsa-miR-199b-3p 1.61 0.15 1 acaguagucugcacauugguu ssc-new-3 hsa-miR-130a-3p 1.73 0.25 1 cagugcaauaguauugucaaagc ssc-miR-208b-3p hsa-miR-208b-3p 1.74 0.11 1 auaagacgaacaaaagguuugu ssc-miR-1-3p hsa-miR-1 1.81 0.09 1 uggaauguaaagaaguauguau ssc-miR-30e-5p hsa-miR-30e-5p 1.83 0.04 1 uguaaacauccuugacuggaagcu ssc-miR-335-3p hsa-miR-335-3p 1.89 0.28 1 uuuuucauuauugcuccugacc ssc-miR-136-3p hsa-miR-136-3p 1.93 0.12 1 caucaucgucucaaaugagucu ssc-new-4 hsa-miR-144-3p 2.1 0.32 1 uacaguauagaugauguacu ssc-new-5 hsa-miR-301b 2.15 0.46 1 cagugcaaugauauugucaaagc ssc-new-6 hsa-miR-190a 2.28 0.34 1 ugauauguuugauauauuagguug
Table 3. List of 25 DE miRNAs in LD muscle between Yorkshire pigs with low and high RFI. The p-value was calculated by the formula:
( )
)
(
( ) = ( + ) !
! ! + ( + + )
p x y NN y x y
x y
2
1 1 N
N X Y
2 1
1 with a Python script. The q-value
mir-30e, which targets TGF-β , was upregulated in low RFI pigs. These results indicate that the increased efficiency of low RFI pigs is associated with enhanced skeletal muscle growth.
Discussion
Two groups of pigs were identified which had either high or low residual feed intake. Those pigs in the RFI_L group were more efficient, having a lower FCR than the RFI_H group, due to lower DFI and slightly higher ADG. A common observation in these types of study is that selection for greater feed effi-ciency often targets reduced feed intake, which has been reported as undesirable as it can reduce growth and reproductive performance20,21. However in this study there was trend for a positive effect on ADG in the RFI_L pigs, despite a reduction in feed intake. From the estimates of fat deposition, there were
Genes RFI_L/H high RFI_L/H low Term ID Term name P-Value
Genes relating to biosynthetic processes
PRKAG2 ATP6V0D2 ATP8A1
1 2 GO:0009260 ribonucleotide biosynthetic process 4.73E-02 GO:0009152 purine ribonucleotide biosynthetic process 4.26E-02
GO:0009142 nucleoside triphosphate biosynthetic process 3.32E-02
GO:0009145 purine nucleoside triphosphate biosynthetic process 3.14E-02
GO:0009201 ribonucleoside triphosphate biosynthetic process 3.14E-02
GO:0009206 purine ribonucleoside triphosphate biosynthetic process 3.08E-02
GO:0006754 ATP biosynthetic process 2.58E-02 GM2A, HK2, MDH1 1 2 GO:0016052 carbohydrate catabolic process 3.75E-02 Genes relating to cell differentiation
NOS1, RCAN1, MYH6 1 2 GO:0051146 striated muscle cell differentiation 2.53E-02 GO:0042692 muscle cell differentiation 4.53E-02 ESRRB, JUNB 0 2 GO:0001829 trophectodermal cell differentiation 4.40E-02 Genes relating to lipid metabolism
GM2A, LIPG, FABP3, ATP8A1 3 1 GO:0010876 lipid localization 9.61E-03 GO:0006869 lipid transport 7.73E-03 GM2A, LIPG 2 0 GO:0044242 cellular lipid catabolic process 8.62E-02 Genes relating to energy metabolism
PRKAG2, HK2, ATP6V0D2,
GLRX, MDH1 0 5 GO:0006091 generation of precursor metabolites and energy 1.12E-02
LIPG, FABP3, SYNJ2, PIK3R1 0 4 GO:0019637 organophosphate metabolic process 1.84E-02 GO:0006644 phospholipid metabolic process 1.60E-02 FABP3, SYNJ2, PIK3R1 0 3 GO:0006650 glycerophospholipid metabolic process 4.33E-02 Genes relating to general metabolism
PRKAG2, MYH6, ATP6V0D2,
ATP8A1 2 2
GO:0009259 ribonucleotide metabolic process 8.03E-03 GO:0006163 purine nucleotide metabolic process 1.52E-02 GO:0009150 purine ribonucleotide metabolic process 6.75E-03 GO:0009141 nucleoside triphosphate metabolic process 5.85E-03
GO:0009144 purine nucleoside triphosphate metabolic process 4.80E-03
GO:0009199 ribonucleoside triphosphate metabolic process 4.37E-03
GO:0009205 purine ribonucleoside triphosphate metabolic process 4.27E-03
[image:7.595.156.554.43.550.2]GO:0046034 ATP metabolic process 3.15E-03
no changes in body fat, although the values for back fat and IMF tended to be lower in the RFI_L pigs. In addition the AMBW of the RFI_L was higher than RFI_H, but this was not statistically significant. When combined with the assessment of body fat, this suggests an increase in lean tissue growth and a corresponding decrease in fat in the more efficient RFI_L pigs.
[image:8.595.79.527.40.546.2]We identified 99 differentially expressed genes and 25 differentially expressed miRNAs in LD muscle from pigs with significantly different RFI. These genes and miRNAs corresponded to two key pathways/ functions, one related to mitochondria and energy metabolism and the other related to skeletal muscle growth. The energy metabolism and growth of skeletal muscle may be the two key factors responsible for low RFI and therefore increased efficiency of pigs.
Mitochondria produce more than 90% of cellular energy through oxidative phosphorylation (OXPHOS), but also waste energy and generate heat through uncoupling reactions22. In our study, both the uncoupling reactions and OXPHOS were down-regulated in low RFI pigs. Uncoupling proteins (UCP) play a critical role in energy-dissipating uncoupling reactions through [H+ ] leakage in mitochondria. It has been reported that overexpression of UCP3 in skeletal muscle increases energy expenditure and decreases feed efficiency in mice23,24. In our study, we found UCP2, the ubiquitously expressed isoform of UCP, was down regulated in muscle from low RFI pigs. Also miR-30e, which directly targets UCP2, was up regulated in RFI_L pigs. We also found that genes associated with OXPHOS and ATP synthesis and mitochondria transcriptional control were all down-regulated in low RFI pigs, including COX-I, COX-III, COX-IV, COX-V, PGC-1, PRKAG2, ESRRGB, and HK2. MiR-338 has been confirmed to inhibit COXIV at mRNA and protein levels25 and miR-338 was up-regulated in low RFI pigs.
PGC-1, also called PPARGC1 or PPARGC1A, plays an important role in mitochondrial biogenesis, by activating cAMP response element binding protein (CREB) and nuclear respiratory factors (NRFs). These nuclear factors then increase the transcription of mitochondrial transcription factors (TFAM, TFB1M, TFB2M) which promote mitochondrial biogenesis26. Overexpression of PGC-1 has been reported to increase energy expenditure and mitochondrial number27. In our study, PGC-1 and all these down-stream genes related to mitochondrial biogenesis were down-regulated in the low RFI pigs. Also, we found that expression of almost all the genes located in the mitochondrial DNA were down-regulated in low RFI pigs, suggesting either a reduction in the number of mitochondria or a general down-regulation of mitochondrial function. In addition, CREB has been reported to be targeted by miR-335, which was
miRNA/Pathway Target
gene
counts Gene Name Gene Ensembl id
Adipocytokine signaling pathway (hsa04920)
hsa-miR-130a-3p 1 PPARGC1A ENSG00000109819 hsa-miR-30e-5p 1 PPARGC1A ENSG00000109819 hsa-miR-335-3p 1 PRKAG2 ENSG00000106617 hsa-miR-301b 1 PPARGC1A ENSG00000109819 Insulin signaling pathway (hsa04910)
hsa-miR-486-5p 1 PIK3R1 ENSG00000145675 hsa-miR-29c-3p 1 PIK3R1 ENSG00000145675 hsa-miR-130a-3p 1 PPARGC1A ENSG00000109819 hsa-miR-30e-5p 1 PPARGC1A ENSG00000109819
hsa-miR-335-3p 2 PIK3R1 ENSG00000145675 PRKAG2 ENSG00000106617 hsa-miR-301b 1 PPARGC1A ENSG00000109819 Hypertrophic cardiomyopathy (HCM) (hsa05410)
hsa-miR-92b-3p 1 ITGA5 ENSG00000161638 hsa-miR-335-3p 1 PRKAG2 ENSG00000106617 Bacterial invasion of epithelial cells (hsa05100)
hsa-miR-486-5p 1 PIK3R1 ENSG00000145675 hsa-miR-29c-3p 1 PIK3R1 ENSG00000145675 hsa-miR-92b-3p 1 ITGA5 ENSG00000161638 hsa-miR-335-3p 1 PIK3R1 ENSG00000145675 Viral carcinogenesis (hsa05203)
hsa-miR-141-3p 1 ATP6V0D2 ENSG00000147614 hsa-miR-486-5p 1 PIK3R1 ENSG00000145675 hsa-miR-29c-3p 1 PIK3R1 ENSG00000145675 hsa-miR-335-3p 1 PIK3R1 ENSG00000145675 Phagosome (hsa04145)
[image:9.595.156.357.57.467.2]hsa-miR-141-3p 1 ATP6V0D2 ENSG00000147614 hsa-miR-92b-3p 1 ITGA5 ENSG00000161638
up-regulated in low RFI pigs28. Therefore, these results indicate that mitochondrial biogenesis/function and energy expenditure were reduced in low RFI pigs.
AMPK is a key regulator of cellular and whole-body energy balance, which is activated by an increase in the AMP/ATP ratio29,30. AMPK can also increase mitochondrial proteins of oxidative metabolism, as well as promote the expression of Hexokinase II (HK2) through CREB in skeletal muscle31. In our study, we found that HK2 and Protein kinase, AMP-activated, gamma 2 non-catalytic subunit (PRKAG2), which is a member of AMPK gamma subunit family, were both down regulated in low RFI pigs. Also, miR-144, which has been reported to inhibit the phosphorylation of AMPK alpha (AMPKα), was increased in low RFI pigs32. These results indicate that the level of energy metabolism in skeletal muscle was probably reduced in low RFI pigs compared to high RFI pigs.
Further KEGG pathway analyses indicated that PGC-1 and PRKAG2 are involved in the adipocy-tokine signaling pathway (KEGG hsa04920). In this pathway, mitochondrial fatty acid β -oxidation is increased by the expression of PGC-1, while PRKAG2 increases appetite by up-regulating AGRP and NPY. Recently, Lindholm-Perry found the expression level PRKAG2 in the rumen was associated with ADFI in cattle33, although the direction of the association depended upon season. Thus, PGC-1 and PRKAG2 are potentially key genes in the molecular regulation of feed efficiency. Although this pathway is termed the “adipocytokine signaling pathway”, the genes are expressed in lots of tissues/ cell types where they have similar functions.
As a PPARα coactivator, PGC-1 plays a key role in the transcriptional control of genes encoding mito-chondrial fatty acid β -oxidation (FAO)34. It is reported that PPARα/PGC-1 signaling pathway can be acti-vated by chronic overnutrition and obesity, resulting in the up regulation of fatty acid β -oxidation related genes, such as FATP1, FACS1, UCP2 and UCP335. PRKAG2 also plays a critical role in regulating cellular fatty acid metabolic pathways36. Thus, the down regulation of these genes indicate that mitochondrial fatty acid β -oxidation was reduced in low RFI pigs compared to high RFI pigs. Hence we propose that the pathway is more to do with regulating whole body energy balance via effects on energy expenditure or appetite, rather than relating to adipose tissue metabolism per se.
[image:10.595.75.557.50.316.2]A number of miRNAs related to skeletal muscle growth and development were differentially expressed between low and high RFI pigs, including miR-208b, miR-499, miR-29c, miR-1 and miR-99b. The trans-forming growth factor-beta (TGF-β) signalling pathway, which includes Myostatin (MSTN), is considered the most potent negative regulator of skeletal muscle growth and development37. It has been reported that, miR-29 and miR-30b are both inhibitors of TGF-beta38–40, while miR-208b and miR-499 inhibit the MSTN gene41. Also, overexpression of miR-29 promotes myogenic differentiation in C2C12 cells, due to the reduction in TGF-beta, which inhibits differentiation42. Furthermore, miR-99b has been reported to
be directly stimulated by the TGF-β signaling pathway43 and miR-99b is reported to inhibit IGF-1/mTOR signaling by targeting AKT1, IGF1R and mTOR44,45.
In the present study, we found miR-29c, miR-30b, miR-208b and miR-499 were all up-regulated in low RFI pigs, while miR-99b was down-regulated. All these results suggest that muscle growth and devel-opment was increased in low RFI pigs via the inhibition of the TGF-β signaling pathway and stimulation of the IGF-1/mTOR signaling pathway. We also found IGF-2 and MYHCs were up-regulated in low RFI pigs. It appears from the pig growth performance data that these changes were associated with a slightly increased ADG, even though DFI was reduced, suggesting that the RFI_L pigs were able to sustain their growth whilst reducing their feed intake.
Thus, based on the entire expression profiles of both mRNAs and miRNAs, we conclude that the improvements in feed efficiency in low RFI pigs are due to inhibition of skeletal muscle mitochondrial activity through PGC-1/TFAM and PRKAG2 combined with the stimulation of muscle growth through TGF-β and IGF-1/2 signaling pathways.
Conclusions
Overall, we identified 99 mRNAs and 25 miRNAs that were differentially expressed in skeletal muscle from pigs with different RFI. These genes were functionally related to metabolism, particularly energy and lipid metabolism, as well as biosynthetic processes and muscle cell growth and differentiation. A number of genes involved in energy metabolism were down-regulated, whereas quite a few miRNAs that target energy metabolism genes were up-regulated in muscle from low RFI pigs. Similarly, a number of genes and miRNAs which stimulate skeletal muscle differentiation and proliferation were up-regulated. We propose that feed efficiency in pigs can be improved by reducing energy metabolism in muscle, particularly mitochondrial metabolism, and/or by enhancing skeletal muscle growth and we identify a number of miRNAs and genes that might be targets for manipulation. This study enhances our under-standing of molecular mechanisms regulating feed efficiency in pigs.
Materials and Methods
Animals and tissues. In this study, 238 castrated purebred Yorkshire boars were grown from 30 to 90 Kg, the average period of study was 67.35 days. Pigs were slaughtered at 90 kg according to a standard procedure approved by Biological Studies Animal Care and Use Committee46, Hubei Province, P. R. China. They were individually fed ad libitum a complete mixed commercial feedlot ration (see Supplementary Table S8), using ACEMA 64 automated individual feeding systems in the Agricultural Ministry Breeding Swine Quality Supervision Inspecting and Testing Center (Wuhan). All the meth-ods in this study were carried out in accordance with the approved guidelines from Regulation of the Standing Committee of Hubei People’s Congress . All experimental protocols were approved by the Ethics Committee of Huazhong Agricultural University.
For RNA sequencing, the 3 pigs with the highest RFI (named RFI_H group) and the 3 pigs with low-est RFI (named RFI_L group) were selected from the 238 pigs, each RFI group having no difference in starting body weight (Table 1). For miRNA sequencing, the 5 pigs with the highest RFI (named RFI_H group) and the 5 pigs with the lowest RFI (named RFI_L group) were selected.
Within 30 minutes after slaughter, a piece of longissimus dorsi muscle of each animal was sampled at the thoracolumbar junction. All tissue samples were immediately frozen in liquid nitrogen and stored at − 80 °C for RNA isolation.
Phenotypes. RFI was calculated by a linear regression model according to the records of daily feed intake (DFI), average daily gain (ADG) and mid-test metabolic body weight (MBW) of all the pigs.
The base model used was Yj= β0 + β1MBWj+ β2ADGj+ ej , where Yj is the DMI of the jth animal, β0 is the regression intercept, β1 is the regression coefficient on MBW, β2 is the regression coefficient on ADG, and ej is the uncontrolled error of the jth animal.
RNA preparation and sequencing. Total RNA was extracted with Trizol reagent (Invitrogen, USA), according to the manufacturer’s instructions. RNA sequencing libraries were prepared for each RNA-seq sample using “TruSeq
®
Stranded Total RNA Sample Preparation kit (Illumina®
)” and all of the pro-cedures and standards were performed according to the manual supplied with this kit. For miRNA sequencing, the RNA samples from the 5 different pigs in the same group were pooled together based on an equal RNA quantity. TruSeq®
Small RNA Sample Prep Kit (Illumina®
) was used for miRNA sequenc-ing library preparation and all of the procedures and standards were performed accordsequenc-ing to the manual supplied with this kit. After quality control, sequencing of all the libraries was performed by HiSeq2000. Solexa sequencing was performed at the Beijing Genomics Institute (BGI), Beijing, China.genome with the option --library-type fr-firststrand. Cufflinks (version 2.1.1) was used for transcriptome assembling, and Cuffdiff script from Cufflinks was used for gene expression analysis with the option -classic-fpkm. The expression level of each gene was represented by the FPKM value, which means frag-ments per kilobase of exon per million fragfrag-ments mapped, and was calculated by the following formula48:
= × , ,
× ( ). ( )
reads count
total reads map to genome gene length Kb
FPKM 1 000 000
1 Finally, q ≤ 0.05 was set as the threshold for differentially expressed (DE) gene selection.
Analyses of miRNA-Seq data. Firstly, miRNA-Seq data were transferred from Illumina fastq format to fasta format and then the miRNA-seq datasets analyzed with mirDeep (v2.0.0.5)49,50. The porcine genome (Sscrofa10.2.72) was downloaded from Ensembl, and the miRNA reference was obtained from the miRBase database (version 20)51–55.
The miRNA expression level of each library was normalized by the following formula56:
= Reads count× , , . ( )
total clean reads count
Normalized reads count 1 000 000 2
The P-value between the two libraries was calculated using the following formulas57:
(
)
( ) = ( + )! ! ! + . ( ) ( + + ) N N x y x yp x y 2
1 1 3 y N N X Y 2 1 1
N1 and N2 represent the total numbers of clean reads in the two small RNA libraries. The q-value was calculated by fdrtool in R58. Finally, |log2FC| ≥ 1, total reads count ≥ 20, p ≤ 0.05 was set as the threshold for selection of differentially expressed (DE) miRNA.
Q-RT-PCR validation of differentially expressed genes and miRNAs. Relative expression levels of the differentially expressed genes and miRNAs in muscle were quantified by real-time PCR. The RPL4 gene and 18S RNA were selected as the internal controls for qRT-PCR validation because of their stable expression in skeletal muscle tissues. The poly(A)-tailed RT-PCR method59 was performed for miRNA reverse transcription. Primer sequences and PCR conditions for analyzed genes and miRNAs are listed in Supplementary Table S9. The reactions were performed on a Roche Lightcycler 480 Sequence Detection System using SYBR Green PCR Master Mix (TOYOBO, QPK201), following the instruction manual. The 50 μ L reaction mixture consisted of 5 μ L cDNA, 25 μ L 2 × SYBR Green PCR Master Mixture, 0.5 μ M each primers and water. The qPCR profiles began with initial denaturation at 95 °C for 10 min, and then fol-lowed by 40 cycles of 95 °C denaturation for 15s, annealed at 60 °C for 15s, and 72 °C for 15s extension. A dissociation curve was generated at the end of the last cycle by collecting the fluorescence data from 58 °C to 95 °C. The 2-∆∆ Ct method was employed for relative gene expression level analysis. For each gene, the average ∆ Ct value of the RFI_L group was used as reference to calculate the ∆∆ Ct value, and Student’s t-test was used to analyze the expression difference between the 2 groups59.
Potential target gene prediction of miRNAs. To explore the potential function of miRNAs with significant differential expression in the two groups, potential target genes and pathways of miRNAs were predicted by DIANA miRPath (v.2.0)60. As porcine genes were not included in the current version of DIANA miRPath, prediction was performed using human miRNAs. The P-value threshold was 0.05 and MicroT threshold was 0.860 (http://www.microrna.gr/miRPathv2).
Gene ontology and pathway analyses. The human homologous Ensembl Gene IDs of the iden-tified DE genes and miRNA target genes were utilized for the following bioinformatics analysis. Gene enrichment in gene ontology (GO) biological processes and pathways were performed with the DAVID Bioinformatics Resources v6.7 (http://david.abcc.ncifcrf.gov/)61,62. Cutoff criteria were EASE scores less than 0.01 (GO enrichment) or 0.05 (Gene enrichment in pathways). EASE score were given by DAVID, which is a modified Fisher’s exact test. Cytoscape (v3.0.1) was used to create the potential important network(s) of DE genes and miRNAs63.
References
1. Koch, R. M., Swiger, L. A., Chambers, D. J. & Gregory K. E. Efficiency of feed use in beef cattle. J Anim Sci22, 486–494 (1963). 2. Herd, R. M. & Arthur, P. F. Physiological basis for residual feed intake. J Anim Sci87, 64–71 (2009).
3. Do, D. N., Strathe, A. B., Jensen, J., Mark T. & Kadarmideen, H. N. Genetic parameters for different measures of feed efficiency and related traits in boars of three pig breeds. J Anim Sci91, 4069–4079 (2013).
4. Gilbert, H. et al. Correlated responses in sow appetite, residual feed intake, body composition, and reproduction after divergent selection for residual feed intake in the growing pig. J Anim Sci90, 1097–1108 (2012).
6. Zhang, Z. Y. et al. Mapping quantitative trait loci for feed consumption and feeding behaviors in a White Duroc x Chinese Erhualian resource population. J Anim Sci87, 3458 (2009).
7. Onteru, S. K. et al. Whole Genome Association Studies of Residual Feed Intake and Related Traits in the Pig. PLoS One8, e61756 (2013).
8. Sahana, G., Kadlecova, V., Hornshoj, H., Nielsen, B. & Christensen, O. F. A genome-wide association scan in pig identifies novel regions associated with feed efficiency trait. J Anim Sci91, 1041–1050 (2013).
9. McDonald, J. M., Ramsey, J. J., Miner, J. L. & Nielsen, M. K. Differences in mitochondrial efficiency between lines of mice divergently selected for heat loss. J Anim Sci87, 3105–3113 (2009).
10. Lkhagvadorj, S. et al. Gene expression profiling of the short-term adaptive response to acute caloric restriction in liver and adipose tissues of pigs differing in feed efficiency. Am J Physiol Regul Integr Comp Physiol298, 494–507 (2010).
11. Chen, Y. et al. Global gene expression profiling reveals genes expressed differentially in cattle with high and low residual feed intake. Anim Genet42, 475–490 (2011).
12. Moore, S. S., Mujibi, F. D. & Sherman, E. L. Molecular basis for residual feed intake in beef cattle. J Anim Sci87, 41–47 (2009). 13. Bushati, N. & Cohen, S. M. microRNA functions. Annu Rev Cell Dev Biol23, 175–205 (2007).
14. Barendse, W. et al. A validated whole-genome association study of efficient food conversion in cattle. Genetics176, 1893–1905 (2007).
15. Bartz, M. et al. Transcript abundance of the pig stearoyl-CoA desaturase gene has no effect on fatty acid composition in muscle and fat tissues, but its polymorphism within the putative microRNA target site is associated with daily body weight gain and feed conversion ratio. J Anim Sci91, 10–9 (2013).
16. Huang, C. W. et al. Differential expression patterns of growth-related microRNAs in the skeletal muscle of Nile tilapia (Oreochromis niloticus). J Anim Sci90, 4266–4279 (2012).
17. Zhao, W. et al. Systematic identification and characterization of long intergenic non-coding RNAs in fetal porcine skeletal muscle development. Sci Rep5, 8957–8964 (2015).
18. Nishimasu, H., Fushinobu, S., Shoun, H. & Wakagi, T. Crystal structures of an ATP-dependent hexokinase with broad substrate specificity from the hyperthermophilic archaeon Sulfolobus tokodaii. J Biol Chem282, 9923–9931 (2007).
19. Henningsen, C., Zahner, G. & Thaiss, F. High glucose induces type 1 hexokinase gene expression in isolated glomeruli of diabetic rats and in mesangial cells. Nephron Physiol93, 67–75 (2003).
20. Wang, Z. et al. Impact of selection for residual feed intake on breeding soundness and reproductive performance of bulls on pasture-based multisire mating. J Anim Sci90, 2963–2969 (2012).
21. Crowley, J. J. et al. Genetic relationships between feed efficiency in growing males and beef cow performance. J Anim Sci89, 3372–3381 (2011).
22. Kagawa, Y. & Ohta, S. Regulation of mitochondrial ATP synthesis in mammalian cells by transcriptional control. Int J Biochem
22, 219–229 (1990).
23. Clapham, J. C. et al. Mice overexpressing human uncoupling protein-3 in skeletal muscle are hyperphagic and lean. Nature406, 415–418 (2000).
24. Cioffi, F. et al. Uncoupling proteins: a complex journey to function discovery. Biofactors35, 417–428 (2009).
25. Aschrafi, A. et al. MicroRNA-338 regulates local cytochrome c oxidase IV mRNA levels and oxidative phosphorylation in the axons of sympathetic neurons. J Neurosci28, 12581–12590 (2008).
26. Asin-Cayuela, J. & Gustafsson, C. M. Mitochondrial transcription and its regulation in mammalian cells. Trends Biochem Sci32, 111–117 (2007).
27. Lehman, J. J. et al. Peroxisome proliferator-activated receptor gamma coactivator-1 promotes cardiac mitochondrial biogenesis.
J Clin Invest106, 847–856 (2000).
28. Martin, N. T. et al. ATM-dependent MiR-335 targets CtIP and modulates the DNA damage response. PLoS Genet9, e1003505 (2013).
29. Bijland, S., Mancini, S. J. & Salt, I. P. Role of AMP-activated protein kinase in adipose tissue metabolism and inflammation. Clin Sci (Lond)124, 491–507 (2013).
30. Miranda, N., Tovar, A. R., Palacios, B. & Torres, N. AMPK as a cellular energy sensor and its function in the organism. Rev Invest Clin59, 458–469 (2007).
31. Thomson, D. M. et al. AMP-activated protein kinase phosphorylates transcription factors of the CREB family. J Appl Physiol (1985)104, 429–438 (2008).
32. Turczynska, K. M. et al. Stretch-sensitive down-regulation of the miR-144/451 cluster in vascular smooth muscle and its role in AMP-activated protein kinase signaling. PLoS One8, e65135 (2013).
33. A. K. Lindholm-Perry et al. DNA polymorphisms and transcript abundance of PRKAG2 and phosphorylated AMP-activated protein kinase in the rumen are associated with gain and feed intake in beef steers. Anim Genet45, 461 (Aug, 2014).
34. Vega, R. B., Huss, J. M. & Kelly, D. P. The coactivator PGC-1 cooperates with peroxisome proliferator-activated receptor alpha in transcriptional control of nuclear genes encoding mitochondrial fatty acid oxidation enzymes. Mol Cell Biol20, 1868–1876 (2000).
35. Abel, E. D., Litwin, S. E. & Sweeney, G. Cardiac remodeling in obesity. Physiol Rev88, 389–419 (2008).
36. Gollob, M. H. Modulating phenotypic expression of the PRKAG2 cardiac syndrome. Circulation117, 134–135 (2008). 37. Lee, S. J. et al. Regulation of muscle mass by follistatin and activins. Mol Endocrinol24, 1998–2008 (2010).
38. Patel, V. & Noureddine, L., MicroRNAs and fibrosis. Curr Opin Nephrol Hypertens21, 410–416 (2012).
39. Pandit, K. V., Milosevic, J. & Kaminski, N. MicroRNAs in idiopathic pulmonary fibrosis. Transl Res157, 191–199 (2011). 40. Jiang, L. et al. A microRNA-30e/mitochondrial uncoupling protein 2 axis mediates TGF-beta1-induced tubular epithelial cell
extracellular matrix production and kidney fibrosis. Kidney Int84, 285–296 (2013).
41. Allen, D. L. & Loh, A. S. Posttranscriptional mechanisms involving microRNA-27a and b contribute to fast-specific and glucocorticoid-mediated myostatin expression in skeletal muscle. Am J Physiol Cell Physiol300, 124–137 (2011).
42. Wei, W. et al. miR-29 targets Akt3 to reduce proliferation and facilitate differentiation of myoblasts in skeletal muscle development.
Cell Death Dis4, e668 (2013).
43. Turcatel, G., Rubin, N., El-Hashash, A. & Warburton, D. MIR-99a and MIR-99b modulate TGF-beta induced epithelial to mesenchymal plasticity in normal murine mammary gland cells. PLoS One7, e31032 (2012).
44. Jin, Y. et al. MicroRNA-99 family targets AKT/mTOR signaling pathway in dermal wound healing. PLoS One8, e64434 (2013). 45. Chakraborty, C., George Priya Doss, C. & Bandyopadhyay, S. miRNAs in insulin resistance and diabetes-associated pancreatic
cancer: the ‘minute and miracle’ molecule moving as a monitor in the ‘genomic galaxy’. Curr Drug Targets14, 1110–1117 (2013). 46. H. P. S. a. T. Department, Hubei Province Laboratory Animal Ordinance. Hubei Provincial People’s Government Gazette1, 5
(2006).
47. Trapnell, C. et al. Differential gene and transcript expression analysis of RNA-seq experiments with TopHat and Cufflinks. Nat Protoc7, 562–578 (2012).
49. An, J., Lai, J., Lehman, M. L. & Nelson, C. C. miRDeep*: an integrated application tool for miRNA identification from RNA sequencing data. Nucleic Acids Res41, 727–737 (2013).
50. Friedlander, M. R. et al. Discovering microRNAs from deep sequencing data using miRDeep. Nat Biotechnol26, 407–415 (2008). 51. Kozomara, A. & Griffiths-Jones, S. miRBase: annotating high confidence microRNAs using deep sequencing data. Nucleic Acids
Res42, 68–73 (2014).
52. Kozomara, A. & Griffiths-Jones, S. miRBase: integrating microRNA annotation and deep-sequencing data. Nucleic Acids Res39, 152–157 (2011).
53. Griffiths-Jones, S., Saini, H. K., van Dongen, S. & Enright, A. J. miRBase: tools for microRNA genomics. Nucleic Acids Res36, 154–158 (2008).
54. Griffiths-Jones, S., Grocock, R. J., van Dongen, S., Bateman, A. & Enright, A. J. miRBase: microRNA sequences, targets and gene nomenclature. Nucleic Acids Res34, 140–144 (2006).
55. Griffiths-Jones, S., The microRNA Registry. Nucleic Acids Res32, 109–111 (2004).
56. Fahlgren N. et al. Computational and analytical framework for small RNA profiling by high-throughput sequencing. RNA15, 992–1002 (2009).
57. Audic, S. & Claverie, J. M. The significance of digital gene expression profiles. Genome Res7, 986–995 (1997).
58. Strimmer, K. fdrtool: a versatile R package for estimating local and tail area-based false discovery rates. Bioinformatics24, 1461–1462 (2008).
59. Fu, H. J. et al. A novel method to monitor the expression of microRNAs. Mol Biotechnol32, 197–204 (2006).
60. Vlachos, I. S. et al. DIANA miRPath v.2.0: investigating the combinatorial effect of microRNAs in pathways. Nucleic Acids Res
40, 498–504 (2012).
61. Huang, D. W., Sherman, B. T. & Lempicki, R. A. Systematic and integrative analysis of large gene lists using DAVID bioinformatics resources. Nat Protoc4, 44–57 (2008).
62. Huang, D. W. et al. DAVID Bioinformatics Resources: expanded annotation database and novel algorithms to better extract biology from large gene lists. Nucleic acids research35, 169–175 (2007).
63. Saito, R. et al. A travel guide to Cytoscape plugins. Nat Methods9, 1069–1076 (2012).
Acknowledgements
We thank Agricultural Ministry Breeding Swine Quality Supervision Inspecting and Testing Center (Wuhan) for providing facilities and equipment for animal feeding and slaughter. Also we thank Wei Wei, Hong Cheng and Mingxing Liao for their assistance in measuring animal feed intake and performance. This study was supported financially by the National Outstanding Youth Foundation of NSFC (31025026), the doctor priority areas of development fund of ministry of education (21030146130001), and funding from Zoetis Animal Health, Inc.
Author Contributions
S.Z. was responsible for the experiment design. L.J. and Y.M. generated the tissue samples and isolated RNA for miRNA and RNA sequencing. L.J., X.L. and J.C. worked with the analysis of miRNA and RNA sequencing data. L.J. Y.H. and H.W. worked with the qPCR experiments of D.E. miRNA and RNA. L.J., J.B., T.P. and S.Z. were responsible for writing the manuscript. All authors read and approved the final manuscript.
Additional Information
Supplementary information accompanies this paper at http://www.nature.com/srep
Competing financial interests: The authors declare no competing financial interests.
How to cite this article: Jing, L. et al. Transcriptome analysis of mRNA and miRNA in skeletal muscle
indicates an important network for differential Residual Feed Intake in pigs. Sci. Rep.5, 11953; doi: 10.1038/srep11953 (2015).