University of Warwick institutional repository: http://go.warwick.ac.uk/wrap
This paper is made available online in accordance with
publisher policies. Please scroll down to view the document
itself. Please refer to the repository record for this item and our
policy information available from the repository home page for
further information.
To see the final version of this paper please visit the publisher’s website.
Access to the published version may require a subscription.
Author(s): Matthew S. Turner
Article Title: Two Time Constants for the Binding of Proteins to DNA
from Micromechanical Data
Year of publication: 2000
Link to published version:
Two Time Constants for the Binding of Proteins to DNA from
Micromechanical Data
Matthew S. Turner
Center for Studies in Physics and Biology, Rockefeller University, 1230 York Avenue, New York, New York 10021, U.S.A. and Department of Physics, Warwick University, Coventry, CV4 7AL, United Kingdom
ABSTRACT Recent experimental advances allow the direct measurement of the force/extension behavior for DNA in the presence of strongly binding proteins. Such experiments reveal information about the cooperative mechanism of protein binding. We have studied the irreversible binding of such proteins to DNA using a simple simulation and present a method for estimating quantitative rate constants for the nucleation and growth of linear domains of proteins bound to DNA. Such rate constants also give information about the relative energetics of the two binding processes. We discuss our results in the context of recent data for the DNA-recA-ATP␥s system, for which the nucleation time is 4.7⫻104min per recA binding site
and the total growth rate of each domain is 1400 recA/min.
INTRODUCTION
It is now possible to carry out precise micromanipulation of single molecules of protein or DNA molecules. These ex-periments have involved the use of both laser tweezers (Chu, 1991; Kellermayer et al., 1997; Hegner and Busta-mante, 1998; Hegner et al., 1999; Shivashankar et al., 1998; Shivashankar and Libchaber, 1998) and the Atomic Force Microscope (Rief et al., 1997; Shivashankar and Libchaber, 1997; Leger et al., 1998; Shivashankar et al., 1999) or combinations of both techniques. The force/extension data for such molecules can yield information about the macro-molecule’s entropic stiffness, length, and inter- and in-tramolecular binding (Leger et al., 1998; Marko and Siggia, 1995). In the current work, we will be interested in the effect of proteins binding to a single DNA molecule. Many proteins are known to bind strongly to DNA (von Hippel and McGhee, 1972). One such is recA, which binds to both single- and double-stranded DNA in the presence of either ATP or chemically modified ATP␥s (Stasiak et al., 1981; Egelman and Stasiak, 1986; Pugh and Cox, 1987, 1988; Shaner et al., 1987; Brenner et al., 1988; Pugh et al., 1989). ATP hydrolysis by RecA has been shown to render DNA strand exchange unidirectional (MacFarland et al., 1997). This suggests that suppressing ATP hydrolysis may have various physical consequences.
The biological role of recA is to control the organization of DNA during recombination (Alberts et al., 1994; Roca and Cox, 1990, 1997). Such DNA-protein complexes can have significantly different physical properties from bare DNA. For example, recA binds into the major groove of double stranded DNA causing partial local unwinding and extension of its contour length from 3.4 to 5.1 Å per base
pair (Stasiak et al., 1981). Each recA molecule occupies a site 3 base pairs in extent (Di Capua et al., 1982).
The binding of recA to DNA is known to be a stochastic, reaction-limited process that depends on the length of the DNA substrate (Pugh and Cox, 1987) and is highly coop-erative (Shaner et al., 1987). By measuring the rate of ATP hydrolysis, which depends on the extent of recA coverage on the DNA, the mean binding rate was previously esti-mated to be 300 recA/min (Pugh and Cox, 1988). There was no mechanical tension on the DNA in these experiments. In the presence of applied forces of 5 pN, Shivashankar et al. (1998) showed this could rise to 900 recA/min and Leger et al. (1998) showed that, over a range of applied forces from 15 to 100 pN, it varied between 300 and 3000 recA/min, respectively. These rates contain no information about chain-length dependence and are not directly comparable with the two separate nucleation and growth rates that are the focus of the present work. However, the mean rate of coverage may be obtained by simply dividing the number of recA sites at 100% coverage by the time taken to achieve full coverage. This rate is of the order of 900 recA/min for the data we use (Shivashankar et al., 1999), corresponding to DNA under a continuous force of 6 pN.
Applied forces have previously been shown to enhance the rate of recA binding (Leger et al., 1998). It is known that the applied force acts to do work on the DNA, thereby reducing the energy barrier to be overcome by recA during binding. A very crude estimate of the reduction in the energy barrier for binding of a single recA molecule to DNA in the presence of an applied force would involve constructing an energy from the product of the force (here 5– 6 pN) and the extension of the DNA contour per binding site (here 5 Å) to give a reduction of approximately kBT.
This is consistent with the observed difference in the mean rate by a factor of about 3 between Pugh and Cox (1988) and Shivashankar et al. (1999). Similar micromanipulation experiments could, in principle, be carried out in the
ab-Received for publication 13 January 1999 and in final form 10 November 1999.
Address reprint requests to Matthew S. Turner, Department of Physics, University of Warwick, Coventry CV4 7AL, U.K. E-mail: m.s.turner@ warwick.ac.uk.
MODEL AND OBJECTIVES
Here, we present a numerical scheme for extracting quan-titative protein–DNA binding rates. Our method allows us to determine the rate of nucleation of separate protein do-mains on DNA and the rate of growth of these dodo-mains. All that is required is a time trace of the fraction of occupied binding sites. For proteins that locally unwind or extend DNA when they bind, this may be obtained by monitoring the length of the DNA molecule.
Although we believe that our approach is quite general, we have in mind a comparison with experimental data from one particular set of micromechanical atomic force micros-copy experiments (Shivashankar et al., 1999). These authors claim to measure the maximum extended lengthLmaxof a
49-kb double-stranded -DNA molecule as a function of time after the addition of excess recA and ATP␥s. Because ATP␥s cannot be hydrolyzed, the step that removes recA from DNA (Egelman and Stasiak, 1986), recA-ATP␥s, can be thought of as binding irreversibly to DNA. In this context “maximum extended length” means the end-to-end distance of the DNA molecule under a large force, here 6 pN. This force puts the chain well into the nonlinear force/extension regime, where all the statistical segments of the chain are almost fully aligned. Nonetheless, it is not so large as to cause significant unwinding or unpairing of the bare double-stranded DNA. Under such large forces the difference be-tween the actual contour length of the DNA chain and the measured value of Lmax has been predicted to become
asymptotically small (Marko and Siggia, 1995). To be pre-cise, these authors show that, for large applied forces, the measuredLmaxand the real contour length differ by a factor
1/公4fA/kBT, wherefis the force applied to the DNA andA
its statistical segment length, typically a few hundred Ång-stroms. Taking f ⫽ 6 pN and A ⫽ 300 Å, one finds the difference to be only 7%.
We will assume in what follows that the length fraction of DNA decorated with bound proteinsis linearly related to
Lmax according to Lmax ⫽ constant (1 ⫹ (a ⫺ 1)) with
constantagiven by the ratio of the lengths of decorated to undecorated DNA per base pair. The effect of the differing rigidity of the decorated and undecorated DNA onLmaxwill
be small when the applied forces are large (Marko and Siggia, 1995). Similarly, significant unwinding of bare
-DNA has been shown to occur only at far higher forces, of the order of 50 pN (Leger et al., 1998).
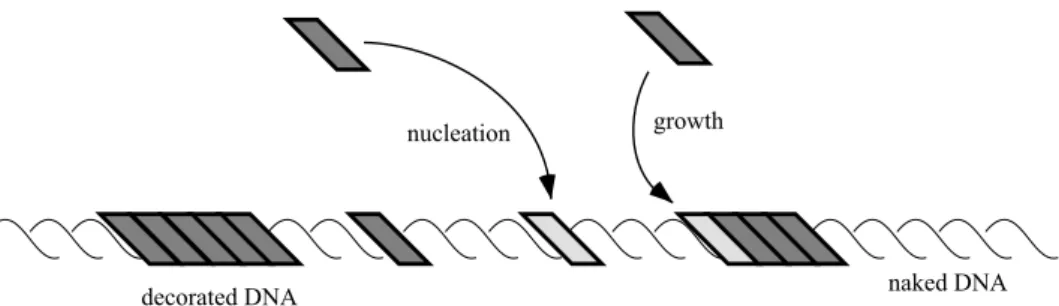
Our work is based on a simple nucleation and growth model that has recently been proposed elsewhere (Shivas-hankar et al., 1999). The basic tenets of this model are as follows: Proteins may bind at any of a large number of sites along the DNA double helix. This number is so large that we may choose to view the DNA as a continuum of binding sites. Both the energetics and, therefore, the rate of binding of a protein at a given site may depend strongly on the configuration of the DNA at neighboring sites, i.e., whether or not proteins are already bound there. It is this that causes the binding process to be cooperative. We make the further assumption that there are, effectively, only two such rates, corresponding to nucleation and growth events, see Fig. 1. A nucleation event corresponds to a protein binding to a region of DNA that is distant from any proteins already bound whereas a growth event corresponds to binding to a site that is adjacent to one that is already occupied. The motivation for distinguishing just two rate constants can be related to the microscopic properties of the protein–DNA complex. At the end of a protein-decorated domain, the DNA experiences a sharp drop in the forces by which the proteins drive its unwinding and extension. Similarly, the unwinding persists for only a very short distance into the undecorated DNA. For a discussion of a related effect see, e.g., Rudnick and Bruinsma (1999). Hence, the energetics of binding of recA to DNA change from that corresponding to a growth event to a nucleation event over this length-scale. Direct interprotein interactions, including hydrogen bonds, Van der Waals forces, etc., will be similarly short-ranged.
We further assume that there is no directionality in the binding process. It has been shown that the binding of recA to single-stranded DNA in the presence of ATP occurs in a 5⬘ to 3⬘ direction (Register and Griffith, 1985). However, the binding process to double-stranded DNA is rather dif-ferent, with little evidence for directionality (Shaner et al., 1987). Should the binding later be shown to be unidirec-tional, some modification of the present simulation would be necessary.
It is the goal of the present work to present a scheme for extracting the rates of both the nucleation and growth pro-cesses from experimental data for the time variation of the
FIGURE 1 A schematic representa-tion of the binding of proteins to a DNA molecule. For clarity, the DNA is shown artificially straight. Some pro-teins have already bound to the DNA at the time of this snapshot and are shown as grey boxes. Other proteins are shown in the process of binding to the lighter shaded sites via the nucleation and growth processes discussed in the text.
Simulated Binding of Proteins to DNA 601
decorated length fraction(t). These time scales will give important information regarding the cooperative mechanism of binding of the protein to DNA, as well as the ratio of the energy scales, from the usual Arrhenius relation. It will prove necessary to carry out a simple numerical simulation of the nucleation and growth process for two reasons. As discussed below, we have reason to believe that the existing analytic mean field model may be unreliable in our regime of interest, and secondly, we can demonstrate that this model fails to distinguish between the two different rates, rather being sensitive only to a geometric mean of the two. We first briefly review this mean field model before going on to discuss the results of our simulation.
ANALYTIC TREATMENT
It is possible to write down coupled differential equations involving(t), the length fraction of DNA decorated with protein, andn(t), the number of domains of bare DNA at timet after introduction of the binding protein. Within the analytic theory, end effects are neglected and the DNA is treated as if it were circular. Thus, the number of domains of naked DNA are equal to the number of domains of protein-decorated DNA.
The length fractionof decorated DNA increases during each growth and nucleation event. We make the assumption that the fraction of material deposited on the molecule during nucleation events is negligible. This assumption is equivalent to assuming that the maximum number of protein domains remains much less than the number of binding sites on the moleculeN. We will explicitly determine later that this assumption is self-consistent in the regime of interest. Thus,
˙ ⫽n/grow, (1)
wheregrowis a time scale defining the rate of growth of domain ends. As usual, it is merely the inverse of the corresponding rate constant. Note that there is no factor of 2 present in this equation because the rate is defined per domain, rather than per identical domain end.
The second equation defines the rate of change of the number of domains of decorated DNA. There will be two contributions to this. The first must account for the creation, via nucleation events, of new domains on previously bare regions of DNA. This rate is proportional to the length fraction of naked DNA remaining, 1 ⫺ , and to the nucleation rate, 1/nuc, which is the inverse of another, independent time scalenuc. The second contribution must describe the loss of domains due to the amalgamation of two regions of decorated DNA into one when their growing ends meet. The mean field probability of two neighboring do-main ends annihilating per unit time is proportional to both the growth rate 1/growand the inverse of the mean undec-orated length fraction between ends (1⫺)/n. This is the
rate per domain, and so another factor ofn is required to obtain the overall rate. Thus,
n˙⫽共1⫺兲/nuc⫺ n 2
共1⫺兲grow. (2)
As described in more detail elsewhere (Shivashankar et al., 1999), the following are exact analytical solution to the simultaneous Eqs. 1 and 2, as can be checked by substitution.
共t兲⫽1⫺exp关⫺t2/共2grownuc)] (3)
n共t兲⫽vtexp关⫺t2/共2grownuc)] (4)
Notice that they contain only a single characteristic time scale,
⫽
冑
nucgrow. (5)We will denote these the fast nucleation solutions because they are appropriate in the continuum regime,
1/N⬍⬍nuc/grow⬍⬍1. (6)
In this regime, the typical number of domains remains large (nuc/grow⬍⬍1) and the nucleation rate is sufficiently slow (1/N ⬍⬍ nuc/grow) that changes in due to nucleation events need not be included in Eq. 1.
There are two reasons why we should expect this model to start to fail whennuc/growⲏ 1 and the typical number of protein domains (at half coverage, say) does not greatly exceed unity. These are that the model explicitly treatsnas a continuous variable and also that it fails to properly take account of end effects. These two effects, as well as the mean field treatment of the domain annihilation rate, will be sources of error at the quantitative level in this regime. In spite of the approximations inherent in the analytic treat-ment, it does give an excellent one-parameter fit to exper-imental data (Shivashankar et al., 1999). This is so, even in the regime wherenuc andgroware comparable, which is strictly on the borderline of the models validity. However, in spite of this excellent qualitative agreement, we note that 1) the continuum results could be badly wrong at the quan-titative level and 2) no information is obtained about the ratio of the two time scalesnuc andgrow. The numerical simulation described in the next section provides a scheme for quantitative extraction of bothnucandgrow.
terms of Dirac delta functions (Dirac, 1982) and is given by
˙ ⫽ 1
grow
冋
1⫺1 2␦
冉
x⫺t
2grow
冊
⫺ 12␦
冉
1⫺x⫺t
2grow
冊册
. (7)Here, the first term involving a delta function includes the increase in coverage due to growth of the left end of the domain. This term correctly includes the contribution of this end only for timest⬍2growx, before it has reached the end of the DNA molecule. The second delta function plays an exactly analogous role for the right end of the domain.
When integrated and suitably averaged over x, Eq. 7 yields
共t兲⫽t/grow⫺共t/grow)2/4, (8)
which involves a single, new time scale depending only on
grow.
The regime of our present experimental interest happens to fall in the crossover regime between the fast and slow nucleation limits wherenucandgroware comparable. This motivates us to carry out a simple simulation of the nucle-ation and growth process, as described below.
Finally, we note that the constantsnucandgroware more mathematically natural units, but they depend implicitly on the length of the DNA. They can be related to corresponding microscopic (length-independent) time constants, denoted by an asterisk (ⴱ), by the relations
nuc⫽*nuc/N, (9)
whereNis the number of binding sites per chain and 1/nucⴱ is the rate of nucleation per site,
grow⫽*growN, (10) where 1/growⴱ is the rate of growth of the domain in binding sites per unit time. Thus, 1/growⴱ has the conventionally reported units of recA monomers per minute. The micro-scopic units are more physical and, unlikenucandgrow, do not depend implicitly on the chain length.
SIMULATION
In this section, we will describe the simple numerical scheme we used to model the nucleation and growth pro-cess. All times in our routine were recorded from the first nucleation event, which defined t ⫽ 0 for each run. In experiments, a lag time lag may be observed before this event. We will discuss this feature in more detail in the next section, but ignore it at present.
Our scheme proceeds as follows. For each run, the first nucleation event occurs at positionx, chosen randomly on [0, 1], and definest⫽ 0. The time step␦t is chosen to be sufficiently small to reproduce the nearly continuous growth process and to ensure that only very rarely do we miss multiple nucleation events in the same step. At each time
step the routine grows any existing domain ends a distance
␦t/(2grow) and a new nucleation event occurs with proba-bility␦t(1⫺)/nuc. If such a nucleation event does occur, it does so at a position chosen randomly on the unoccupied line fraction. Thus, at each time step, the routine records the position and length of each domain, and hence(t) andn(t) the number of undecorated DNA domains. Each run pro-ceeds until⫽1, at which time the data for the entireith run {i(t),ni(t)} are stored and the next i ⫹ 1th run is started. A total ofimax⫽1000 runs are performed. We then identify the appropriate statistical means as follows:
共t兲⫽imax1
冘
i⫽1 imaxi共t兲, (11)
n共t兲⫽i1 maxi
冘
⫽1imax
ni共t兲. (12)
The expected bounds onandnfor a single sample run from this ensemble are defined by the variances
n2共t兲⫽ 1 imaxi
冘
⫽1imax
(i共t兲⫺共t兲)2, (13)
n2共t兲⫽ 1 imaxi
冘
⫽1imax
共ni共t兲⫺n共t兲兲2. (14)
These variances do not in any way represent statistical error bars for our routine, these are so small as to be practically invisible at this scale, but rather, the stochastic variation between runs. Furthermore, the variances 2 and n2 are
rather loosely constructed insofar as we have not made use of the constraint that bothandnmust be nonzero. We do not consider this to be a source of significant error and retain the above definitions for simplicity. However, this is the reason why the one standard deviation envelope appar-ently includes unphysical negative values ofandnat early times in some runs, even though these values are never observed in the simulations. Our simulation data is now in an ideal format for comparison with the analytical results.
RESULTS
In this section, we will present our simulation data and will compare it with both the analytical solution and the single experimental data set of Shivashankar et al. (1999).
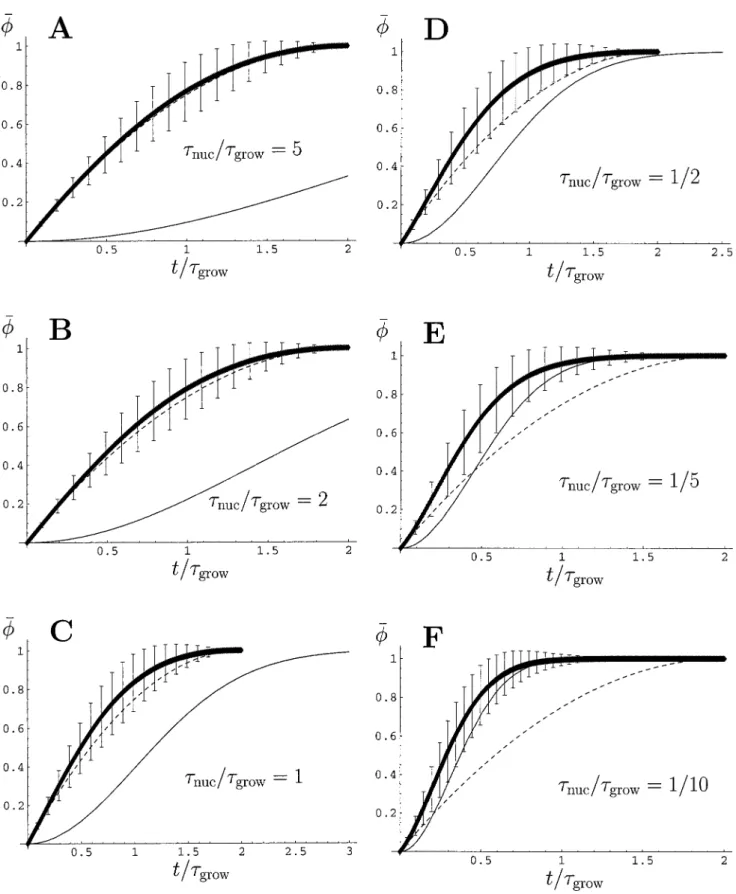
The analytic solutions are compared with our simulation results for(t) in Fig. 2,A–Fand forn(t) in Fig. 3,A–C.We observe that the simulations converge toward the appropri-ate analytic limits, but that there is significant departure from both whennuc/growis of order unity. The simulation results have all saturated after a maximum time 2grow, corresponding to the extreme case in which the only nucle-ation event occurs very close to the end of the molecule.
Simulated Binding of Proteins to DNA 603
FIGURE 2 The average length fraction of the molecule decorated with protein is plotted against time, measured in units of the growth timegrow, for
nuc/growequal to (A) 5, (B) 2, (C) 1, (D)1⁄2, (E)1⁄5, (F)1⁄10. The simulation results are shown as a thick line, and the bars represent one standard deviation
We must be cautious in comparing our results with a single experimental data set. This is because our simulations predict the mean decorated length fraction, obtained by averaging over many runs. Thus, our results should be compared with data similarly averaged over many experi-ments. For this reason, the present comparison should be treated with caution; it is not a truly reliable estimate of the reaction times. However, a similar caution also applies to direct comparison of the data with the analytic solution(s) because these are also implicitly averaged.
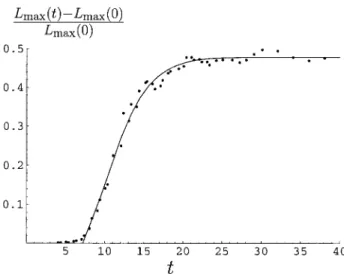
We fit the experimental data for [Lmax(t) ⫺ Lmax(0)]/
Lmax(0) directly to the rescaled simulation datac(t⫹lag) using a least squares method (See Fig. 4). The geometric scaling factor c ⫽ a ⫺ 1 relates the decorated length fraction to the change in maximum extended length. Bothc
and the lag time lag are fit parameters. Furthermore, the simulation data is extended according to(t⬍0)⫽0 and
(t⬎2grow)⫽1. There are two additional fit parameters, which may be thought of as nuc and grow, although we actually proceed as follows. The simulation data obtained for each value ofnuc/growis fitted to the experimental data usinggrowas a single-fit parameter. Thus, the data set that gives the overall best fit identifies grow, nuc/grow, and hencenuc. The least squares residues for various values of
nuc/groware shown in Fig. 5. The best fit values obtained werelag⫽7.2,nuc⫽2.9,grow⫽11.5 (all in minutes) and
c⫽0.48. These correspond to microscopic times ofnucⴱ ⫽ 4.7⫻104min per recA binding site and a total growth rate
of each domain of 1/growⴱ ⫽1400 recA/min. Thus, the ratio
nuc/grow⫽1⁄4is somewhat less than unity. In spite of this,
the quantitative agreement between the analytic solution in the fast nucleation limit and the simulation results is still not
FIGURE 3 The average number of domains on the DNA that are un-decorated with proteinnis plotted against time, measured in units of the growth time grow, for nuc/grow equal to (A) 5, (B) 1, (C) 1⁄5. The
simulation results are shown as a thick line and the bars represent one standard deviation bounds for the stochastic variation between runs. The solid line is the analytic result, Eq. 3, for the fast nucleation limit.
FIGURE 4 Best fit of the rescaled simulation resultsc(t⫹lag) to the
experimental data for the rescaled maximum extended length of the DNA molecule [Lmax(t) ⫺ Lmax(0)]/Lmax(0) obtained by Shivashankar et al.
(1999). The time axis is measured in minutes. The 4 fit parameters, with their best-fit values, werelag⫽ 7.2,nuc ⫽2.9, grow ⫽ 11.5 (all in
minutes) and the factorc⫽0.48, by which was rescaled.
Simulated Binding of Proteins to DNA 605
particularly good. It will be slightly poorer than that shown in Fig. 2E,for which nuc/grow⫽ 1⁄5. However, for
com-parison, we carry out a similar fit of Eq. 3 to the experi-mental data. The fit is 13% less good and yields the single time scale⫽ 公nucgrow⫽5.0 min with two additional fit parameters lag ⫽ 5.7 min and c⫽ 0.48. As emphasized above, such a fit can yield no information about the ratio of the timesnuc/grow. The ratio of the recA decorated to bare contour length per base pair,a⫽5.1/3.4⫽1.5, agrees well with the estimate 1 ⫹ c ⫽ 1.48 obtained by our fitting procedure.
The simulation results give an independent estimate of the nucleation time, which allows us, in principle, to deter-mine whether the lag time lag has a stochastic origin or whether it is an intrinsic mixing-related artifact. It is impos-sible to make a reliable statement regarding this issue from a single experimental data set, but we can say that it is not particularly unlikely that a lag time oflag⫽7.2 might arise from a stochastic (Poisson) process with meannuc ⫽2.9. One could make a more precise statement with data aver-aged over several experiments.
One additional source of information about the growth time can be identified from the data. To see this, note that the initial behavior is governed by the growth of the first domain according to (d/dt)兩t30⫽1/grow. By fitting to the
early data points, as shown in Fig. 6, we obtain an estimate of the growth timegrow⫽10.4 min, which is in reasonable agreement with the estimate of grow ⫽ 11.5 obtained by directly fitting to the simulation results.
Given an accurate estimate of the ratio nuc/grow, we would also be able to estimate the difference in energy barriers experienced by a protein binding at the end of a growing protein domain (a growth step) and one binding far from any previously bound proteins (a nucleation step). These will depend on the applied forces. Denoting the
height of these energy barriers for the data set shown in Figs. 4 and 6 asEg andEn, a simple Arrhenius argument
yields the rates for growth and nucleation per site as 1/(2growⴱ ) ⬀ exp[⫺Eg/kBT] and 1/(nucⴱ ) ⬀ exp[⫺En/kBT],
respectively. The factor of 2 in the denominator of the growth rate arises from the assumption that there are two potential growth sites per domain, one at each end. Note that it is appropriate to use the microscopic time constants here, see Eqs. 9 and 10. These relations combine to produce
En⫺Eg⫽kBTloge
冉
*nuc2*grow
冊
⫽kBTloge
冉
nucN22grow
冊
, (15)where 49 kb-DNA possessesN ⫽ 16,300 recA binding sites. Using this, and our crude estimatenuc/grow⫽1⁄4, we
obtain En ⫺ Eg ⫽ 17kBT ⫽ 10 kcal/M. This estimate is independent of the protein concentration in the reaction-limited regime. Separate estimates ofEnandEgfrom nuc andgrow would depend on the protein concentration and would require a more detailed model of the dynamics.
CONCLUSIONS
In conclusion, we have presented a technique for extracting both the characteristic nucleation and growth times for the formation of protein-decorated domains on a DNA mole-cule. We do this given only the time dependence of the DNA coverage.
FIGURE 5 Plot of the least squares fit residue (vertical axis), in arbitrary units, obtained by fitting the experimental data (Shivashankar et al., 1999) to our simulation results for(t). The comparison is made with simulation data obtained for several ratios ofnuc/grow, as shown.
FIGURE 6 Plot of a linear regression fit for [Lmax(t)⫺Lmax(0)]/Lmax(0)
over the 7 data points betweent⫽7.4 andt⫽10.4 min, representing the early stages of coverage of the DNA by recA. The time axis is measured in minutes. The data reaches a plateau [Lmax(t)⫺Lmax(0)]/Lmax(0)⫽0.48
at late times. This corresponds to full coverage of the DNA by recA molecules. Very soon after coverage starts to increase, one expects a single domain to be present. The initial slope is 0.046 min⫺1, which corresponds
Ideally, our technique requires data averaged over many identical experiments. However, for the single set of data available for the -DNA recA-ATP␥s system, we crudely estimate that these times arenuc⫽2.9 min, corresponding to 4.7⫻ 104min per recA binding site, andgrow ⫽ 11.5
min, corresponding to 1400 recA/min per domain. In prin-ciple, our technique also allows us to determine whether any experimental lag times are stochastic in origin or are mixing related artifacts.
The author thank Mario Feingold, G. V. Shivashankar, Albert Libchaber, and O. Krichevsky for numerous discussions and the initial inspiration for this work.
Support from the W. M. Keck foundation, the Burroughs Wellcome fund and the Royal Society is gratefully acknowledged.
REFERENCES
Alberts, B., D. Bray, J. Lewis, M. Raff, K. Roberts, and J. D. Watson. 1994. Molecular Biology of the Cell. Garland, New York.
Brenner, S. L., A. Zlotnick, and J. D. Griffith. 1988. RecA protein self-assembly—multiple discrete aggregation states. J. Mol. Biol. 204: 959 –972.
Chu, S. 1991. Laser manipulation of atoms and particles.Science.253: 861– 866.
Di Capua, E., A. Engel, A. Stasiak, and T. Koller. 1982. Characterization of complexes between recA protein and duplex DNA by electron-microscopy.J. Mol. Biol.157:87–103.
Dirac, P. A. M. 1982. The Principles of Quantum Mechanics. OUP, Ox-ford, U.K.
Egelman, E. H., and A. Stasiak. 1986. Structure of helical recA-DNA complexes formed in the presence of ATP-␥-s or ATP.J. Mol. Biol.
191:677– 697.
Hegner, M., and C. Bustamante. 1998. Stretching individual recA-DNA filaments with optical tweezers.Biophys. J.74:A150.
Hegner, M., S. B. Smith, and C. Bustamante. 1999. Polymerization and mechanical properties of single recA-DNA filaments.Proc. Natl. Acad. Sci. USA.96:10109 –10114.
Kellermayer, M. S. Z., S. B. Smith, H. L. Granzier, and C. Bustamante. 1997. Folding-unfolding transitions in single titin molecules character-ized with laser tweezers.Science.276:1112–1116.
Leger, J. F., J. Robert, L. Bourdieu, D. Chatenay, and J. F. Marko. 1998. RecA binding to a single double-stranded DNA molecule: a possible role
of DNA conformational fluctuations.Proc. Nat. Acad. Sci. USA.95: 12295–12299.
MacFarland, K. J., Q. Shan, R. B. Inman, and M. M. Cox. 1997. RecA as a motor protein—testing models for the role of ATP hydrolysis in DNA strand exchange.J. Biol. Chem.272:17675–17685.
Marko, J. F., and E. D. Siggia. 1995. Stretching DNA.Macromolecules.
28:8759 – 8770.
Pugh, B. F., and M. M. Cox. 1987. Stable binding of recA protein to duplex DNA.J. Biol. Chem.262:1326 –1336.
Pugh, B. F., and M. M. Cox. 1988. General mechanism for recA protein binding to duplex DNA.J. Mol. Biol.203:479 – 493.
Pugh, B. F., B. C. Shutte, and M. M. Cox. 1989. Extent of duplex DNA underwinding induced by recA protein binding in the presence of ATP.
J. Mol. Biol.205:487– 492.
Register, J. C. III, and J. Griffith. 1985. The direction of recA protein assembly onto single stranded SNA is the same as the direction of strand assimilation during strand exchange.J. Biol. Chem.260:12308 –12312. Rief, M., M. Gautel, F. Oesterhelt, J. M. Fernandez, and H. E. Gaub. 1997. Reverse unfolding of individual titin immunoglobulin domains by AFM.
Science.276:1109 –1111.
Roca, A. I., and M. M. Cox. 1990. The recA protein: structure and func-tion.Biochem. Mol. Biol.25:415– 456.
Roca, A. I., and M. M. Cox. 1997. RecA protein: structure, function and role in recombinational DNA repair.Prog. Nuc. Acid Res. Mol. Biol.
56:129 –223.
Rudnick, J., and R. Bruinsma. 1999. DNA–protein cooperative binding through variable-range elastic coupling.Biophys J.76:1725–1733. Shaner, S. L., J. Flory, and C. M. Radding. 1987. The distribution of
Escherichia colirecA protein bound to duplex DNA with single stranded ends.J. Biol. Chem.262:9220 –9230.
Shivashankar, G. V., and A. Libchaber. 1997. Single DNA molecule graft-ing and manipulation usgraft-ing a combined atomic force microscope and an optical tweezer.Appl. Phys. Lett.71:3727–3729.
Shivashankar, G. V., G. Stolovitzky, and A. Libchaber. 1998. Backscat-tering from a tethered bead as a probe of DNA flexibility.Appl. Phys. Lett.73:291–293.
Shivashankar, G. V., and A. Libchaber. 1998. Single molecule observation of duplex DNA extension by recA.Biophys. J.74:A242.
Shivashankar, G. V., M. Feingold, O. Krichevsky, and A. Libchaber. 1999. RecA polymerization on double-stranded DNA by using single molecule manipulation: the role of ATP hydrolysis.Proc. Natl. Acad. Sci. USA.
96:7916 –7921.
Stasiak, A., E. Di Capua and T. Koller. 1981. Elongation of duplex DNA by recA protein.J. Mol. Biol.151:557–563.
von Hippel, P. H., and J. D. McGhee .1972. DNA–protein interactions.
Annu. Rev. Biochem.41:231–300.
Simulated Binding of Proteins to DNA 607