UNIVERSITY OF TWENTE
ANALYSIS OF SYSTEM USAGE AND KNOWLEDGE DEVELOPMENT
OF THE CURRENT PAL SYSTEM FOR CHILDREN WITH TYPE 1 DIABETES MELLITUS.
Master Thesis By
Anika Boelhouwer
Department of Cognitive Psychology and Ergonomics
For the degree of: Master of Science, Psychology
Supervisors: Martin Schmettow Jan-Maarten Schraagen Mark Neerincx
2 Abstract
Children who are diagnosed with type 1 diabetes mellitus need to learn a lot about diabetes and self-management in a short period of time. A large problem in the support of this process is that health institutions cannot provide help at any given moment in the child life and are bounded by set face to face appointments. While digital interventions may address this issue by providing help and
knowledge online which may be used at all times, this help and knowledge is general and not tailored to the individual. Also, actual usage of (digital) diabetes interventions has shown to be either
extremely low or quickly decreasing. The Personal Assistant for a healthy Lifestyle project (PAL) strives to address these issues by providing a digital application with personalised communication and content. This study evaluated the current PAL application during a prolonged period of time with children diagnosed with type 1 diabetes mellitus between the ages of 6 and 12 years old. The main goals were to identify trends and possible predictors for both system usage and diabetes knowledge development. Three main trends were found in the system usage in which the majority of the users showed an overall low usage or quickly decreasing usage. A small number of users showed continuous and consistent usage throughout the entire experiment. As the personalisation was only minimally implemented the results are in line with common (digital) diabetes interventions. The results did not allow us to explore possible system usage and knowledge development predictors. They do however provide a solid baseline for further versions of the system in which the
personalisation is further implemented. The main recommendations are to focus on the
3
Table of contents
1. Introduction ... 5
2. Background ... 8
2.1 PAL project... 8
2.1.1 Pal Prototype ... 8
2.1.2 Pal evaluation cycle ... 11
2.2 Diabetes self-management ... 12
2.2.1 Definition ... 12
2.2.2 Knowledge development as self-management determinant ... 12
2.3 System usage ... 13
2.4 Longitudinal research ... 13
2.4.1 Definition and characteristics ... 14
2.4.2 Longitudinal study designs ... 14
2.4.3 Necessity of longitudinal research in HCI ... 15
2.5 Individual difference in system usage and knowledge development... 16
2.5.1 System usage ... 16
2.5.2 Knowledge development ... 18
3. Methods ... 20
3.1 Participants ... 20
3.2 Materials ... 21
3.2.1 Questionnaires ... 22
3.2.2 Semi-structured interviews ... 23
3.2.3 Information letters and informed consent ... 23
3.2.4 Audio and video recording ... 24
3.2.5 Statistical computing programs ... 24
3.3 Design ... 24
3.3.1 Experiment overview ... 24
4
3.3.3 Procedure ... 25
3.4 Measures ... 26
3.4.1 Explanatory variables ... 26
3.4.2 System usage - timeline ... 27
3.4.3 System usage – Quiz ... 27
3.4.4 Knowledge development ... 28
3.5 Analysis ... 28
3.5.1 Data preparation ... 28
3.5.2 System usage – timeline data ... 29
3.5.3 System usage – quiz data ... 29
3.5.4 Knowledge development ... 29
4. Results ... 30
4.1 System usage ... 30
4.1.1 System usage –timeline ... 30
4.1.2 System usage – quiz ... 34
4.2 Knowledge development ... 36
5. Discussion ... 37
References ... 41
Appendix A Diabetes know and do goals ... 45
Appendix B Outcome variables ... 48
5
1. Introduction
During the end of the 20th and beginning of the 21st century, the number of children with type 1 diabetes mellitus has steadily increased (Gale, 2002). This disease has a great impact on both individual as societal level. For a patient, it can lead to severe short- and long term health
complications such as nerve-, eye- and foot damage or cardiovascular diseases (Tsukuma et al., 1993). Furthermore, the onset of the disease can induce prolonged stress not only for the patient, but also for their parents and siblings as the recent study of Streisand, Swift, Wickmark, Chen and Holmes (2005) showed. For the society, an increase in patients who need intensive and chronic patient support and medication means an increased amount of healthcare costs, and need for healthcare professionals. Accurate self-management and continuous self-care is required of both the patient and parents in order to reduce risks on serious health care complications (Shrivastava, Shrivastava, & Ramasamy, 2013; Diabetes Control and Complications Trial Research Group, 1993) and to increase the patients and parents overall quality of life (Jaser et al., 2012). Fewer health problems due to poor self-management in diabetes patients may then also reduce societal health costs (Boren, Fitzner, Panhalkar, & Specker, 2009).
Although diabetes self-management skills play a large role in preventing health
complications, acquiring these skills can be particularly hard for children as they are still developing physically, mentally and emotionally. They need to control their carbohydrate intake, physical activity, monitor blood sugar levels and manage the insulin that needs to be injected. Calculating carbohydrate intake and the needed insulin dosage, combined with self-care and other activities such as school and social life can be complex and overwhelming for (recently) diagnosed children. Even though they are supported by healthcare professionals, these appointments are periodic and can’t provide tailored help at all times. As a result, taking over the diabetes management causes many parents to experience paediatric parenting stress. This may increase risk of mental health problems (Streisand, Swift, Wickmark, Chen, & Holmes, 2005), and negatively impact the child’s
self-management skills by reducing their autonomy (Streisand, Swift, Wickmark, Chen, & Holmes, 2005). In order for diabetes education to be as effective and efficient as possible it should be
6 The Personal Assistant for a healthy Lifestyle project (PAL) of the European Horizon 2020 research program strives to induce active user engagement through personalization. The system will use the user’s preferences, characteristics and learning goals to personalise communication and education through a robot and application and ensure a long term relationship between the robot (avatar) and the child (Janssen, van der Wal, Neerincx, & Looije, 2011). By providing a learning style that keeps adapting to the child’s needs, and following the zone of proximal development, the child is challenged in his learning but not overwhelmed (Kozulin, Gindis, Ageyev, & Miller 2003). By automatically adapting to the child’s preferences and needs, the robot might support the intrinsic motivation by elements of the self-determination theory: autonomy, competence and relatedness (Ryan & Deci, 2000). This theory is the base for many of the PAL project design choices to stimulate motivation. The children are supported in their autonomy, as they are presented with and asked how they would solve complex (diabetes related) situations in the quiz. Competence is stimulated by offering new tasks and goals for the child to reach. The relatedness to the social robot is created as it both behaves towards the preferences of the user, and engages in mutual self-disclosure to create a personal bond. It important to note that the current system includes a minimal amount of personalisation. This includes the incorporation of personal goals but excludes any personalized communication or feedback. In the PAL system, a robot for initial play and support was chosen as a physical
conversational agent as it was shown to have a considerable impact on initial motivation, feelings of relatedness and learning (Blanson Henkemans et al., 2013). As it is not practically feasible to supply a great number of children with a robot over a long period of time, a digital version of the robot and interaction was chosen in the form of an application (with a quiz and timeline) and an avatar of the robot. This combination ensures the motivational benefits of a physical robot, with the prolonged interaction possibilities of the application. The quiz was chosen as a first game within the application as this was identified as one of the most positively rated games during a previous PAL pilot study, while also providing a platform for validation and development of diabetes knowledge in the participating children (Blanson Henkemans et al., 2013). Other apps like MySugr (http://
mysugr.com) have been using a similar construct of a quiz and timeline but have not incorporated personalised communication and learning.
Two main challenges arise in the development of the PAL system which need to be addressed for the system to be developed as effective as possible in further stages. The first challenge in the development of the PAL system is that it is unclear to what extend the current system contributes to actual knowledge development about diabetes and self-management in children. Also, there might be factors that directly influence differences in knowledge development. Some of these may be
7 knowledge by providing a personalised learning environment with tailored communication and learning challenges. The second challenge is that recent human computer interaction (HCI) research has revealed that the actual continuous usage of digital (health) interventions is scarce. Many patients show a severe decrease in usage as time passes or even show an initial low use of health interventions. For most intervention products to be beneficial, prolonged optimal use is deemed necessary for it to have a long-term effect. However, whether this prolonged use is actually performed by the patients is often not researched in a longitudinal study due to practical reasons like costs (Gerken, 2011). Any trends in system usage of the PAL system over time need to be identified to see if the system can accurately motivate children to keep using the system over a prolonged period. Also, in order to improve the personalization of the system communication and stimulate a prolonged use in children, possible predictors for system usage need to be identified. For example, perceived fear has been identified as a factor that promotes positive health behaviours (Venkatesh, Morris, Davis, & Davis, 2003). The perceived threat of their diabetes and possible complications may influence the motivation of a patient to perform positive health related behaviour, which in this case is using the PAL system. To address these problems, this thesis strives to answer two main questions: “What kind of system usage and knowledge development patterns arise during a prolonged use of the current PAL system?” and “Which factors may contribute to individual differences in system usage and knowledge development during a longer period of use of the PAL system?”. At the start and end of the
experiment, the children will interact with the PAL robot and application at the hospital. During the experiment, children will be free to interact with the PAL application for four weeks at their own home. Any patterns in system usage and knowledge development are researched through repeated measuring of the system data during the experiment. This use of repeated measures will allow for inspection of individual system use and knowledge developments. In order to identify specific factors which may contribute to differences in system usage and knowledge development, this study will first perform a literature research to get a global overview of possible factors. Main criteria for these factors are that they may be (indirectly) addressed by the personalised system, or are general mediator variables to take into account. Including additional factors could be interesting in a research point of view but will result in an incomprehensible amount of factors and may most likely not be useful for the practical further development of the system.
In conclusion, this study will answer the following question: “What kind of patterns of system usage and knowledge development arise during prolonged voluntary use of the current PAL system, and which factors might contribute to individual variances in system use and knowledge
development?”. We answer this question by combining a literature research on possible predictors for system usage and knowledge development, with a longitudinal experiment with the current PAL system for the identification of patterns possible predictors for system usage and knowledge
8
2. Background
2.1 PAL project
The PAL project strives to develop a learning system for children with diabetes to learn about and assist them in the management of their diabetes. The system needs to adapt its communication to the user in order to create an adaptive learning situation for different kind of users. The following section describes the total PAL system and consequently the total PAL four year project analysis cycle. This current explorative study takes place during the first project year and is a formative evaluation. 2.1.1 Pal Prototype
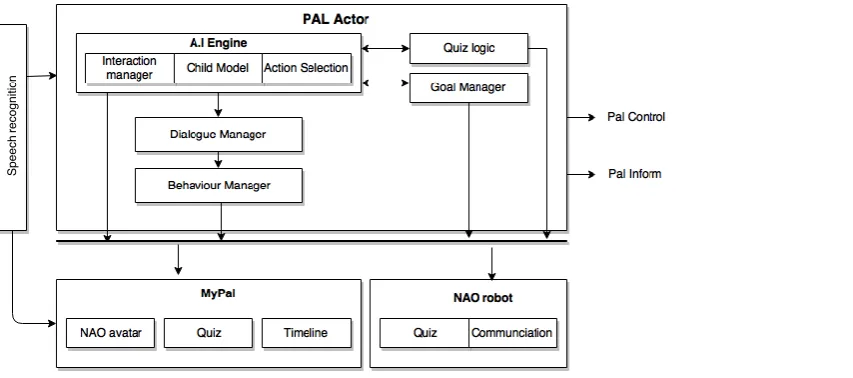
[image:8.595.71.498.575.764.2]The current PAL prototype consists of a physical NAO robot, its avatar, MyPal, Pal Control and Pal Inform. For this study and experiment the main focus lies on the NAO robot and MyPal application. Children can play a quiz on both diabetes related and general questions with the NAO robot, and interact with him through speech and touch. The MyPal app consists of multiple sections: a quiz and the timeline section. Both of these PAL elements will be explained in more detail throughout this chapter. The avatar in the MyPal application is a digital representation of the physical robot and communicates in the same way. PalControl enables the diabetes healthcare professional to enter and adapt self-management learning goals for their patients. These goals will be visible in the MyPal and Pal Monitor apps. PalMonitor allows parents to see an overview of the child’s condition and progress on their learning goals. PalControl and PalMonitor will be left out of the scope in this study, as they are not fully implemented in this year’s experiment, and lie beyond the goals and interests of this particular study. The so called PALActor is the underlying reasoning mechanism which manages all behaviours of the robot in both its physical and virtual form in the MyPal app. It also manages the goals of the child and quiz. Interaction with the system will thus be consistent throughout the experiment and across platforms, as the avatar and robot share the same underlying reasoning mechanism. Further versions of the system will manage the personalised communication and content based upon the continuous information it receives on the child’s preferences, goals and status through the quiz, timeline and communication. Figure 1 shows an overview of the system and its components.
9 Nao Robot
The NAO robot, as illustrated in figure 2, is a small humanoid robot that has been used for multiple purposes like health research and education. Many examples of studies that used a NAO can be found in therapy. Shamsuddin et al. (2012) used the NAO for research on robot interactions with autistic children, and how robotics may play a role in future interaction therapy. Kose, Yorganci, Algan and Syrdal (2012) described how a NAO robot can be of assistance in the learning of sign language. The robot can move around freely, lay down, get up and make hand gestures. The sensors in his limbs and head, as well as the cameras and microphones allow him to perceive and act on his environment or users. Communication with others around him can be done by speech and movement of arms, hands and head. The NAO derives what actions he has to take from an action selection module. This module assesses the quality of proposed action suggestions given by a Natural
Multimodal Interaction Module (NMIM). It does this based upon the current state of the child and its preferences through speech recognition and learning goals as set by the health care professional.
For this study, the NAO interacts with the patients and plays a quiz with them about diabetes and general topics. The diabetes related questions for the quiz were constructed on the base of the know- and do goals as set by the Expertisegroup Paediatric Diabetes Nurses (EPDN). The questions were validated and altered by diabetes healthcare professionals in the cooperating hospitals, and sorted on difficulty level. Categories on which the avatar may present diabetes related questions are: blood glucose, insulin, food, physical activity, hypo and general. An overview of these goals are situated in appendix A. The general non-diabetes related questions were derived from the prior robot interaction research ALIZ-E by TNO. Any interactions outside the quiz range from small talk to walking together. All interactions will be personalised towards the child in further system versions, based on his goals, preferences and the situation to encourage a long-term relationship with the system and stimulate motivation to learn diabetes self-management behaviours.
[image:9.595.79.507.545.733.2]
10 MyPal
The MyPal application consists of three elements: the NAO avatar, timeline and quiz. The NAO avatar is a digital representation of the physical NAO and is connected to the same underlying reasoning system and database. Its general interaction is therefore the same, apart from physical restrictions such as the ability to walk together. To foster a long-term relationship with the system (and NAO) and motivate the child to use the application, the avatar responds to entries the child makes in the timeline and answers he gives in the quiz. Communications may be encouragements to the child to tell more about a certain activity, or casual conversations that fit the situation. These interactions will be personalised to the child’s goals, preferences, MyPal entries and situation to create both an adaptive learning environment and relatedness through human-like communication. However, in the current version the personalisation has not been fully implemented. While there is still feedback on interactions, this is not personalised to the users characteristics or his development. The application further includes a virtual quiz. Just as with the physical robot, the avatar will present both diabetes and non-diabetes related questions based on the child status, progress and learning goals.
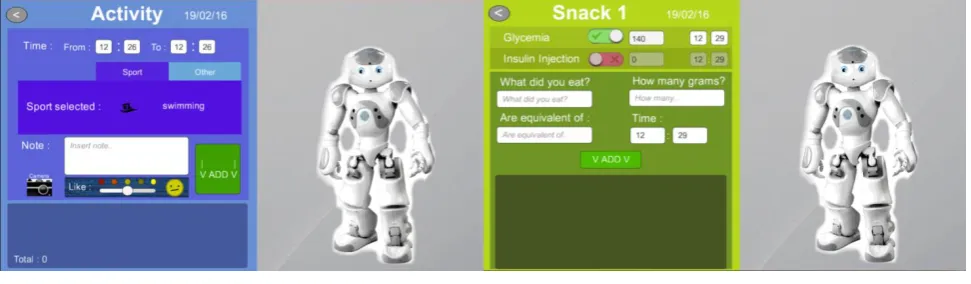
[image:10.595.70.556.519.661.2]The timeline in MyPal provides the child with the possibility to enter daily events with or without the help of the NAO avatar. In the timeline one can enter data on food, activity and glycaemia values. When adding a meal, the child can enter how much and what he or she ate. It is optional to enter whether the glycaemia levels were measured, and if an insulin injection was administered. In the activity section, the child can enter what activity he or she performed, and for how long. The child can write notes and disclose any emotions. In the glycaemia section, the child can enter measured values, how he or she corrected them, and optionally write additional notes. Figure 3 shows two sections of the timeline.
11 2.1.2 Pal evaluation cycle
The total project evaluation of the PAL system will be done in three cycles of one year. The
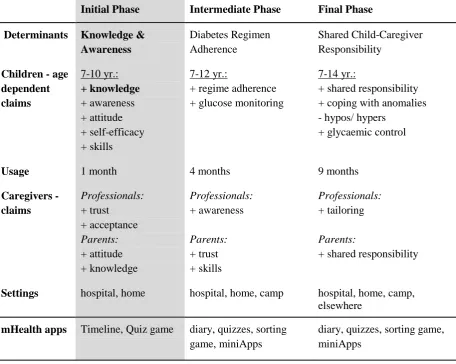
development takes an iterative design approach as after each cycle, the system is tested, and adjusted according to results. An overview of the three development cycles can be found in table1. Every cycle increases the scope of evaluation by increasing the usage duration period, the age range of the
[image:11.595.76.533.380.744.2]participating children and focus of self-management development. The project is currently in cycle one, which focusses on the development of five determinants of diabetes self-management in children. These determinants are knowledge, awareness, attitude, self-efficacy and skills. Acceptance and trust of healthcare professionals and parents in the system are also included during the evaluation. During this stage, the project focusses on the age group from 7-10 years old. The elements that are tested in the MyPal application are the quiz, avatar and timeline for the duration of one month. For this thesis, the emphasis will remain on the evaluation of development of diabetes related knowledge and system usage. An overview of the experiment is described in chapter 3.
Table 1.
Overview of the three design cycles of the PAL system.
Initial Phase Intermediate Phase Final Phase
Determinants Knowledge & Awareness
Diabetes Regimen Adherence
Shared Child-Caregiver Responsibility
Children - age dependent claims 7-10 yr.: + knowledge + awareness + attitude + self-efficacy + skills 7-12 yr.:
+ regime adherence + glucose monitoring
7-14 yr.:
+ shared responsibility + coping with anomalies - hypos/ hypers
+ glycaemic control
Usage 1 month 4 months 9 months
Caregivers - claims Professionals: + trust + acceptance Parents: + attitude + knowledge Professionals: + awareness Parents: + trust + skills Professionals: + tailoring Parents:
+ shared responsibility
Settings hospital, home hospital, home, camp hospital, home, camp, elsewhere
mHealth apps Timeline, Quiz game diary, quizzes, sorting game, miniApps
12 2.2 Diabetes self-management
As the main purpose of the PAL system is to stimulate and support the diabetes management of diabetic children, it is important to understand what this self-management exactly entails. The following section describes diabetes self-management and self-care behaviours that accompany this. Then, the knowledge determinant for performing diabetes self-management, and why this thesis chooses to investigate knowledge development is described.
2.2.1 Definition
Self-management of one’s health is generally accepted to be not just any kind of self-care behaviours such as personal hygiene maintenance. It refers to behaviours and processes which are specifically required to manage (outcomes of) a (chronic) disease (Lorig & Holman, 2003). Although there have been multiple definitions in healthcare research, this thesis assumes the definition by Modi et al. (2012) which defines self-management as “the interaction of health behaviours and related processes that patients and families engage in to care for a chronic condition (p. 475)”. The reason for this is that they do not only take the individual patient, but also the close social circle into consideration. The self-management of a disease often exceeds ‘just’ the patient himself. The family and close social circle often perform similar behaviours and processes to manage the disease. In the context of the PAL project all patients are children, which makes this involvement of family an important aspect to include. For diabetes patients, self-management includes the management of blood glucose, adherence to medical plans, making dietary adaptations, (planning) physical activity and making psychosocial adaptations (Mulcahy et al., 2003). For parents, support of the child’s self-management mainly entails the supervision and support on all these aspects, while providing access to healthy nutrition, exercise and healthcare (Modi et al., 2012).
2.2.2 Knowledge development as self-management determinant
For performing actual self-management patients will experience driving factors (determinants) which encourage the behaviour such as attitude, and barriers which inhibit the behaviour such as high costs. The total PAL project aims to assess five behavioural determinants during the first cycle evaluation: knowledge, awareness, attitude, self-efficacy and skills.
13 patients due to their young age and needs to be developed.
The Dutch Expertisegroup Paediatric Diabetes Nurses (EDPN) has constructed a description of so called ‘know and do goals’. This document contains all major knowledge and skills children with diabetes are expected to obtain at a certain age. This document was converted into a list of specific goals for each age group (6-7, 8-9, 10-11 years), and indicated with a difficulty level. Goals that should be obtained between the ages of 6-7 are level 0, goals between the ages of 8 and 9 are level 1 and goals between the ages of 10 and 11 are level 2. Goals for older children are left out of consideration as only children between the ages of 6 and 10 years old will be studied during the evaluation of this development cycle. For this study the focus will remain on the knowledge goals, which are represented in table 1 in appendix A. The knowledge goals are divided into six categories which constitute knowledge of: blood glucose, insulin, food, physical activity, hypo and general diabetes knowledge. These categories represent the needed knowledge of the self-management behaviours the children have to develop. For example, learning how to monitor your blood glucose is related to the self-management act of actually measuring the blood glucose levels. These knowledge goals are represented and aimed to achieve by diabetes related quiz questions in the MyPal
application.
In conclusion, as a positive knowledge development may improve the self-management behaviours of children with diabetes, development of diabetes related knowledge is set (besides system usage) as a main parameter to investigate in this research.
2.3 System usage
Given that most healthcare products and interventions are developed for an extended period of use by the patient, one would expect that both the effects and use of interventions are still being evaluated after a longer period of time. Limited resources like money and personnel is however one of the reasons that this does not happen for the majority of developed interventions (Gerken, 2011). Creating an intervention which ends up never being used is of course never the intention of a study. However, by not investigating the system usage over an extended period of time, one can never be sure whether and how it is still being used let alone whether any effects of the treatment remain after a longer time period. Furthermore, the few studies that do take a longitudinal approach in intervention system development, for example that of Van Gemert-Pijnen, Kelders, & Bohlmeijer (2014), report a stalling of continuous and thorough usage over time. This might pose serious issues for the possible effects of the intervention, as it cannot help if it is not used.
2.4 Longitudinal research
14 2.4.1 Definition and characteristics
While the precise definition varies among researchers, a common ground is found in the basic assumptions of longitudinal research. These assumptions or conditions are that data on a specific variable is measured through multiple distinct periods, and some form of comparison of the data of different periods (Menard, 2002; Ployhart, & Vandenberg, 2010). Although the study of Ployhart and Vandenberg (2010) argue that a longitudinal study should contain at least three data gathering periods, and Menard (2002) stated that two are the bare minimum, most studies agree on the statement of Willet (1989) that more data gathering periods result in more reliable measurement of change. This is however often accompanied by higher costs in both administrating and analysing more data gathering periods.
In longitudinal research designs, as in cross-sectional research, the chosen sample and comparison style such as within participant or between participants comparison are still important. More interesting however is the importance of study duration and data-gathering schedule.
Determining the study duration is of great importance regarding the research question. Certain developments may take (more or less) time depending on what is measured. For example, in a study on the relation between smoking and lung cancer, it may be necessary to study participants for more than 10 years to see effects. In the case of the PAL study, the development of knowledge on diabetes self-management may be most relevant to study for several months, to examine initial system usage and the first developments in knowledge and behaviour. However, additional research after a longer period of time may be useful to examine long-term adherence and sustained effects in knowledge and behaviour.
2.4.2 Longitudinal study designs
Although recent HCI studies report a variety of longitudinal study designs as most common, these can be divided into three main study designs: panel, retrospective panel and repeated cross-sectional (Gerken, 2011; Menard, 2008). A repeated cross-sectional design entails repetition of data periods during which each period another comparable sample of participants is observed (Menard, 2008). The main reason for using this design is that in many cases participants don’t want to, or simply can’t, participate in the study for a considerable time length such as 20 years. Also, by introducing new participants every data gathering period, development processes inherent to the individual will less bias the overall picture of the investigated change process (Gerken, 2011).
Panel study designs studies the same sample of participants over different periods of time by several data gathering moments. In general, four retrospective designs can be distinguished. The repeated sampling method includes just one test period and two data gathering points (at the
15 considered a prospective panel design. For prospective panel designs several cautions need to be mentioned. Self-report data from one measure moment might influence what answer the participant gives the following data gathering moments (Trivellato 1999). It might also be that the participant develops not through the intervention, but mere from participation in the study (Menard 1991). Longitudinal case studies, which are a part of prospective panel design, investigate a smaller sample for a longer period of time with the main goal to further observe and understand particular behaviours. The revolving panel design aims to address these issues which may cause bias in the results by
introducing new participants and letting some participants go in the sample every period. This allows the researchers to investigate potential external influences by comparing with the new unbiased participants. The retrospective panel design includes only one data gathering moment. During this gathering, data is collected from multiple times in a particular period in the past. One form may be a retrospective interview. Data gathered from retrospective interviews may be very prone to recall bias, and is therefore often only applied to factual life events such as time of marriage unless the research question related to interests in for example beliefs and perceived experience (Buck et al. 1995). Shortening the period on which data is gathered may diminish recall bias.
2.4.3 Necessity of longitudinal research in HCI
Even until a few years ago, very little practical longitudinal studies with repeated measures were performed in the field of HCI (Ployhart & Vandenberg, 2010). But increasing attention to the topic during conferences and multiple researches advocating the benefits and necessity of this research method have made longitudinal research of increasing interest in practical HCI studies. Still, longitudinal references studies for HCI in healthcare, particularly in the combined setting of a controlled and uncontrolled environment are scarce. Reasons why the method is not yet widely applied are mainly bureaucratic. High costs and an increase in time and effort in conducting the experiment compared to a cross-sectional study, as well as the difficulty of finding participants who are willing to commit for a longer period are perceived as great barriers (Gerken, 2011). More methodological barriers related to longitudinal research are difficulty in obtaining valid results. Issue in obtaining valid results over time can relate to sampling biases, conditioning effects (Cantor, 2008) and maintaining construct validity through repeated measures (Singer & Willet, 2003). For example, participants who are willing to commit to an experiment for a longer period of time may not be representative (in terms of motivation) for the population one tries to examine.
16 identify trends (Menard, 2002). The experiment of this thesis for example needs a longitudinal design to study trends in knowledge and system usage development when using the PAL system. Knowledge develops over time and may fluctuate, as is the case of system use. Taking a longitudinal approach is necessary in establishing actual usage and usage patterns in daily life of a system to help establishing if, and when a system is more or less used. Lastly, general consensus is that learnability is a great part of usability (Grossman, Fritzmaurice, Attar, 2009) and longitudinal studies in system development may therefore be necessary to account for learnability. Although a new system may at first appear to elicit worse performances from users, this may be due to the fact that users are trained to use another system. Time and repeated use may be needed to attain the same or higher level of performance of users. This is demonstrated in the longitudinal study by MacKenzie and Zhang (1999), where after repeated use the new design of a keyboard achieved higher performances even though performances on initial uses were far lower compared to a widely used generic keyboard model.
In conclusion, a longitudinal research is necessary in evaluation of interventions if we wish to validate its use and effects in the long run, identify processes or developments, and overcome effects of learnability and initial use on long term performance. For the PAL experiment, this means that we not only need to measure over a longer period of time, but also incorporate repeated measures if we want to validly identify developments in knowledge and system usage.
2.5 Individual difference in system usage and knowledge development
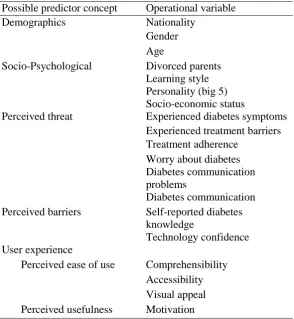
The variables which might explain variation across and within participants on system usage and knowledge development are summarised in table 2 (page 19). These variables should be taken into consideration during and after the experiment as possible explanatory variables. The following section further explains these variables.
2.5.1 System usage
We need to create an understanding what user characteristics may contribute to variations in system usage (Van Gemert-Pijnen, Kelders, & Bohlmeijer, 2014). This is needed as the PAL project tries to personalise its communication, hoping to optimize system usage and ultimately knowledge
development for different kinds of users. For example, low-active users with a particular trait such as low self-efficacy may need to be reminded or stimulated in another way to use the intervention. Grounded theories in health behavioural change research are used to narrow our field of possible predictors for system usage which will then be used in the experiment.
17 also within participants. While during the initial use, ease of use is considered most important,
usefulness becomes more important for the user through the phase of incorporation of the system in their daily lives (Karapanos, Zimmermann, Forlizzi, & Martens, 2009). More recent studies found that the aesthetics of (web-based) interventions and products should be included in a technology
acceptance and use model as it was found to influence the perceived ease of use and perceived usefulness (Cyr, Head & Ivanov, 2006; Sonderegger, Sauer, 2010).
While user experience will be examined during the experiment, other possible predictors for usage of a health intervention system may be found in the health belief model (Becker et al., 2010). Although this theory does not directly address system usage, it does address direct health promoting behaviours. In the context of the PAL experiment, system usage would be a direct health promoting behaviour in the intervention. The health belief model was developed and refined through multiple studies during the second half of the 20th century and tries to explain how health promoting behaviours (or the lack hereof) come about (Becker et al., 2010 ; Jahanlou, Lotfizade & Karami, 2013). This early model states four variables as influencers of health promoting behaviour: perceived susceptibility and severity, perceived benefits and perceived barriers. The perceived susceptibility and severity means to what degree an individual judges a disease on the severity and likeliness of getting the disease. Any positive change in reducing the (perceived) susceptibility and severity a person expects after a health promoting action is labelled as a perceived benefit, while expected costs and efforts to achieve this benefits are barriers. General demographics, like age and sex, and socio psychological variables, like personality, intrinsic motivation, socio economic status and social environment, are taken into account as mediators. Jahanlou, Lotfizade and Karami extended this model through multiple experiments and mainly added self-efficacy. Their studies mainly used diabetes as the observed disease which is obviously very relevant for the PAL experiment. Figure 4 illustrates the extended model after their final experiment which tested the behaviour maintenance by the outcome blood glucose (HbA1c) values.
As the PAL experiment deals with young children of which the parents still play a large part in their diabetes management (Modi et al., 2012) they might influence the motivation of the child to interact with the system. Possible influencers are most likely to be similar to the health belief model variables, as the parent is confronted with the same elements of fear, benefits and barriers. Fears in this case are for the health of their child and possible complications of their diabetes. Barriers in motivating and supporting the child might be a lack of confidence and experience with similar PAL technology.
18
2.5.2 Knowledge development
The possible predictors for knowledge development are similar to the predictors for system usage. It is important to understand that the system use over time itself needs to be taken into account for differences in knowledge development. It may be that an increase in system use positively relates to an increase in knowledge (which is one of the main goals of the intervention). This would inherently mean that the factors that drive system use might indirectly influence the knowledge development. Setting this aside, even if system use would not relate to a higher knowledge development, some of the afore mentioned variables may still account for differences in knowledge development on their own. This is especially the case for demographic and socio-psychological factors. For example, it is clear that knowledge development would vary for children of different ages, as their cognitive abilities are different. But also socio-psychological factors like experiencing a divorce of ones parents (Amato, 2005) and learning style (Lynch, Woelfl, Steele & Hanssen, 1998) have shown to relate to learning and cognitive differences.
19 Table 2
Possible predictor variables for health intervention system useand knowledge development
Possible predictor concept Operational variable
Demographics Nationality
Gender Age
Socio-Psychological Divorced parents Learning style Personality (big 5) Socio-economic status
Perceived threat Experienced diabetes symptoms Experienced treatment barriers Treatment adherence
Worry about diabetes Diabetes communication problems
Diabetes communication Perceived barriers Self-reported diabetes
knowledge
Technology confidence User experience
20
3. Methods
During this study, one of the aims was to identify any trends and groups in the use of the system and knowledge development with specific characteristics. With these groups and their main
characteristics, the PAL system may be personalised with adaptive strategies. This chapter describes the main experiment- and analysis methods that were used to identify the trends, user groups and their characteristics. The main PAL study was conducted by the total PAL project group and consisted of more areas of interest than relevant for this particular study. This means that in practice there were measures and procedures that fell beyond the scope of this study and analysis. Only the for this thesis study relevant methods of the experiment are described.
3.1 Participants
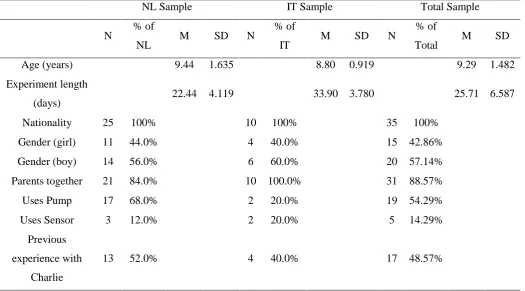
35 children participated in the first year experiment. Of these children, 25 were Dutch and participated in the Netherlands while 10 children were Italian who participated in Italy. In the Netherlands, each child was accompanied by one of their parents during the experiment appointments totalling to 25 participating parents. In Italy however, with the exception of two children, all children were accompanied by both their father and mother during the experiment appointments making the total count of Italian parents 18. An overview of both the Italian and Dutch sample is presented in table 4. Due to practical planning reasons, the total experiment duration differed for the participating
children (M = 25.7, SD = 6.558). The total experiment duration mainly differed for the two
nationalities. For the Dutch children, the total experiment length ranged from a minimum of 15 days to a maximum of 29 days with an average length of 22.44 days (SD = 4.119). For the Italian children, the experiment lasted a minimum of 29 and maximum of 40 days, with a mean of 33.90 days (SD = 3.780). The ages of the children ranged from six until twelve years with an average age of 9.29 years (SD = 1.482), with a small difference between children of different nationality.
21 To enter the study, patients had to be between the ages of six and twelve years old. Another inclusion criterion was that patients needed to be diagnosed with T1DM for longer than six months. This criterion was set to avoid any influences of recent diagnoses. Children could only enter the study if at least one parent was available and willing to participate. The participation of at least one parent was important to ensure guidance and support for attendance at appointments and use of the system at home. Furthermore, they were necessary to be included in the study to get a holistic overview of the child and their family and home environment. An informed consent needed to be filled out by both the parents and children in order to participate, as most of the children were below the age of twelve. The experiment was approved by both the University of Twente ethics committee, and the MEC-U which is the medical ethics committee of a range of Dutch hospitals.
Table 4
Overview of both the nationalities samples and the total sample.
NL Sample IT Sample Total Sample
N % of
NL M SD N
% of
IT M SD N
% of
Total M SD
Age (years) 9.44 1.635 8.80 0.919 9.29 1.482
Experiment length
(days) 22.44 4.119 33.90 3.780 25.71 6.587
Nationality 25 100% 10 100% 35 100%
Gender (girl) 11 44.0% 4 40.0% 15 42.86%
Gender (boy) 14 56.0% 6 60.0% 20 57.14%
Parents together 21 84.0% 10 100.0% 31 88.57%
Uses Pump 17 68.0% 2 20.0% 19 54.29%
Uses Sensor 3 12.0% 2 20.0% 5 14.29%
Previous experience with
Charlie
13 52.0% 4 40.0% 17 48.57%
3.2 Materials
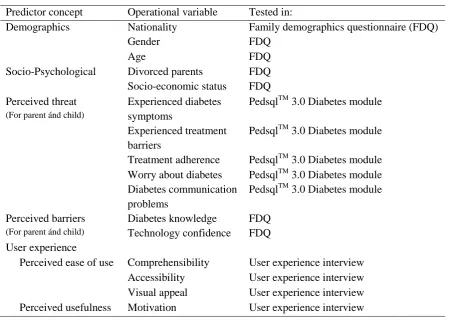
22 Table 5. Possible predictor concepts for health intervention system use and knowledge development that were tested in the experiment, and their operationalization.
Predictor concept Operational variable Tested in:
Demographics Nationality Family demographics questionnaire (FDQ)
Gender FDQ
Age FDQ
Socio-Psychological Divorced parents Socio-economic status
FDQ FDQ Perceived threat
(For parent ánd child)
Experienced diabetes symptoms
PedsqlTM 3.0 Diabetes module Experienced treatment
barriers
PedsqlTM 3.0 Diabetes module Treatment adherence PedsqlTM 3.0 Diabetes module Worry about diabetes
Diabetes communication problems
PedsqlTM 3.0 Diabetes module PedsqlTM 3.0 Diabetes module Perceived barriers
(For parent ánd child)
Diabetes knowledge Technology confidence
FDQ FDQ User experience
Perceived ease of use Comprehensibility User experience interview Accessibility User experience interview Visual appeal User experience interview Perceived usefulness Motivation User experience interview
3.2.1 Questionnaires
23 General characteristics which were set as possible mediators or determinants for system usage and knowledge development were addressed in a family demographics questionnaire. These included child demographics, socio-psychological factors, technology experience (confidence) and perceived diabetes knowledge. The parents were asked to fill out this questionnaire.
3.2.2 Semi-structured interviews
During this study, the child participated in three semi-structured interviews with one of the
researchers, at the hospital during the first and final appointment, and by phone two weeks after the start of the study. Global structures of discussion topics and questions were made prior to the interviews.
The first interview measured the current state of the self-management determinants, knowledge and skills which were operationalized by a discussion on the know and do goals of diabetes self-management. The motivation before actual system usage of the child to engage with the PAL system was measured through a series of statements which the child can then rate on a scale of 0 to 5. 0 meaning that the statement is very untrue for them, and 5 meaning that the statement is very true for them. The second interview was a quick check-up on the perceived user experience of the MyPal application after two weeks of usage. The interviewer focused on this through several
questions on comprehensibility, visual appeal and general feedback. The final interview measured the current state of the self-management determinants, knowledge and skills in the same manner as during the first interview. The user experience after the four weeks of usage was addressed through multiple choice questions in an interview, by the same process of statements which the child had to rate on a scale of very untrue until very true. The user experience was measured by statements and questions on accessibility, comprehensibility, visual appeal, and motivation.
3.2.3 Information letters and informed consent
Every child that fit the inclusion criteria for participation received an information letter of their diabetes healthcare professional. It asked the child if it would like to participate, and explained the procedure in a simple and brief manner. The parents received an adult version which explained the project, its goal, the procedure and privacy of data. If the parents were willing to participate, they would receive a larger and more elaborate information folder, which explained the research,
measurements, possible benefits and effects, selection criteria, time scheme of the experiment, privacy and data, financial compensations and options for complaints about the research.
24 3.2.4 Audio and video recording
All interviews were audio recorded in case the parent gave their consent. Interaction sessions at the hospital between the child and physical robot were video recorded for later analysis if written consent for this recording was given.
3.2.5 Statistical computing programs
General descriptive and testing procedures were performed in the IBM program SPSS statistics version 22. For more advanced graph plotting and creating linear mixed effects models, the statistical computing software R version 3.3.0 (R Core Team, 2013) was used within the RStudio environment version 0.99.491 (RStudio Team, 2015).
3.3 Design
3.3.1 Experiment overview
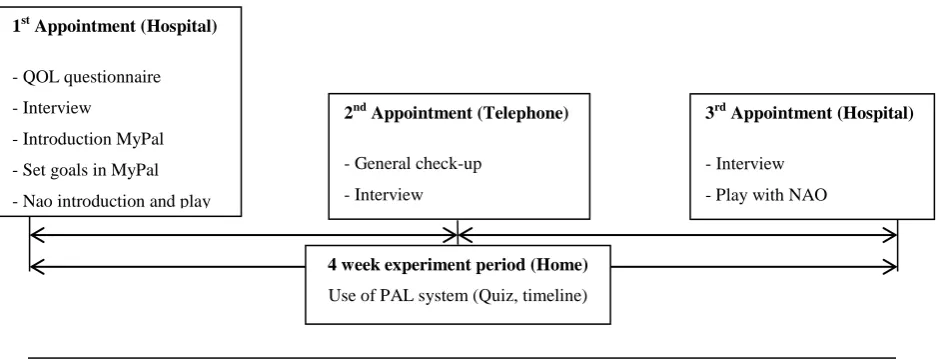
The total experiment lasted four weeks and during this experiment a total of three appointments per participant were arranged. The first appointment was at the start of the experiment at the hospital, the second mid-way after two weeks by phone, and the final one at the end of the experiment in the hospital after four weeks. The parents were also present at every appointment. The appointments were used for interaction between the child and NAO robot, introduction and set-up of the MyPal
[image:24.595.58.529.559.739.2]application, and to gather child data on several topics through interviews and questionnaires. During the whole four week experiment, the children were able to use the MyPal application on a provided tablet at home. In this application, the children could play the quiz, enter data like activities, food and blood glucose on their timeline, and interact with the NAO avatar. They were informed to use the application as often and long as they pleased, with no minimum or maximum usage. The children and parents could determine for themselves if they wished to use the application together, or if the child wanted to use it by himself. Figure 4 provides a visual overview of the total experiment.
Figure 4. Timeline of the total experiment.
4 week experiment period (Home) Use of PAL system (Quiz, timeline) 1st Appointment (Hospital)
- QOL questionnaire
- Interview
- Introduction MyPal
- Set goals in MyPal
- Nao introduction and play
3rd Appointment (Hospital) - Interview
- Play with NAO 2nd Appointment (Telephone)
- General check-up
25 3.3.2 Experiment design
All participants were observed on their use of the PAL system through longitudinal repeated
measures. Although the main PAL project took a mainly qualitative approach, this thesis took both a qualitative and quantitative standpoint. All participants received the MyPal application, interacted with the robot and were asked to attend their personal appointments with their researcher and health care professional. The study contained no control group, as the main goal of the study was not yet to make inferences about causality or a general population. During the experiment, data was registered at three set appointments for qualitative interview and questionnaire data, and continuously during the four week usage of the system by the children at home. This research design had the advantage that it allowed to track changes over a period of time, instead of just a pre- and post-measurement. This provided detailed information on the progress rather than depending on averages. For this study, this was useful as we wanted to see how the system usage and knowledge development would progress over the time of one month. Also, this progress was explored both between as with-in participants. 3.3.3 Procedure
Several weeks before the start of the experiment, parents and children of cooperating hospitals were informed about the project through their own diabetes healthcare professional. The parents were provided with an information letter which contained quick information about the experiment. The children were handed a simplified child friendly version. Furthermore, a detailed folder about the experiment and all the participant’s rights, along with an informed consent form for both the child and parents were given to the parents. A few days after receiving the information, the parents would be contacted by phone with the question whether they and their child would like to participate in the experiment. If they did, a first appointment for the experiment was made.
For the initial appointment, the diabetes healthcare professional, researcher, parents and child would meet at the hospital. After the possibility to ask questions, the parents and children were asked to sign the informed consent forms before starting the experiment. They could then both start the PedsQLTM diabetes questionnaire. When the child finished his PedsQLTM diabetes questionnaire, he was interviewed by the researcher. Parents were asked to fill out the family demographics
26 help the children if they pleased. In case of problems, they could call the technicians of the PAL team. Number of times and length of usage were up for the children and parents to decide as there was no minimum or maximum usage prescribed.
After two weeks, the children were contacted by a researcher by phone for a quick interview. The researcher would check on their goals and engagement of the child with the MyPal application through a semi-structured interview. There was also room for the child to give direct feedback on the application. The parents were asked to fill out an online questionnaire about their perceived usability and experience of the application. The next two weeks were then again attributed to home use of the MyPal application by the child.
During the final appointment, the child could play with the NAO robot while the parents fill out a questionnaire on user experience and feedback on the MyPal application. Then, the researcher engages the parents in an interview which follows through on some of the questionnaire questions to get a more thorough answer. Subsequently, the child was also interviewed. This interview mainly focused on self-management knowledge and skills and the user experience of both the NAO robot and the MyPal application. At the end of the appointment, the children and parents were thanked for their participation, while the children received a small memento of the study in the form of a picture of them with the robot.
3.4 Measures
This section describes how the variables of interest were measured or calculated during the experiment. First the measures of the possible explanatory variables are discussed and then the measures of the outcome variables for system usage and knowledge development are described. 3.4.1 Explanatory variables
Any demographic variables were registered through open questions. This was also the case for the socio-psychological variables: socio-economic status and whether the parents were divorced. The perceived diabetes threat of the children was measured through 28 written statements, which the child could then judge to be true or untrue for them on a scale of 0 (never true) to 4 (almost always true). The perceived threat was divided into five categories: symptoms (11 items), treatment barriers (4 items), treatment adherence problems (7 items), diabetes worries (3 items) and diabetes
27 statements which the participant could judge on a scale of 1(very untrue) until 5(very true). A higher score indicated a more positive user experience. Any scores on negative questions were inverted. 3.4.2 System usage - timeline
The system usage was examined through frequency and quality of use. The frequency of use is in this experiment referred to as the quantitative measure of all added content and the consistency with which this was added. The total amount of added content was calculated by adding all entered activities and event notes. A timeline entry was counted every time a participant added an event (activity glycemic value, meal or mood) to the timeline. Each timeline entry could contain one optional added note.
(1)
Measuring the consistency of added content was done through an equation which was previously used in a PAL pilot study. This way we could ensure compatibility and comparability of the data in the pilot, this experiment and coming experiments. The consistency with which the content was added is expressed in equation 2 (Ligthart, 2016). In the consistency equation, nonzero represents all days on which content was added and dij is the relative experiment day on which content was added.
∑
⁄
(2)
The quality of use consisted of a qualitative analysis. For this, a categorizing scheme that was used in the first PAL pilot study by Ligthart (2016) was utilized. By classifying al added notes into one of the four following categories, the data was comparable in respect to the pilot study.
- (1) None. Factual description of the activity.
- (2) Minor. 1+ Minor indication of thoughts and feelings. - (3) Moderate. 2+ Information about friends and/or family,
- (4) Major. 3+ Major indications of thoughts/feelings about the activity and/or friends and family. 3.4.3 System usage – Quiz
The quiz analysis entailed the same as in the timeline analysis: frequency and quality. For the
frequency analysis of the quiz, every started play round was logged, as well as all answered questions. Frequency in this context entailed the quantitative measure of the number of played questions and consistency of started quiz rounds. The calculation of this consistency is similar to the timeline equation 2 as created by Ligthart (2016) in a former pilot study of the MyPal project. In equation 3, nonzero represents all days on which a quiz question was answered and dij is the relative experiment day on which a quiz question was answered.
∑
28 3.4.4 Knowledge development
The knowledge development for each participant was operationalized by calculating the percentage of correctly answered quiz questions per day. This percentage only includes diabetes related questions, and excluded any non-diabetes related quiz questions. By calculating the percentage each day, a trend may be identified over the course of the experiment.
3.5 Analysis
The analysis started with descriptive statistics on the demographic characteristics of both the children and their parents (table 4) to get a main overview of the sample. The explorative data analysis of the system usage was then divided in the use of the MyPal Quiz and the MyPal Timeline. For each of these MyPal parts, analysis of the system usage took take place on two main aspects: frequency, and quality. The knowledge development was mainly explored through analysis of the quiz. This paragraph contains a description of the data preparation and analysis procedure for both the system use and knowledge development.
3.5.1 Data preparation
All data from the interviews and questionnaires were translated into English and entered in a digital format, after the final appointments took place. This was done in the same way for both the Italian and Dutch data to ensure that the data can be used together in the analysis. Data from the MyPal app on quiz data and timeline data were derived from different parts of the PAL database and restructured into one Microsoft Excel data file for analysis. Again, both data from Italian and Dutch participants were combined in one file.
For all interactions with the system, the corresponding date was converted to the relative experiment day of the child. This was done to prevent a distorted picture of frequency data as the experiment did not start and end on the same day for each child. This strategy allowed for a more realistic and clear view of the data relative to the experiment period of each child.
29 child closed the app, or as the app crashed. The questions with answers labelled as ‘unknown’ were therefore deleted to ensure only actually played questions were analysed.
3.5.2 System usage – timeline data
In the MyPal Timeline, it was possible for the participants to enter an event within one of four categories: activity, glycaemic values, meal and mood. Within these categories, the participant was free to add notes besides the required data such as glucose value. For the analysis of the use of these Mypal Timeline functions, several aspects needed to be explored. The main aspects of this system usage analysis concerned: frequency (amount added content & consistency) and quality of use. To get a global understanding of the timeline data, besides descriptive analysis, scatterplots and conditional boxplots were created for the total added content. Individual scatterplots were visually inspected for main trends. To identify different groups of system usage, an interaction plot was created for the mean added content per day and the consistency with which the participant added this content. A k-means analysis then allowed for the clustering of the participants on these variables. The quality of the system use was visualised by the four categories of Ligthart (2016), as described in chapter 3.4.2.
3.5.3 System usage – quiz data
For the frequency analysis of the quiz, every started play round was logged, as well as all answered questions. The quiz contained both diabetes related and general questions for the child to answer. The quiz analysis entailed the same as in the timeline analysis: frequency and quality.
First, a scatterplot and conditional boxplot were created for a first insight in the number of answered questions over the course of the experiment per participant. An interaction plot on the mean number of answered questions per day per participant and the consistency with which these were answered was made for identification of different user groups. A k-means analysis allowed for the grouping of users on these two levels.
3.5.4 Knowledge development
30
4. Results
4.1 System usage
The following section describes the results from the system use analysis, looking at both the timeline and quiz data consecutively. A general description of the usage is presented for both the timeline and quiz. Then, both the identified trends and user groups are described.
4.1.1 System usage –timeline
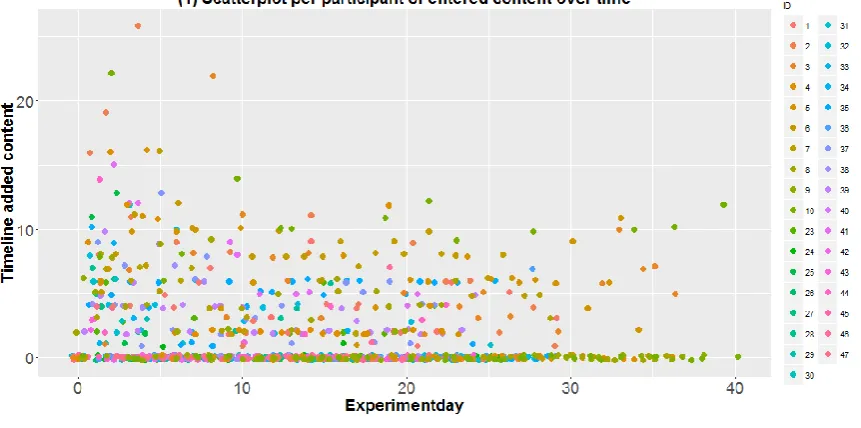
The timeline part of the MyPal application consisted of two parts: entries and notes. Entries entailed added activities, blood-glucose-values, meals and emotions while the notes were voluntary open descriptions that could be placed with a timeline entry. During the experiment period, a total of 1538 events were added in the MyPal application. On average, a participant filled in a total of 45.24 events (SD=50.048) during the whole experiment period with an average of two events per day (M=1.84, SD=1.913). The large standard deviations already indicated a large difference in the added timeline entries per participant. Indeed, while some participants never added a timeline entry, some
participants added up to 188 entries. A total of 269 notes were added by the participating children with an average of 9 notes per participant (M=9.37, SD=10.730), and 0.4 notes per day per participant (SD=0.398). As with the timeline activity entries, the total number of added notes has a wide range over the participants. The minimum amount of total notes per participant was 0 while the maximum was 35 notes. In the further analysis, a combination of both timeline entries and notes was used. Figure 7 shows the longitudinal development of the total added content per day per
32 Participant clustering. Consistency vs. total added content
In order to get a full overview of the participating children and their system use, it was not only necessary to look at the amount of content added but also at the consistency with which this happened. For every child, a consistency score was calculated for their added content. This score could range from 0 to 1, a higher score represented a higher consistency in the adding of content on the MyPal timeline. (The exact calculation and formula is presented in chapter 5.5.2). Figure 9 shows the consistency and mean added content per day for each participant. It was clear that the participants differ extremely on both parameters. There was no indication for a linear relationship between
consistency and mean added content per day per participant (p=0.435), so being more consistent in the timeline would not imply a higher mean added content per day and vice versa.
For a further investigation of the system usage per participant, a cluster analysis was
performed. This allowed us to categorize participants on both consistency and mean added content per day. The results of a hierarchical cluster analysis showed that an appropriate number of clusters was either 5 or 3. Looking at the scatterplot of consistency vs. mean total content per day, 5 clusters seemed like a more realistic division. However it is important to note that this grouping does not take the trend of usage into consideration.
[image:32.595.80.511.61.275.2]A K-means cluster analysis of the standardized values indicated the standardized cluster means. Both variables were of significant influence on these means (both p<0.001). For the mean added content per day, the clusters differed significantly (F(4,30)=32.859, p<0.001). Further analysis shows that cluster 1 significantly differed from cluster 3 (p<0.001), 4 (p<0.001) and 5(p<0.001) but not 2. Cluster 3 did not significantly differ from cluster 4 on mean added content per day. For consistency, cluster 1 differed significantly to all cluster (p<0.001). However, the consistency scores of cluster 4 did not differ from clusters 2 and 5.
33 The clusters could be described as following:
Cluster 1: Overall low performance (very low) Cluster 2: Low content, high consistency (low) Cluster 3: Overall medium performance (medium) Cluster 4: Medium content, high consistency (high) Cluster 5: Overall high performance (very high)
Quality of added content
Out of the 35 participating children, 30 children added between 1 and 34 notes on the timeline. All notes were categorized along the predefined scale by the amount of personal disclosure. The categories were defined as following:
- (1) None. Factual description of the activity.
- (2) Minor. 1+ Minor indication of thoughts and feelings. - (3) Moderate. 2+ Information about friends and/or family,
- (4) Major. 3+ Major indications of thoughts/feelings about the activity and/or friends and family. The added notes were skewed to the left on this index, with a high number of pure factual notes and a low number of elaborate personal disclosures (figure 10). As it is generally accepted that the
willingness and ability to self-disclose changes as children grow older (Mandler, 2000), it was investigated whether this may be of influence on the differences in personal disclosure in the experiment. No significant relation was however found.
34 4.1.2 System usage – quiz
During the first year experiment, a total of 2477 questions were answered in the quiz by the participating children. The total number of answered questions differs greatly for each child with a minimum of 22 and maximum of 175 answered questions (M=70.77, SD=33.939). On average, a child answered 2.844 questions per day (SD=1.480). Figure 11 illustrates the longitudinal
development of the number of answered quiz questions per participant per day, while figure 12 shows all individual scatterplots on the played questions per day. In figure 11, an overall decline in the number of played quiz questions per day per participant was observed. The rise after 34 days could be explained by the low number of remaining participants, as the experiment length differed for the participants.
The scatterplots in figure 12 indicated the same problem as the system usage in the timeline. A large part of the users showed a flat line of 0 usages per day, with small exceptions at the start and end of the experiment. These exceptions probably arose during the initial and final appointment in the hospital where the children asked to play some quiz questions. The users who did not show a flat line of zero played questions per day showed a clear sharp decreasing trend. Their use greatly declined and hit zero well before the end of the experiment. Again, this made it impossible to validly examine predictor variables as the data of actual users was to scarce and the group to homogeneous.
[image:34.595.77.429.43.223.2]Figure 10. Distribution of the added notes in MyPal on their level of personal disclosure.
36 Participant clustering. Consistency vs. played questions
Besides the mean number of answered questions, the consistency with which children answered these could tell us more about the system usage. Figure 13 (1) shows the position of each participant on both consistency and mean answered questions per experiment day. Just as with the added content, a hierarchical cluster analysis was performed to determine the number of clusters on consistency and played questions. The elbow method showed that either 3 or 5 clusters would be correct. A clustering of three groups was chosen as this appears more logical in this situation because the differences were not extremely large, and the statistical power was better for 3 clusters. The clustering of 3 groups for the quiz usage as opposed to 5 groups for the timeline usage may be due to the overall lower
consistent use of the quiz, as no one exceeds a consistency above 0.6 in the quiz usage but in the timeline usage the consistency ranges all the way up to 1. A visual representation of this clustering is situated in figure 13 (2). The clusters can be described as following:
Cluster 1: Overall low performance (low) Cluster 2: Medium content and consistency (medium) Cluster 3: High mean questions, medium consistency (high)
4.2 Knowledge development
As both the quiz and timeline sections of the system were not used by the majority of the participants, and the users who did use it showed a sharp decline, it was clear that only one conclusion with regard to knowledge development could be made. Children cannot (or very insignificantly) have benefited a positive diabetes knowledge development as a result of the system. Even if large changes in
knowledge development were to be observed, these may not be directly attributed to usage of the system.
[image:36.595.48.582.256.563.2]