i
University Twente
Bachelor Thesis
Feasibility study for the in-house production
of masterbatches
ii
Preface
In front of you is the result of my bachelor thesis done at the University Twente. In this thesis I have researched the feasibility of setting up a new production facility. This thesis consists out of the first steps done in the development of any sizeable project, namely: “Is this project worth doing?” Personally, I certainly found this research worth doing, as it has been a pleasure to conduct this research at the company. I would like to thank everyone that has helped me in this research, but especially George Smallenbroek. For giving me an assignment within the company, as well as support along the way.
iii
Summary
This thesis researches the feasibility of setting up a new production facility to produce masterbatches at a chemical factory. These masterbatches are components the production of carbon granulate, which is the main product of the chemical factory. At the moment the company is buying it from suppliers, but is interested in manufacturing it on its own terrain. However, it is yet unknown if it is feasible to execute this project, and that is researched in this thesis, which leads to the main research question:
“Is setting up a production facility to produce masterbatches feasible?”
The objective of this thesis is to research the financial feasibility of setting up a new production facility for master batches. The qualitative criteria are not looked into, because the financial criteria weigh more heavily on the decision to further expand this project or not. The criteria that are looked into in this thesis are: costs of buying masterbatches, investment and operational costs of the new production facility and the values of the key performance indicators. The following key performance indicators are used to evaluate the project: net present value, internal rate of return, payback period and profitability index.
The choices that are made in setting up a production facility consists out of two elements: the type of machine chosen and the amount of teams operating the machines in alternating shifts. These
elements combine into a yearly production level for the production facility. The masterbatches produced are mainly used to support the carbon granulate production of the factory. However, it is also possible to sell the excess stock to external parties.
The first alternative produces masterbatches solely to support the carbon granulate production, at its current production level. No masterbatches are sold to external parites. This is not a feasible
alternative as the investments are too high for a low volume of masterbatches.
The second alternative assumes that the carbon granulate production is running at maximum capacity. The volume of masterbatches needed to support the granulate production is sufficiently higher that this alternative becomes feasible. However, nothing is sold to external parties. This alternative is feasible, but not a very profitable one.
The last two alternatives add the selling of masterbatches to external parties to it. From this point, the concept of setting up a production for masterbatches becomes a very attractive prospect. The conclusion is that the production facility is certainly feasible under one condition. That it is possible to sell the excess stock to external parties.
However, the problem is that the project is in a too early stage to find buyers that will commit to purchase the masterbatches. Therefore, the amount sold to buyers are assumed in this thesis. If the project is further developed, it is recommended to investigate the possibilities of selling the
iv
Table of contents
PREFACE I
SUMMARY III
TABLE OF CONTENTS IV
1 INTRODUCTION 1
1.1SCOPE 1
1.2MOTIVATION 2
1.3GOAL 2
1.4RESEARCH DEFINITION 2
1.5RESEARCH METHOD 2
1.6STRUCTURE OF THE THESIS 3
1.7CONFIDENTIALITY 3
2 THEORETICAL STRUCTURE 4
2.1METHODOLOGY 4
2.2PERFORMANCE INDICATORS 6
2.3DISCUSSION OF PERFORMANCE INDICATORS 8
2.5CONCLUSION OF THE THEORETICAL STRUCTURE 10
3 ORGANISATION AND COST ELEMENTS 11
3.1CURRENT SITUATION OF BUYING MASTERBATCHES 11
3.2PREFERRED SITUATION OF PRODUCING MASTERBATCHES 14
3.3INVESTMENT COSTS 15
3.4OPERATIONAL COSTS 18
4 PROFITABILITY CALCULATIONS 19
4.1CASH FLOWS 19
4.2RESULTS 19
4.3CONCLUSION OF THE PROFITABILITY CALCULATIONS 21
5 CONCLUSIONS 22
5.1GENERAL CONCLUSION 24
5.2RECOMMENDATIONS 25
v
GLOSSARY 26
1
1 Introduction
The research was conducted at a factory that produces high quality carbon granulate as their main product. These granulates are used in the manufacturing of sophisticated plastic modules, for example a dashboard of automobiles. During the production of the granulate, a masterbatch is needed. A masterbatch is a concentrated mix of additives in a carrier which is fed into plastics processing machinery. By adding one type of masterbatch, the resulting granulate can be used to make an elastic plastic, but by adding a different type of masterbatch, the granulate could become heat resistant. The masterbatches are added near the end of the production cycle. They look like small pallets as shown in Figure 1: Masterbatches samples The masterbatches are the subject of this thesis, while the production process of carbon granulates is not involved in the research.
Figure 1: Masterbatches samples
The production of the carbon granulate is represented by Figure 22. This is a simplified version of what really happens, but suffices for this thesis. The white part, the adding of masterbatches, is the only part that is interesting for this research. These masterbatches are currently bought from
[image:6.595.71.233.243.360.2]external parties, which are called tolling companies. However, management has expressed interest in setting up an own production line to create these masterbatches. The knowledge of the production process is available in the company, but the facilities needed are not. A compounding machine is needed to produce masterbatches. A building along with the needed infrastructure has to be built to house the compounding machine. Therefore, management has asked to investigate the feasibility of setting up a production facility to produce masterbatches.
Figure 2: Production of carbon granulate
1.1 Scope
2
department. There is no research concerning the production method and possible improvements, as that broadens the scope too much. The thesis helps to answer the question whether or not it is feasible to setup a new production facility for masterbatches, and to aid management to decide if further pursuing this project is worthwhile.
1.2 Motivation
The motivation for this assignments has multiple elements. Firstly, the fees paid to buy the
masterbatches at the tolling companies are quite steep, as there are few companies that can make masterbatches. Secondly, there have been problems with the transportation of goods from and to the tolling companies. Finally, the knowledge of producing masterbatches is available within the company, and is currently not used. Therefore, management is curious about the feasibility of a production facility of masterbatches is feasible, and the reasons why this is or is not possible.
1.3 Goal
In the current situation the company does not have the ability to produce masterbatches, and is imported from external parties. The company has said it is interested in producing these
masterbatches. Therefore, the goal for this thesis is to research the feasibility of setting up a production facility to manufacture masterbatches.
1.4 Research definition
The main research question is:“Is setting up a production facility to produce masterbatches feasible?” The following sub questions have been used:
1. What costs are made by buying masterbatches from tolling companies? 2. What are the possible and feasible production capacities of the production of
masterbatches?
3. What investments need to be made to set up a production facility to make masterbatches? 4. What are the operational costs of producing masterbatches?
5. What are the values of the key performance indicators for the different alternatives? 6. What is the feasibility of the different alternatives of setting up a production facility? The deduction of the main and sub questions follows in Chapter 2.
1.5 Research method
The research was conducted while being present at the company. There was the possibility to interview managers and employees from different departments, such as logistics and research & development and to use their knowledge to aid the research.
The first sub question is answered by interviewing employees of the logistic and R&D department to specify where the financial information can be found. The financial information needed is found in the in- and outcome sheets that are available. This sub question is discussed in section 3.1
3
trusted due to the lack of variation in machines and the familiarity of the engineers with the machines. Even though the information can be trusted, there will be a sensitivity analysis, where higher investment costs are looked at. The construction and overhead costs have been determined with the help of the project manager and comparable past projects. The production costs have been determined partly by the information inside the offer and partly by using the costs made in the past at the company itself. These sub questions are answered in section 3.2, 3.3 and 3.4 respectively. The fifth and sixth sub questions are answered by using all the previous gathered information and using the theory explained in the next chapter. These results are interpreted using my own knowledge to come to a conclusion considering the project feasibility. This can be found in section 4.2 and 4.3.
1.6 Structure of the thesis
First, a theoretical structure (Padillo & Diaby, 1999) is explained, which is the foundation for this thesis. The sub questions are deduced and the key performance indicators are explained and discussed. This is explained in chapter 2.
Thereafter, the theoretical structure is applied to the problem and the information about the current and preferred situations are presented. This means the costs of buying the masterbatches from suppliers, along with the investment costs and operational costs of the new production facility. This is discussed in chapter 3.
With this information a result of the feasibility is calculated and the values of the key performance indicators is given and summarized. A short explanation of the results is given. This is explained in chapter 4.
Lastly, the conclusions and recommendations are presented in chapter 5.
1.7 Confidentiality
4
2 Theoretical structure
The methodology used, which is developed by Padillo and Diaby (1999), for a make-or-buy problem is explained in this chapter. Thereafter the performance indicators are explained and discussed.
2.1 Methodology
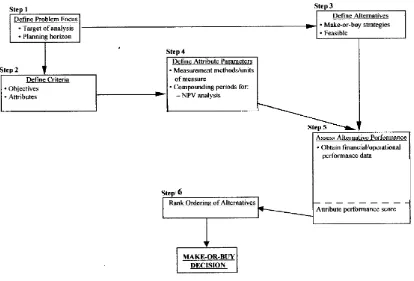
[image:9.595.75.489.211.492.2]The main theory that is used is the theory of Padillo and Diaby, called “A multiple-criteria decision methodology for the or-buy problem” (1999). In essence the problem for this thesis is a make-or-buy problem, because either the masterbatches are bought from a third party producer, or they will be made by this company.
Figure 3: Make or buy model of Padillo and Diaby (1999) adapted by S. Westdijk
The model developed by Padillo and Diaby is a methodology specifically designed to perform a multiple criteria evaluation of make-or-buy strategies. The methodology in this model is composed out of six procedural steps as shown in Figure 3.
5
After the criteria are developed, the alternatives are ranked based on the performance and weight of the criteria, to determine which alternative performs better under the determined circumstances. For this feasibility project, steps one through six of the model are developed. By using these steps a decision is formed to either further develop this project or cancel it all together. Most of the costs will be roughly estimated with a large degree of uncertainty.
2.1.1 Step 1: Define the focus of the analysis
The first step is the definition of the overall focus of the decision analysis. This means defining a focus for the research and setting a planning horizon for the make-or-buy problem, which will generally range from five to 25 years. For this thesis, the planning horizon is set to twelve years as is advised by management for projects of this scale.
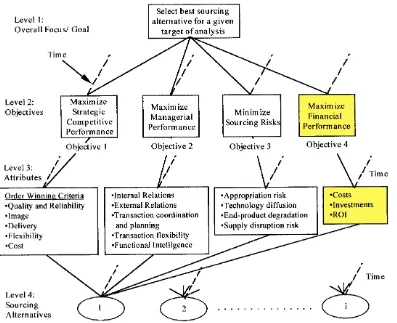
2.1.2 Step 2: Define the objective and the criteria
The second step consists of defining the criteria that have to be evaluated, which each fall under different management objectives. In this model the fundamental view is taken that, from a perspective of a modern business organization, the make-or-buy problem is composed of four conflicting objectives as shown in Figure 4. Each of the objectives contains a set of attributes or criteria that measures the performance of the alternatives to be studied. Since every sourcing problem contains a unique criteria set, the methodology prescribes that the problem criteria should be clearly defined. In this thesis the objective chosen is to maximize the financial performance of the project as is highlighted in Figure 4. The criteria or attributes that are studied are the costs,
[image:10.595.87.484.406.729.2]investments and the return on investments. The other attributes under the other three objectives are not studied.
6
The following sub questions are deduced out of the model:
What costs are made by buying masterbatches from tolling companies?
What investments need to be made to set up a production facility to make masterbatches? What are the operational costs of producing masterbatches?
2.1.3 Step 3: Define the alternatives
The third step in the model is defining the alternatives to the make-or-buy problem. This is a critical phase in the analysis and the alternatives generated need to be feasible and unique. The alternatives are a combination of the production capacity of the machine purchased to produce the
masterbatches, and the number of teams of operators that work on this machine in sequence. This production capacity needs to be near a feasible, attainable demand for masterbatches, as to avoid excess capacity. The demand of masterbatches is determined by the amount of masterbatches needed to support the main production line of carbon granulates. Additionally, the demand of masterbatches is influenced by the amount of masterbatches that can be sold to other factories. The production needs to be an amount that is feasible attainable, to guard against overproduction. Therefore, the production capacity defined has to be possible but also in a feasible range. The following sub question is deduced:
What are the possible and feasible production capacities of the production of masterbatches?
2.1.4 Step 4: Define the criteria parameters
The fourth step gives a value to the attributes of the problem. The performance of each alternative’s attributes should be measured according to the characteristics of each attribute and upon the type of data available. The quantitative criteria are measured using four performance indicators, namely the net present value, internal rate of return, payback period and profitability index. These are explained in greater detail in the next section of the thesis. The following sub question is deduced:
What are the values of the performance indicators for the different alternatives?
2.1.5 Step 5: Ranking the alternatives
The last step ranks the different alternatives according to the values of the indicators obtained in the previous step. For each alternative, a conclusion is drawn and a recommendation given.
The last sub question is deduced:
What is the feasibility of the different alternatives of setting up a production facility?
2.2 Performance indicators
In the model of Padillo and Diaby (1999) only the net present value is used to evaluate the alternatives. Therefore, the performance indicators are expanded upon with the most popular valuation techniques for projects. These performance indicators are used in almost every project evaluation and are staple in this field. The following performance indicators will be used to assess the alternatives:
7
2.2.1 Net performance value
The method of net present value (NPV) (Welch, 2009) discounts the time dependent cash flows of each alternative according the company’s cost of capital or commonly called the interest rate. This requires setting up a cash flow analysis for each alternative. The alternative with the highest NPV is preferred over the others. The NPV can be calculated by the following formula:
𝑁𝑃𝑉 = ∑ 𝐶𝑡(1 + 𝑟)−𝑡 𝑇
𝑡=0
where T = total number of compounding periods, NPV = net present value, Ct = cash flow during period t, and r = effective interest rate per compounding period.
The NPV is the most used and most reliable method to judge projects. It represents the value that a project will add to a company, and is a way to compare different projects to each other. However, this method is not without its flaws. The NPV is highly dependent on the accuracy of the cash flows, and in long-term projects it is also dependent on the accuracy of the interest rate. Still the NPV method mostly gives the correct answer to the investment question.
2.2.2 Internal rate of return
The internal rate of return (IRR) (Welch, 2009) is the rate at which the net present value (NPV) of a project's cash inflows and outflows, measured over the project's life, equals zero. This IRR that yields a net present value of zero is also called the discount rate in the NPV calculation. The IRR capital budgeting rule states that only if a project’s IRR is above the company’s cost of capital, the project should be accepted.
𝐶0+
𝐶1 (1 + 𝐼𝑅𝑅)+
𝐶2 (1 + 𝐼𝑅𝑅)2+
𝐶3
(1 + 𝐼𝑅𝑅)3+ ⋯ +
𝐶𝑇
(1 + 𝐼𝑅𝑅)𝑇 = 0
where T = total number of compounding periods, Ct = cash flow during period t, and IRR = Internal rate of return.
The IRR is a commonly used method in investment decisions. The IRR is a convenient method because it can be computed without needing any information about the company’s cost of capital. This is the major advantage this method has over the NPV method. Most of the time, both of the methods are used side-by-side, where IRR is used to validate the answer given by the NPV method. However, the IRR method is not without its drawbacks. The IRR is only easy to use if the investment follows the pattern of one initial spending or cash outflow, followed by periods of cash inflow. If there are more than one periods of cash outflow, it is possible that there are more than one correct IRR values, which makes it harder to judge the investment.
Another drawback is that the IRR method can be misleading when projects are mutually exclusive. It does not give any information about the scale of the project. Therefore, a small project with a high IRR and a low NPV can be preferred over a big project with a small IRR and a high NPV. While this is technically a correct answer, most managers will rather pursue the bigger project as it adds more value to the company.
2.2.3 Payback period
8
reject a project. If it is below the number of years, the project will be executed, and if it is above the number of years, it is terminated.
𝑃𝑃 =𝐼𝑛𝑖𝑡𝑖𝑎𝑙 𝑖𝑛𝑣𝑒𝑠𝑡𝑚𝑒𝑛𝑡(𝑠) ∑𝑇 𝐶𝑡
𝑡=1
where T = total number of cash inflow periods, C = (discounted) cash inflow, and PP = the payback period.
The beauty of the payback method is its simplicity. It is easy to calculate and easy to explain, even to a layman, because the concept of when an investment is paid back in terms of units of time is easy to grasp. Easier than a break-even point with the IRR or a return on investment with the NPV. However, the method has some major drawbacks, as it does not take into account cash flows after the project is paid back. Therefore, it will always choose the project that is returns the investment the quickest, even though that project is not the most profitable. Neither does the payback method account for the size of a project.
2.2.4 Profitability index
The profitability index (PI) (Welch, 2009) gives information about the relative performance or efficiency of the capital used. It divides the present value of the cash flows by the project costs. A value above one suggests a profitable investment and a value below one suggests an unprofitable investment.
𝑃𝐼𝑗=
𝑃𝑉𝑗
𝐼𝑛𝑖𝑡𝑖𝑎𝑙 𝑖𝑛𝑣𝑒𝑠𝑡𝑚𝑒𝑛𝑡(𝑠)
where PVj = present value of alternative j, and PIj = the profitability index.
The profitability index is a good performance indicator to use if the NPV of two projects are similar. On its own it does not give enough information to make a solid decision. This is because the PI is significantly biased towards low investment projects. It can indicate higher PI values with such projects even though the NPV is significantly lower.
2.3 Discussion of performance indicators
There are many different performance indicators used to evaluate investment decisions. However, some methods are better than others. The two most common methods used are the NPV and the IRR, with sound reason. These two methods give the most accurate valuation of a project, when applied correctly following the research of Welch (2009). However, especially the IRR is hard to explain and understand for the not informed. It is difficult to understand what a certain percentage truly means.
This is the reason the payback period method is developed. This method is graceful and simple as it states what the time period is, before the investment has returned its value. It is easy to understand for the not informed. Yet, it is not the best indicator to solely base a judgement on an investment on. The main drawback of the payback period is that it disregards any value generated after the
9
Contrasting to this, the profitability index can give additional insights that the other methods cannot give. It gives an indication how efficiently the capital is being used, an element that the NPV cannot reflect. Therefore, the PI is a good tool to use when two projects have a similar NPV. The project that has a similar NPV with a lower investment, and thus a higher PI, is a project that is a better choice. Welch has cited a survey (Graham & Harvey, 2001) under CFO’s of major companies, asking them which methods of valuating projects they used. Most of them used both the NPV and the IRR
[image:14.595.70.526.249.344.2]methods, as they are often correct. Although the payback period is less dependable, it is a commonly used method to valuate projects. The reason is the simplicity of communicating the results in a meeting. The IRR is an abstract number and the NPV can be hard to judge if little context is known. The payback period can easily be understood by even the non-informed. The PI is a rarely used method, but can be valuable in a situation that two projects are hard to separate in value.
Figure 5: Project valuation techniques (Graham & Harvey, 2001)
In Table 1 the advantages and disadvantages of the indicators are summarized:
Table 1: (Dis)advantages of performance indicators
The two performance indicators that are mainly used to rank the alternatives are the net present value and the internal rate of return. The profitability index is only used when two alternatives are close together and neither the NPV nor IRR can separate the two alternatives. The payback period is not used to rank the alternatives as it does not take into account any profits made after the
investment are paid back. However, the payback period can be used to explain the performance of an alternative on its own to the management.
Indicator Ease of explaination to others Usefulness on its own
NPV Easy to understand if listener
has basic financial knowledge Does not need other methods
IRR Abstract answer and hard
to grasp for a layman
Possible, but almost always used in conjunction with NPV
PP Needs few contextual information
and gives concrete answers
Not useful, as it can give skewed answers due to not incorporating whole planning horizon
PI Easy as the answer is a percentage Not much, as it cannot does not incorporate the scale of the project
Indicator Accuracy of the method Use of entire planning horizon Difficulty
NPV Most accurate Yes Somewhat difficult
IRR Accurate Yes Most difficult
PP Least accurate No Easiest
PI Accurate
[image:14.595.74.514.422.633.2]10
2.4 Sensitivity analysis
These four indicators will give the base case for each alternative. Furthermore, there will be a sensitivity analysis for each of the indicators. This analysis will investigate what will happen if there is a setback in the project. The values of the sensitivity analysis are taken from the standard sensitivity analysis used to evaluate projects in this company. By executing this analysis, it becomes clear which scenarios influence the result of the project most. This sensitivity analysis will be done according to the following scenarios:
10% more investment
o This could happen if the construction costs or the purchase costs of the new equipment are higher than estimated. The total investment costs will be multiplied by 1.1.
15% less volume sold
o This could happen due to buyers reducing their need for the carbon granulate during the project development. The total savings will be multiplied by 0.85 to simulate this effect.
10% more manufacturing costs
o This could be caused by a higher raw material costs due to external effects. The operational costs made will be multiplied by 1.1 in the cash flows.
Project delay of six months
o This could happen due to an unforeseen event, such as extreme weather. The result of this setback is that another six months of masterbatches have to be bought from the tolling companies. This will be added to the operational costs of year 1.
2.5 Conclusion of the theoretical structure
The following steps are taken to define the research questions and the theory used is explained. The focus of the research is defined and the planning horizon is twelve years.
The objective is to maximize the financial performance of the project, which leads to the criteria of costs, investments and return on investments. This results in the following sub questions:
What costs are made by buying masterbatches from tolling companies?
What investments need to be made to set up a production facility to make masterbatches? What are the operational costs of producing masterbatches?
Following this the alternatives are defined as different production capacities for the new machine in the production of masterbatches. This leads to the following sub question:
What are the possible and feasible production capacities of the production of masterbatches? The next step is to define the criteria parameters. The quantitative criteria are measured using four performance indicators namely, net present value, internal rate of return, payback period and profitability index. This gives the following sub question:
What are the values of the performance indicators for the different alternatives?
Finally, the alternatives are ranked and a conclusion is drawn and a recommendation is given. This gives the last sub question:
11
3 Organisation and cost elements
In this chapter the current situation of buying masterbatches is explained and the costs are calculated. Than the preferred situation of producing masterbatches is explained and the investments and production costs are calculated.
[image:16.595.74.521.199.284.2]The data is presented by analysing the current and preferred situations. The current situation is described in Figure 6, where the red parts represent actions performed by the company and the white parts represent actions performed by external parties.
Figure 6: Current situation of producing masterbatchers
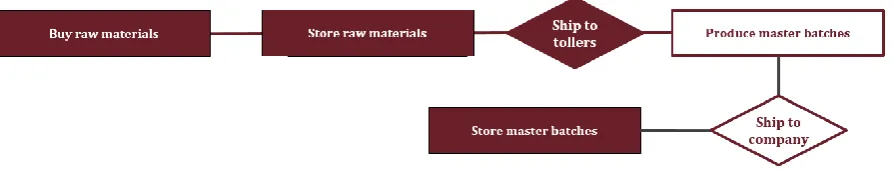
The preferred situation is described in Figure 7, where the company performs all actions. Only the relevant costs that change are calculated and costs that stay the same in both situations are not calculated. The cost element that is not calculated is the buying of raw materials as that is necessary in both situations.
Figure 7: Preferred situation of producing masterbatches
3.1 Current situation of buying masterbatches
What costs are made by buying masterbatches from tolling companies?
The current situation the masterbatches are bought from a supplying tolling company. When the company makes the masterbatches, these procurement costs will no longer be made. These costs can be considered savings in the preferred situation. The amount of masterbatches used per year is based on the budget plan that is made for the year 2014.
The costs in the current situation exist of the following elements: Tolling fee of the masterbatches in € per 1000 kg (MT).
The tolling fees are the price per metric ton of masterbatch. This covers the production and the shipping costs from the supplier to the factory. There are different prices for different kinds of masterbatches. The prices of the masterbatches are found in the budgets set up for this year.
Transport costs of the masterbatches in € per MT per km.
12 Handling costs of the masterbatches in € per year.
The handling costs are the costs made internally for (un)loading and packaging. These are estimated using the contract with the logistics company. In this contract, there are set fees for different actions, such as filling bags, transportation of bags, and (un)loading of trucks. With the help of these set fees, an estimation is made for the amount of money saved by removing these actions.
CO2 emission costs in € per year.
When the masterbatches are produced on site, there is less transportation of goods. This will reduce the footprint of the company by a small amount, which reduces the amount of CO2 emission costs.
However, because these emission costs are bought for the whole company and not per division, it cannot be counted towards the costs of the current situation. Thus, the emission costs will be neglected for this research.
3.1.1 Tolling fees and transportation costs
The tolling fees are the price per metric ton of masterbatch. There are several types of
masterbatches used in the company, but they can be fitted into four categories. Categories one, two and three can be produced on the same machine, only requiring a setup time to switch between categories.
There is no need to develop new products as the current masterbatches are produced according to a recipe developed not by the tolling company, but by this factory.
The total tolling fees are found in the budgeted results drawn up at the beginning of the year. These results are compared to results of previous years and there is little fluctuation in the tolling fees from year to year. The cost per MT for each grade type is calculated by dividing the total fees by the amount.
The transportation to the toller is organized and paid by the factory. However, there is no specific price connected to these transport costs. An average price per MT is calculated by averaging the results of previous transportation costs to the toller per truck. Each truck averages 22 MT of masterbatches per trip. The transport costs to the toller for each grade type are calculated by multiplying the average transport costs to the toller by the amount of masterbatches budgeted. The toller gives a transport cost per MT masterbatches it transports back to the factory, and multiplied by the budgeted amount of masterbatches gives the transport costs back to the factory per grade type. The total transport costs are the summation of the transport costs to toller added to the transport costs back to the factory for each grade type.
𝐴𝑣𝑒𝑟𝑎𝑔𝑒 𝑡𝑟𝑎𝑛𝑠𝑝𝑜𝑟𝑡 𝑐𝑜𝑠𝑡𝑠 𝑡𝑜 𝑡𝑜𝑙𝑙𝑒𝑟 𝑝𝑒𝑟 𝑀𝑇 = 𝑎𝑣𝑔 𝑡𝑟𝑎𝑛𝑝𝑜𝑟𝑡 𝑐𝑜𝑠𝑡𝑠 𝑡𝑜 𝑡𝑜𝑙𝑙𝑒𝑟 𝑝𝑒𝑟 𝑡𝑟𝑢𝑐𝑘 22 𝑀𝑇
𝑇𝑟𝑎𝑛𝑠𝑝𝑜𝑟𝑡 𝑐𝑜𝑠𝑡𝑠 𝑡𝑜 𝑡𝑜𝑙𝑙𝑒𝑟 = 𝑎𝑚𝑜𝑢𝑛𝑡 ∗ 𝑎𝑣𝑔 𝑡𝑟𝑎𝑛𝑠𝑝𝑜𝑟𝑡 𝑐𝑜𝑠𝑡𝑠 𝑡𝑜 𝑡𝑜𝑙𝑙𝑒𝑟 𝑇𝑟𝑎𝑛𝑠𝑝𝑜𝑟𝑡 𝑐𝑜𝑠𝑡𝑠 𝑏𝑎𝑐𝑘 𝑡𝑜 𝑓𝑎𝑐𝑡𝑜𝑟𝑦 = 𝑎𝑚𝑜𝑢𝑛𝑡 ∗ 𝑝𝑟𝑖𝑐𝑒 𝑝𝑒𝑟 𝑀𝑇 𝑚𝑎𝑠𝑡𝑒𝑟𝑏𝑎𝑡𝑐ℎ𝑒𝑠 𝑇𝑜𝑡𝑎𝑙 𝑡𝑟𝑎𝑛𝑠𝑝𝑜𝑟𝑡 𝑐𝑜𝑠𝑡𝑠 = 𝑡𝑟𝑎𝑛𝑠𝑝𝑜𝑟𝑡 𝑐𝑜𝑠𝑡𝑠 𝑡𝑜 𝑡𝑜𝑙𝑙𝑒𝑟 + 𝑡𝑟𝑎𝑛𝑠𝑝𝑜𝑟𝑡 𝑐𝑜𝑠𝑡𝑠 𝑡𝑜 𝑓𝑎𝑐𝑡𝑜𝑟𝑦
13 Table 2: Tolling fees and transportation costs
3.1.2 Handling costs
The handling costs are gathered from the contract with the logistics company. The transportation, handling and storage of the raw materials and finished products are outsourced. The handling costs can be found in the contract. The average storage level is set on 350 MT as is the average amount of stock in the previous years. With that information the current handling costs of the masterbatches is estimated. The total handling costs are calculated as follows:
𝑇𝑜𝑡𝑎𝑙 ℎ𝑎𝑛𝑑𝑙𝑖𝑛𝑔 𝑐𝑜𝑠𝑡𝑠 =
[image:18.595.69.384.402.483.2](𝑙𝑜𝑎𝑑𝑖𝑛𝑔 + 𝑢𝑛𝑙𝑜𝑎𝑑𝑖𝑛𝑔) ∗ 𝑡𝑜𝑡𝑎𝑙 𝑎𝑚𝑜𝑢𝑛𝑡 𝑚𝑎𝑠𝑡𝑒𝑟 𝑏𝑎𝑡𝑐ℎ𝑒𝑠 + (𝑠𝑡𝑜𝑟𝑎𝑔𝑒 ∗ 350 ∗ 12)
Table 3: Handling costs
3.1.3 Total costs of buying masterbatches
The first grand total is at the current production level of granulate, which needs 1712 MT of masterbatches bought from tolling companies on a yearly basis. The second grand total is a
hypothetical situation, where the production level of granulate is running at its capacity, which needs 3024 MT of masterbatches on a yearly basis. This situation is used to sketch possible alternative possibilities, which could happen. The costs made at maximum production level are extrapolated from the current production level. The assumption is made that the ratio between the types of masterbatches bought, remains the same.
Table 4: Total costs of buying masterbatches
Loading € 2.35 per MT Unloading € 2.35 per MT
Storage € 5.14 per MT / month Total handling costs € 29,675 per year
Handling
[image:18.595.71.284.636.728.2]14
3.2 Preferred situation of producing masterbatches
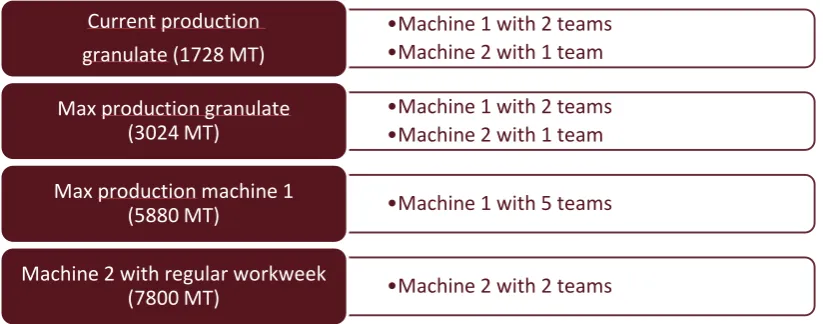
[image:19.595.71.483.148.310.2]What are the possible and feasible production capacities of the production of masterbatches? The alternatives are composed of a combination of the capacity of the production machine and the number of teams of operators working on the production line.
Figure 8: Alternatives
The main machine that determines the throughput of the production line is available in two sizes that are feasible for this project. The smaller machine can produce up to 700 kg / hr and the bigger can produce up to 1950 kg / hr. The production capacities of the two machines are supplied in a tender by a company that produces and installs these compounding installations necessary to produce masterbatches.
The number of teams that work at the production line determines the actual production level of the machine. The amount of teams can scale from one to five teams each with shifts of eight hours. There is always only one team of operators working at the machine. This means that with one team, the production will be eight hours a day during a 5-day workweek and with three teams the
production will be 24 hours during a 5-day workweek. With five teams, the production will be continuous, thus operating 24 hours, seven days a week. Table 5 displays the production capacity with different amount of teams, with both types of machine.
The data for the team shifts is found in the contracts with the employees. The speed of the machines is found in the offer made by the company supplying the compounding machines. By multiplying the production hours per year by the capacity of the machine, a yearly production capacity is found for each number of team combined with the type of machine.
Table 5: Production planning and capacity
•Machine 1 with 2 teams •Machine 2 with 1 team Current production
granulate (1728 MT)
•Machine 1 with 2 teams •Machine 2 with 1 team Max production granulate
(3024 MT)
•Machine 1 with 5 teams Max production machine 1
(5880 MT)
•Machine 2 with 2 teams Machine 2 with regular workweek
15
The alternatives have to produce a certain amount of masterbatches per year to satisfy the demand of masterbatches. This is demand composed out of two elements, the amount needed in the main production line of the factory and the amount of masterbatches that can be sold to other factories. Four different production levels of masterbatches are used as shown in Table 6.
The amount of masterbatches needed, at the current production level of carbon granulate, is 1728 MT, and at maximum production level it will be 3028 MT. The production level is found on the budgeted results for this year. The reason that both the current and maximum production level are investigated is that this will give insight how the feasibility of the project changes in the event of a growth of production for the factory.
There is also the possibility to sell masterbatches to other factories, because both machines can produce more than 3024 MT per year. However, it isn’t possible to determine the demand for masterbatches, because of the sensitivity of the subject and the early stage of the project
development. Neither was it possible to determine a selling price for the masterbatches. Therefore, management has advised to stick to the lower bound of the price that the factory currently pays to buy masterbatches. This is used as a source for the price of masterbatches. The assumption that is made for this feasibility project is that the masterbatches will be sold to other factories at 335€ per MT.
The third production level is the maximum capacity of machine 1, which gives an indication how valuable the machine is in the best possible situation. The less downtime the production machines have, the better it is.
The last production level is machine 2 operated by two teams during workdays. This is chosen instead of a continuous production, because the maximum production level of machine 2 is too high. Machine 2 can almost produce three times as times as much as machine 1 and producing this much would almost certainly lead to overproduction and huge stockpiles of masterbatches. Therefore, a more reasonable scenario is chosen, namely a production schedule with 2 teams during a 5-day workweek to produce 7800 MT of masterbatches.
3.3 Investment costs
What investments need to be made to set up a production facility to make masterbatches? It is necessary to build another building to house the new production line, along with all of the infrastructure and safety equipment. Thus the investment costs are split in the purchasing costs, which are the production machines and all of the equipment necessary for it, the construction costs to build the facilities to house the machines and the depreciation costs to write off these new buildings and equipment.
1728 MT 3024 MT 5880 MT 7800 MT
Maximum capacity used of machine 1 with continuous production Full capacity used of machine 2 with regular workweek
Production level of master batches per year
Needed to support current level of production of the factory Needed to support maximum level of production of the factory
16
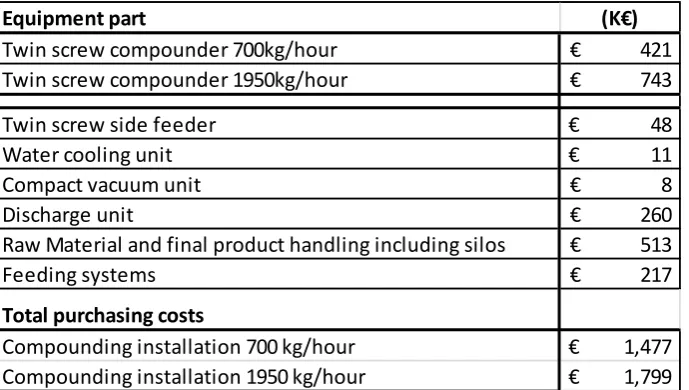
3.3.1 Purchasing costs
[image:21.595.72.417.152.347.2]The purchasing costs are found with the help of a contractor who builds the machines and has the ability to install the machine on site. The twin screw compounder is the actual machine which produces the masterbatches. The other components are supporting the machine by controlling the flow of material. The support components are compatible with both sizes of compounder.
Table 7: Purchasing costs
3.3.2 Construction costs
The construction costs are based on previous projects of similar size already completed by the company. The project manager helped with making an accurate estimation for a feasibility research project. It has to start from scratch since a new building is required, along with all the wiring and safety equipment needed. The overhead costs are the costs made for the project management and supervision of the project.
Previous projects are consulted to get an indication of the construction costs as well as book on estimating construction costs (Dagostino & Peterson, 2009). In this book estimations for different building types and different sizes are given.
Equipment part (K€)
Twin screw compounder 700kg/hour € 421
Twin screw compounder 1950kg/hour € 743
Twin screw side feeder € 48
Water cooling unit € 11
Compact vacuum unit € 8
Discharge unit € 260
Raw Material and final product handling including silos € 513
Feeding systems € 217 Total purchasing costs
17 Table 8: Construction costs
3.3.3 Depreciation costs
Finally, there are the depreciation costs. The equipment purchased and the facilities built have to be depreciated in value in a certain time window. The depreciation time is set for each category by the company. For most equipment the depreciation time is 25 years, but for some categories the depreciation time differs. The straight line method of depreciation is used. When calculated, the following is the depreciation costs made each year.
Yet, the depreciation is not a real cash flow, but an accounting technique. Thus it should not be taken into account in calculating the cash flows needed to calculate the net present value. However, by deducting the deprecation from the cash flow statement, the taxable income is reduced and less tax has to be paid. This is called a depreciation tax shield (Balakrishnan, Sivaramakrishnan, & Sprinkle, 2008). In this case the depreciation is allowed to be used in the cash flow statement as it frees up cash at the end of the year.
Construction costs per element (K€) Type of element
Piping 162
Building 1200m2 (40*30) 1231
Pavement 162
Steps, stairs, cage ladder 38
Building permits including levies 54
Lightning protection, earthing 22
Fire prevention center 76
Deluge system, gasdetection 32
Cabinet room 43
Connection to substation 97
Ground works incl. sondering 97
Connection main sewer 32
Concrete cable ducts 97
As built, calculations 76
HSE design criteria, ATEX compliance 11
Overhead 86
Construction supervision 65
Engineering and project management 184
Subtotal Machine 2144 Subtotal Overhead 421
Construction
Overhead
(K€)
Depreciation cost for production line Total
Twin screw compounder 700kg/hour 133
Twin screw compounder 1950kg/hour 146
18
3.4 Operational costs
What are the operational costs of producing masterbatches?
[image:23.595.69.530.217.379.2]The operational costs are the costs made to operate the machines for a set amount of masterbatches. The energy consumption is multiplied by the price per kWh by the tonnage of masterbatches produced. The contractor has estimated that the installation requires 0,2 kWh per kg produced. The machine needs approximately 2 FTE to operate for the first two alternatives and approximately 3 FTE for the last two alternatives. The handling costs for the raw materials and finished products estimated by the costs the logistics company has set in the contract with the company, same goes for the storage costs.
Table 10: Operational costs
1600 MT 2800 MT 5880 MT 7800 MT
Energy consumption (0,2 kWh per kg) 17 29 62 82
Labour costs operators 96 96 123 144
Labour costs supervisor 29 29 29 29
Forklift + operator costs 5 11 23 33
Filling big bags 21 37 77 102
Big bags shipment 17 29 62 82
Inbound handling 3 6 14 18
Outbound handling 3 6 14 18
Storage costs 22 38 40 42
Total 213 281 444 550
19
4 Profitability calculations
The cash flows of the project are explained in this chapter. Afterwards the results of the performance indicators are given, and to conclude with a discussion of the sensitivity analysis.
4.1 Cash flows
The profitability calculations require a setup of the cash flows within the project. The following structure of cash flows is made to simulate the possible incomes and expenses. The sheet used in developing the cash flows can be found in Appendix 1.
Year 1: Overhead expenses
Year 2: Construction and purchasing expenses
Year 3-12: Operational expenses and depreciation. Savings on not buying masterbatches and possible income from selling excess stock. The excess stock is the amount of masterbatches produced, minus the amount of masterbatches needed to support the main production line of carbon granulate. With these cash flows the profitability indicators can be calculated. The discount rate used is 12% as is standard use within the company.
4.2 Results
[image:24.595.72.489.372.584.2]What are the values of the performance indicators for the different alternatives? The following values are found:
Table 11: Results of performance indicators
Setting up a production facility for masterbatches to support the current level of production of granulate is not feasible. This applies for both the small machine and, even more, the bigger
machine. The quantity produced is not high enough to justify the investment made in new machines and facilities. All of the indicators point towards an unprofitable investment decision. The NPV might be slightly positive, which will point towards profitable decision. However, the value generated is below 10% of the capital investment and this will not be an efficient way of creating value. This is reflected by the low score of the profitability index.
340 15.2% 5.5 0.10
-542 9.4% 6.9 -0.14
3724 35.3% 3.0 1.05
3220 31.2% 3.4 0.84
55.1% 2.0 2.11
M2 full work week
7800 MT M2 with 2 teams 9528 61.8% 1.8 2.48
Current production 1728 MT
Max production 3024 MT
M1 fully loaded
5880 MT M1 with 5 teams 7511
Production volume
M1 with 2 teams
M2 with 1 team
M1 with 2 teams
M2 with 1 team
Production structure
Results
NPV [k€] IRR
20
Investing in a production facility to support a near fully loaded plant will be a feasible alternative. The facility will be producing enough masterbatches to justify the decision as is reflected in the
indicators. The NPV is above €3 million for both types of machines, which is an efficient return on the amount of investments made. This is reflected in the profitability index, as the smaller machine has a profitability index higher than one, which means that it is a good investment decision. The bigger machine will still be a worse choice than the smaller machine, because the capacity used is still too low.
The alternative of a fully loaded machine 1 is a very attractive one. The NPV and IRR are high enough to make this an attractive investment. The profitability index also shows that the capital invested is used efficiently.
The last alternative of the second machine manned by a team on a normal workweek is the first alternative where the bigger machine is more attractive than the smaller machine. All the indicators point toward a very lucrative investment. The bigger machine will only be attractive if there is an opportunity to produce and sell more than the capacity of the smaller machine, or 5880 MT per year. It can be concluded from these results that either the production of carbon granulate needs to rise, or the remaining capacity of masterbatches should be sold to third parties. If neither of this is possible, it should be concluded that the project is unfeasible and should be stopped.
4.2.1 Sensitivity analysis
[image:25.595.72.525.414.557.2]For each alternative, four setbacks in the project have been calculated, but only the second scenario will be discussed in detail. The effects of the sensitivity analysis are quite similar, so it is sufficient to discuss one scenario. The results are shown below in Table 12.
Table 12: Sensitivity analysis
The most influential setback is a project delay since this severely lowers all values. The difference is almost €1.5 million in the NPV, a drop of 37% in value for machine one and 42% for machine two. The delay causes not only a greater expense in construction costs, but also reduces the savings for the first year greatly as the masterbatches need to be bought from the tollers. The plant still needs to produce granulate and needs masterbatches to do so. Thus the masterbatches have to be bought from the tolling companies. This means that if the project is accepted, the project has to be prepared into great detail to minimize the chance of a delay. If a larger investment in construction and/or planning costs is needed to minimize the risk of a project delay, than that is a good decision. This is because an increase in investment costs by 10% has a smaller effect on the feasibility of the project than a project delay. The NPV will decrease by 10% and 13% for machine one and machine two respectively.
Base case 3724 35.3% 3.0 1.05 3220 31.2% 3.4 0.84
Plus 10% investment 3342 31.5% 3.3 0.85 2808 27.7% 3.7 0.67 Minus 15% volume 2616 29.1% 3.6 0.74 2144 25.5% 3.9 0.56 Plus 10% manufacturing costs 3599 34.6% 3.1 1.01 3073 30.5% 3.4 0.80 Project delay of 6 months 2357 24.8% 3.2 0.66 1854 21.9% 3.5 0.48
PI NPV
[k€] IRR
Payback
[years] PI
Machine 2
Results
Max production 3028 MT
Machine 1
NPV
[k€] IRR
Payback
21
Another influential setback will be a decrease in the volume of masterbatches needed to support the carbon granulate production. It is necessary for the feasibility of the project that the volume
produced is high enough to justify the investments made in the buildings and machines. When the volume of the masterbatches decreases by 15%, the NPV decreases by 30% for the machine one and 34% for the machine two. A proper indication of the necessary volume of masterbatches for at least the first five years should be made. The volume of masterbatches needed is an important factor in the feasibility of the project. If the volume estimated is too high, the project could be less valuable than estimated, which could be a problem for the company, as it could be stuck with a production facility with low efficiency. However, a too low estimate of the volume of masterbatches needed, is not a problem as there is excess capacity on the machines.
4.3 Conclusion of the profitability calculations
What is the feasibility of the different alternatives of setting up a production facility?
The conclusion of this research is that with the current production level of carbon granulate it is not feasible to support a production line of masterbatches. The capacity of the compounding machine used is too low to justify the investments needed to set up a facility for it. This is reflected in the performance indicators, as the NPV is only €340.000 with an investment of over €4 million. Therefore, in the current situation the project should be rejected.
However, if the production of carbon granulate will rise towards its capacity, the project will become feasible. The compounding production line will be producing enough to justify the investments, however the performance indicators are not that high to remove all doubt on this project. The NPV has a value of €3,7 million and a PI of 1.05, which indicates a profitable project. These values are calculated in the most favourable conditions and any setbacks in the project will push the indicators below acceptable levels. The project will be feasible, but further research will be needed to make a final judgement.
The smaller machine of 700 kg/hr is certainly feasible if it is producing near capacity. This can only be achieved by selling the remaining capacity to external parties. However, the masterbatches can be sold at competitive price as it is more important to sell volume than to achieve a high margin on the product. If this will be possible to achieve, this will be a very profitable investment as it has a NPV of €7.5 million. The plant as a whole will increase in value and the plant will be independent of the suppliers of masterbatches. The project should be accepted if this scenario will be possible. The bigger machine of 1950 kg/hr has more growth potential than the smaller machine. The extra investments needed are marginal as the machine itself is only a small portion of the total investment. Thus, if there is a possibility that more than 6000 MT of masterbatches can be used or sold, the bigger machine will be a good choice.
Other benefits to accepting this project is a reduction of transportation, which in turn reduces the carbon footprint of the plant. Thus less CO2 emissions are needed. The plant will also be able to
22
5 Conclusions
What costs are made by buying masterbatches from tolling companies?
[image:27.595.72.281.143.237.2]The following costs are made by buying masterbatches:
Table 13: Costs of buying masterbatches
The first grand total for 1728 MT is amount of masterbatches needed to support the current
production level of carbon granulate. The second grand total of 3024 MT is an extrapolation of when the production level of carbon granulate is producing at its capacity.
What are the possible and feasible production capacities of the production of masterbatches?
[image:27.595.69.482.375.537.2]Four different production capacities are investigated each with their own combination of type of machine and number of teams of operators.
Table 14: Alternatives
What investments need to be made to set up a production facility to make masterbatches?
The investment costs differ in type of machine bought, as machine 2 is more expensive than machine 1. However, the building constructed is the same for both machines.
Table 15: Total investment costs
Total costs per year Supplier Tolling fees € 1,032,480 Transportation € 191,136 Handling € 29,675 Grand total (1728 MT) € 1,253,291 Grand total (3024 MT) € 2,030,766
•Machine 1 with 2 teams •Machine 2 with 1 team Current production
granulate (1728 MT)
•Machine 1 with 2 teams •Machine 2 with 1 team Max production granulate
(3024 MT)
•Machine 1 with 5 teams Max production machine 1
(5880 MT)
•Machine 2 with 2 teams Machine 2 with regular workweek
(7800 MT)
Machine 1 Machine 2 1,477
€ € 1,799 2,565
€ € 2,565 133
€ € 146 4,175
€ € 4,510 Total investment costs (K€)
Grand total
[image:27.595.69.336.624.720.2]23
What are the operational costs of producing masterbatches?
[image:28.595.75.451.135.184.2]The operational costs differ in each alternative. Each production level of masterbatches has its corresponding total operation costs.
Table 16: Total operational costs
What are the values of the performance indicators for the different alternatives?
By setting up the cash flows using the data gathered to answer the previous sub questions, a net present value is calculated for each alternative. To keep the table concise, only the net present value has been displayed, as this is the most accurate indicator used. The other indicators are only used in combination with the NPV. This gives the following six results:
Table 17: Performance indicators
What is the feasibility of the different alternatives of setting up a production facility?
1728 MT
At the current production level of carbon granulate and with no sales to external factories, it is not feasible to setup a production facility for masterbatches. The investments needed are too high in comparison to the savings made from not buying masterbatches. Thus, if little growth is expected in the production of carbon granulate and it is not possible to sell to others, the conclusion is that this project should be stopped.
3024 MT
In the case of the production level of carbon granulate reaching its maximum capacity, this project sees a sufficient return to justify further development. Thus, if a significant growth is expected in the production level of carbon granulate, it is justified to further develop this project. In this alternative the project is feasible, yet it is still uncertain if it would be a profitable project.
1728 MT 3024 MT 5880 MT 7800 MT
214
€ € 282 € 434 € 540 Production level of masterbatches
Total operational costs (K€)
340
-542
3724
3220
Very good
Excellent
Evaluation
Results
Bad
Bad
Sufficient
Sufficient
M2 full work week
7800 MT M2 with 2 teams 9528
M1 fully loaded
5880 MT M1 with 5 teams 7511
Current production 1728 MT
M1 with 2 teams
M2 with 1 team
Max production 3024 MT
M1 with 2 teams
M2 with 1 team
[image:28.595.70.472.291.501.2]24 5880 MT
In the alternative that machine 1 is fully loaded and producing continuously, the project has very good prospects and should be further developed. It is certainly feasible under these assumptions and should definitely be pursued further. However, there is need for an investigation into the possibility to sell masterbatches to other factories as the production volume is too high to only support the production of carbon granulates. Without an external demand, this alternative is not possible. 7800 MT
Finally, the alternative of machine 2 producing during a full workweek is even more positive than a fully loaded machine 1. This alternative still has growth potential, whereas the previous alternative was producing at its capacity. However, this alternative is only feasible if there is a strong demand for masterbatches, because a large percentage of masterbatches needs to be sold externally. If there is a strong demand for masterbatches, this is the alternative to choose.
“Is setting up a production facility to produce masterbatches feasible?”
Setting up a production facility solely to support current production level of carbon granulate is not feasible. However, if the production level of carbon granulate is expected to grow significantly, the project is feasible, and further research into this project is justified.
The project becomes very interesting and possibly profitable if there is a possibility of selling
masterbatches to external parties. A continuously producing compounding machine shows signs of a very profitable project with a very good return on investment.
5.1 General conclusion
The feasibility of this project depends greatly on the possibility of finding external buyers for the masterbatches. The production facility is too expensive and not feasible if its only function is to support the carbon granulate factory, even if the production of carbon granulate grows steadily the coming years. In this situation, I would recommend terminating the project.
25
5.2 Recommendations
The most important aspects that are left out of this research is to determine the capacity of the production line with a higher degree of certainty. To determine this the following components should be investigated further:
Possible growth of the production volume of the carbon granulate.
o The project is dependent on the amount of masterbatches needed to support the granulate production. If the growth prospects are very positive, this project could become more and more feasible as time goes on. However, a negative growth prospect will make this project at its current state even less feasible.
Investigate the possibilities to sell the masterbatches to in- and external customers and at what price.
o The internal customers are customers from within the parent company. There are more plants within the company that use masterbatches in their production process. It will be beneficial if they will be supplied from within the company instead of external suppliers. However, due to the sensitivity and the early stage of this research, it was not possible to gather information about the possibility of selling it and if so at what price.
26
Bibliography
Balakrishnan, R., Sivaramakrishnan, K., & Sprinkle, G. (2008). Managerial Accounting. John Wiley & Sons, Inc.
Brealey, R. A., Myers, S. C., & Allen, F. (2011). Principles of Corporate Finance. New York City: McGraw-Hill Irwin.
Dagostino, F. R., & Peterson, S. J. (2009). Estimating in Building Construction. New Jersey: Pearson. Graham, J. R., & Harvey, C. R. (2001). The theory and practice of corporate finance: evidence from
the field. Journal of Financial Economics 60, 187-243.
Padillo, J. M., & Diaby, M. (1999). A multiple-criteria decision methodology for the make-or-buy problem. International Journal of Production Research, 3203-3229.
Welch, I. (2009). Corporate Finance. Boston: Prentice Hall.
Glossary
Carbon granulate = main finished product of the factory
Masterbatches = component in the production of carbon granulate Tolling companies = companies supplying master batches
27
Appendix
P ro fit a b ili ty C a lc u la tio n Pr o j.: In v e s t: 2015 0 k EU R d is c o u n te d w ith 12% 0 k EU R 2016 0 d is c o u n te d w ith 12% 0 2017 0 d is c o u n te d w ith 12% 0 2018 0 d is c o u n te d w ith 12% 0 2019 0 d is c o u n te d w ith 12% 0 S 0 k EU R S 0 k EU R (N e t) a d d . O p e ra ti n g 25% O p e ra ti n g O p e ra ti n g D C F -C a s h a fter Pa
28 Appendix 1: Profitability calculations template