Combining usage and profile data
for retrospectively analyzing
usability of applications
with funnels
Thijs Wiefferink
[email protected], s1366564
Master Thesis
Master Computer Science (Software Technology
specialization)
University of Twente
May 2017 - March 2018
Supervisors from the University of Twente Marten van Sinderen ([email protected]) Arend Rensink ([email protected])
Supervisors from Staying, located in Amsterdam Emiel Mols ([email protected])
Abstract
This research project shows how usage data gathered using analytics tools from apps and websites can be stored in a structured and scalable way, so that it can be combined with profile data (from the application itself) when the company has questions about their users. Building on this setup this project shows how common application processes, like user sign up, can be tracked and visualized in funnels. A funnels shows how many users successfully made it to each step of a process, giving insight into their behavior. Next to that funnels can show context information to help companies determine why certain users continued or not. These funnels help companies to correctly track usage of their product, so that they know which parts to improve, and if their changes are actually an improvement.
Keywords
Preface
Contents
1 Introduction 7
1.1 Research domain . . . 7
1.2 Analytics question example . . . 8
1.3 What is a funnel? . . . 9
1.4 Problem statement . . . 10
1.5 Goals . . . 10
1.6 Research questions . . . 11
1.7 Relevance . . . 11
1.8 Case study at ’Staying’ . . . 11
1.9 Structure of the Staying application . . . 12
1.10 Approach . . . 13
1.11 Report structure . . . 13
2 Existing research and solutions 15 2.1 Analytics systems . . . 15
2.2 Usage (analytics) data storage . . . 15
2.3 Profile (application) data storage . . . 16
2.4 Existing funnel visualizations . . . 16
2.5 Challenges to be solved . . . 17
3 System requirements 19 3.1 Answer analytics questions . . . 19
3.1.1 Generic questions . . . 19
3.1.2 Questions by Staying . . . 19
3.1.3 Charts . . . 20
3.2 Build funnels: tracking of business processes . . . 21
3.2.1 Funnel features . . . 21
3.2.2 Funnel challenges . . . 21
3.3 Non-functional: scalability and interface . . . 22
4 System architecture 24 4.1 Structure . . . 24
4.2 Multi-server storage . . . 25
4.3 Database technology: PostgreSQL+CitusData . . . 25
4.4 Profile data storage . . . 26
4.5 Analytics events storage . . . 26
4.6 Answering analytics questions . . . 28
4.7 Building funnels . . . 29
4.7.1 Required funnel data . . . 29
4.7.2 Funnel data format . . . 32
4.7.3 Multi-identifier tracking . . . 34
4.8 Visualizing funnels . . . 35
5 System implementation 37 5.1 System environment . . . 37
5.2 Database: PostgreSQL and CitusData . . . 37
5.3 Profile data storage . . . 38
5.5 Funnels . . . 41
5.5.1 Funnel display . . . 41
5.5.2 Funnel structure . . . 43
5.5.3 PostgreSQL jsonb syntax . . . 45
5.5.4 Step-by-step funnel implementation . . . 45
5.5.5 In-database funnel implementation . . . 51
5.5.6 Real-time funnels . . . 54
6 System validation 55 6.1 Fitness for purpose of the database . . . 55
6.1.1 PostgreSQL limitations . . . 55
6.1.2 CitusData limitations . . . 55
6.1.3 Retrieving events from the system . . . 56
6.1.4 Using the system to answer questions . . . 57
6.2 Defining funnels using the system . . . 61
6.2.1 Defining the funnel: builder pattern . . . 61
6.2.2 Flexibility and modularity . . . 62
6.2.3 Context information: notes . . . 62
6.2.4 Funnels created for Staying . . . 63
6.3 Funnel display evaluation . . . 70
6.3.1 Testing in practice at Staying . . . 70
6.3.2 Basic statistics display . . . 71
6.3.3 Splits and merges display . . . 72
6.3.4 Notes display . . . 72
6.4 Performance and scalability . . . 73
6.4.1 Scaling . . . 73
6.4.2 Query performance . . . 73
6.4.3 Funnel performance . . . 74
7 Discussion 75 7.1 Results . . . 75
7.2 Related work . . . 75
8 Conclusion 76 8.1 Answers of the research questions . . . 76
8.2 Limitations of the solution . . . 76
8.3 Research value and practical value . . . 77
8.4 Future work . . . 79
9 Acknowledgments 80 10 References 81 Appendices 83 A Analytics tools features 83 A.1 Analytics tools selection . . . 83
A.2 Investigated analytics tools . . . 83
A.3 Analytics tools concepts and features . . . 84
B.1 Requirements . . . 86
B.2 System architecture . . . 86
B.2.1 Input . . . 87
B.2.2 Storage . . . 88
B.2.3 Analysis . . . 88
C Staying analytics solution 90 C.1 Architecture . . . 90
1
Introduction
This chapter describes the research domain, illustrates the question that sparked this project and provides information about the environment in which the project has been executed.
1.1
Research domain
In this digital age we all use a lot of apps and websites [9], which we would like to be as easy to use as possible. To build applications that fulfill this wish, the companies working on them gather an increasing amount of data [23]. This data could contain information about the pages users visit, the features they use, and any other relevant actions. Together this data is called usage data, or in a more generic way; analytics data. In this project all usage data of customers using a product of a company is meant. Next to this usage data company also has application data, such as user profile data containing name, email, date of birth, anything else the company stores. The other types of application data that a company has for a product depend on the product itself. For a chat service it would be chat groups and messages, and for a file storage service it would be files and folders.
By analyzing usage and profile data the company can make changes to improve their Key Performance Indicators (KPI’s). The most important KPI of a com-pany is usually revenue, since that is the end goal of a comcom-pany. Other secondary KPI’s of a company could be the number of daily active users, purchases per week, etcetera. Even though companies gather more and more data, collecting the right data that is required to extract relevant statistics is still a challenge. Often the company comes up with a new question about the usage of their soft-ware product, and find out that they did not collect the necessary usage data to answer this new question. Section 1.2 illustrates the process of coming up with a new analytics question, gathering the required data and answering the question.
Figure 1: Answering an analytics question: approach options
1.2
Analytics question example
For tracking users on a website and/or app there are numerous products avail-able, each with their strong and weak points. Setting up one or more of these products is easy and can quickly give the company basic statistics about their product. However, after the basic questions (like how many users visited page X last week?) there will probably be more detailed questions these analytics solutions do not answer. To illustrate the process of answering an analytics question a basic flowchart has been created, shown in Figure 1.
There are three possibilities, the first is that all required information is already available in the usage data, which means that with a query of some sort (SQL or some visual tool) the question can be answered. This option is quick and can provide the answer almost immediately. For example, a company wants to know when an user was active for the last time, which could be answered immediately by finding the last activity of the user in the usage data. This option assumes that the company has full access to the usage data, which is the case with most, but not all, analytics tools.
to answer it is slowing down the improvement of the product, which is not good for the company.
For the above question there is another option that is in between the two given options, which is to immediately combine the usage and profile data. This means combining the usage data from the analytics tool and the profile data from the application at query time, which allows answering the questions immediately. In this case it would mean combining the data of a user with the app usage events of that user, so that usage events can be grouped or filtered by language. To be able to use this possibility, there are requirements for the storage of the two data sources and the format the data is stored in. These requirements are described in Chapter 3. The option of combining usage and profile data immediately is what this project researches, which leads to the requirements for this option, its effectiveness, limitations and performance. To demonstrate that the combination of usage and profile data works correctly a prototype system to answer analytics questions and build funnels (overview of analytics about a step-by-step process performed by a user) has been created.
1.3
What is a funnel?
A funnel is a visualization of a sequential business process of multiple steps, showing how many users completed each step. This definition is hard to under-stand, so let’s start from the beginning, with a business process. Such a process could be sending a newsletter, a new user signing up, a purchase in a web shop, or anything else. Each of these processes consist of multiple steps, where each step is an action performed by a user that brings him closer to the end goal of the process. Let’s walk through sending a newsletter as example, this process has the following steps:
1. The company sends a newsletter
2. Users open and read the newsletter
3. Users click a link in the newsletter, visiting the website
These three steps are the key steps of sending a newsletter. For each of these steps the company would like to have statistics. The company could have ques-tions like ”To how many people have we sent a newsletter last week?”, ”How many people opened/read the newsletter?”, ”How many people visited the web-site because of the newsletter?”. To answer all questions about a process with multiple steps, like this one, a ’funnel’ can be created to show all relevant statistics. A funnel shows the steps of a process, each with statistics about the number of people that made it to the step. Funnels are used to show how many of the users that started the process, make it to the end, while showing where in the process users drop out if that is the case. For individual steps in a funnel additional context information could be shown, for example the percentage of users that visited the website using a mobile device for the third step of the newsletter funnel.
why funnels are so valuable. Funnels condense the information to the statistics that are most valuable for the company, while hiding the raw data. Funnels are important for companies to measure how effective each step of their process is, so that more effort can be put into improving the weakest steps. For example if a high percentage drops out of the funnel after reading the email, it could mean that the email is not convincing enough, or that it gets caught by spam filters. So when the company knows the email is not effective it can redesign the email, improve spam scores or something else. To show that the systems works as expected funnels of the most important processes of a company could be created.
1.4
Problem statement
Collecting and visualizing analytics is easy for tracking simple statistics like page visits. However, customizing the collection and visualization is not as easy. Challenges that appear are scalability, flexibility, processing, reporting and missing data. Most of these challenges can be solved using existing tools, but combining them to get a system that works is not straightforward. The two key points of this research are solving the missing data problem and visualization using funnels.
The missing data problem occurs because companies don’t know which questions they will have in the future, and therefore it is unknown which data needs to be collected. When information missing to calculate the desired statistic, it can be added to the collection software. The problem is that this new data is only collected from the point in time that the collection software is updated. This causes a delay because now the company needs to wait for more data to come in before the desired statistic can be calculated. To prevent this problem, profile and usage data could be combined to fill in the missing data immediately. The problem with combining usage and profile data is that these sources have different storage types (an event stream versus a relational database), are stored in different systems and might not have a common field that allows combining them (like a user id).
Funnels are used to visualize statistics about processes in products of companies. The first part of building funnels is collecting the required statistics, which can be done by querying the combined usage and profile data. The solution of the missing data problem provides a way to do that. The second part of creating funnels is displaying the results in a way that is easy to understand (also for non-technical employees of the company). For designing this interface different solutions by analytics providers could be compared, adding features where necessary. User testing with people of a company also can be done to improve the visualization step-by-step.
These problems are analyzed, solved and presented in this Master Thesis.
1.5
Goals
funnel, answering more complex questions about the behavior of users of a software product.
A challenge of implementing funnels is tracking users through all steps, possibly connecting different identification methods (email, session id, user id, etcetera). Another challenge is building a clear visual representation, making it easy to understand for everyone in the company.
1.6
Research questions
The following questions are answered in this project:
1. How can usage and profile data of a software product be used more effec-tively for improving usability?
(a) How effective is retrospectively combining usage and profile data to answer analytics questions?
(b) How can business processes be tracked and visualized in a funnel?
1.7
Relevance
The problem that is investigated is relevant for most companies that develop an application where usage and profile data is involved. The application could be an app, web app (website with some state saved server-side) or general computer application. Companies that have a mature analytics solution probably already dealt with this problem in some way or form, most likely by adding (a part of) the profile data in the usage data. For example adding the language of a user to all his actions that are collected as usage data. This project wants to prevent duplication of the profile data and will combine data from both sources at query time. This would make it easier for, especially fast moving startups, to get the information they need from the analytics so that they can improve their product by focusing on the most important aspects of it.
Visualization of the analytics results makes the results accessible for all people in the company, instead of only the technical guys that know how to write SQL queries. This research helps the adoption of funnels, and in particular funnels for complexer process with additional context information.
1.8
Case study at ’Staying’
In order to validate the solutions proposed in the project, a case study at the company Staying 1 has been performed. This way the ideas and plans are tested in practice, which will reveal the practical challenges and provides data to evaluate and benchmark the solution. Each step of the research project will take into account how the presented solutions would work for companies in general, ensuring the end result is applicable for any company that faces the same problem. The visualization of funnels can also be tested this way, to improve it further. Staying is a startup company located in Amsterdam that creates an app for hotels to chat with their guests. Next to chatting, the app
provides information like nearby tourist attractions, restaurant menu, wifi code and anything else the hotel wants to show. In addition to this app used by guests there is a web app, called the portal, where accommodations upload the information they want to show and answer the chat messages of the guests. Staying is trying to find the right market fit, and is working to optimize two main processes: property signup and guest invites. For both of these processes it is important to be able to measure the results correctly and quickly, so that changes can be made to improve them. Especially in the starting phases of a company it is important to be able to make and measure changes quickly, so that the turnover time is low.
More details about what Staying does and how it is technically organized follows in the next section.
[image:13.595.137.457.323.643.2]1.9
Structure of the Staying application
Figure 2: Staying application structure
by one or more users, which are the owners (as a specialized type of user). A venue invites guests when they make a booking, this booking is represented as a stay. A stay has the arrival and departure date and is connected to a user representing the guest. Venues have content items linked to it, these content items are pieces of information like the wifi code, metro map, restaurant menu, etcetera. Content items can be created for different languages, so that the guest sees the content for his language in the app. Owners of a venue manage the content items and other venue settings in the web portal. Each Stay is linked to a Chat, in which the owners of the venue and the guests of the stay can chat. The Chat contains of a list of messages. Messages have a sender, time and platform (they could be send from the portal, venue app, guest app or by SMS message).
1.10
Approach
To solve the missing data problem the profile and usage data have been brought together into a single system. A common solution used in practice at companies is to add profile data to usage events when these events are inserted into the database, this means that the combination of data happens at write time. The approach in this research is different, it brings together the data at read time. Adding data to the analytics when writing it into the database can inflate the analytics storage a lot, that is why usually only a subset of the data is inserted into the analytics. Only adding a subset of the data leads to the exact missing data problem this research tries to solve. Instead only adding the required links between data to allow combining it at read time solves the problem, which has been researched, implemented and tested in this project.
When the solution for combining profile and usage data works a funnel visu-alization will be made. This implementation will track users even if they are identified by multiple different tokens. The visualization will support merge/s-plit, so that processes that have multiple paths towards an end goal can be shown correctly. The main processes of Staying (property sign-up and guest invites) will be used as test cases. Together with Staying the test cases will be reviewed and the interface of the funnels will be improved upon using the feedback.
1.11
Report structure
2
Existing research and solutions
This chapter analyzes existing work in the field and the current analytics solu-tions used by companies.
2.1
Analytics systems
There are a lot of analytics systems available for companies to use, with varying features, price and possible uses. In Appendix A the most used tools can be found, with descriptions of their features. The features of these tools, from showing simple statistics to showing exactly how many users followed a certain process, are used for the requirements set for the system that will be build in this project. After the common features of these systems have been determined, the system architecture of analytics systems has also been identified. In Appendix B the requirements and architecture for a generics analytics system are described. This has been done to know the current possibilities of analytics and to gather information to create a system that can combine usage and profile data. The first feature that has been identified is answering simple analytics questions (like the number of visits of a web page, how many times a certain action happened, etcetera). Build on the concept of answering questions there are more advanced features, like funnels and charts. Funnels combine simple questions in a step-by-step process to get information about for example sign up of a user on a website. Charts are a logical extension of simple questions, because companies often also need to see the result over time.
There is already a lot of research about usage of analytics systems for tracking websites and apps, for example using Google Analytics in the food industry [25], tourism industry [26] or measuring and improving a library website [21]. These studies are relevant for knowing how companies and researchers use an-alytics tools, so that the system build in this project can also support these activities. There are also different tracking approaches like click heatmaps [19], which are used to track mouse movement of users. More tracking options are available, but after capture of everything that happens on a page almost any visual representation can be created using the available data.
Currently there are so many analytics tools used that people start using browser extensions like Ghostery [8] to block all trackers on visited websites. Often is not necessarily data collection itself that is the problem (at least if it is anonymous), but the bandwidth used by loading the trackers and the slow page load caused by them. This is especially the case on websites with advertisements, since each advertisement comes with a couple of trackers to measure their effectiveness.
2.2
Usage (analytics) data storage
systems like Hadoop are intended for file storage, and are not suitable for a relational database. Key-value stores are used to map keys to values, which is really efficient for certain usage patterns, but storing all profile data in it will likely not work. They are also not meant for storing usage events, since they have no concept of time and order, therefore cannot take advantage of usage events that are sorted by time. Since especially for combining profile and usage data joining tables is important, document databases are also not ideal. Multi-server scaling is important for analytics storage, since the data will always keep increasing. Efficient time filtering is also important, since often getting result will be limited to a certain day/week/month, which should limit the search to only a small part of the collected analytics.
2.3
Profile (application) data storage
Storing profile data has different requirements as storing usage data. It de-pends a lot on the particular application that the company has, but generally speaking relational databases are used often. Different implementations exist, like MySQL, PostgreSQL and Oracle. The requirements for profile data will be discussed in Chapter 3, which are based on experience working at compa-nies and the public data available for compacompa-nies. There are plenty of research projects that design and implement new databases, but this is not relevant for this project. This is because to make the solution available for as much compa-nies as possible it should work with the most commonly used database types, and not necessarily experimental or new databases.
2.4
Existing funnel visualizations
There are existing funnel visualizations available, which solve certain use cases already, but not all of them. Google Analytics offers some tools for this space, it allows defining a goal, which could be creating an account, visiting a certain page or something else. After creating this goal a path of actions can be defined that users are expected to take. After defining these the ”Goal Flow” page shows the statistics for the defined funnel. An example can be seen in Figure 3. This example shows users going to the home page of the site, and after that going to the vote page, which is a common path for this data source. Google analytics shows the drop off per step, including which page the users dropped off to. This example also shows that a funnel is not necessarily without loops. Google Analytics draws a line from the vote step back to the home step, indicating that some users went back to home. This shows that funnels are actually graphs, and showing them as a sequential list of steps is a simplified representation. Google Analytics does show loops, but does not offer merge/split mechanics, so it is unable to draw the guest invite process of Staying. Another problem to get funnel in Google Analytics is that all events need to be sent there, and the missing data problem would occur again. Funnels can be made retroactively, but the events already need to exist, which makes it likely that there is an event missing.
Figure 3: Google Analytics Goal Flow diagram
their software is added to. So because all data is captured, Heap allows defining events retroactively. This solves a part of the missing data problem, because events do not need to be sent explicitly as with Google Analytics. The funnel visualization of Heap, as seen in Figure 4, is however more simplistic. Context information is available for the users in a step, but will simply show a list of actions for each user. Heap still does not solve combining profile and usage data, since the only available option is to add all profile data to the events.
2.5
Challenges to be solved
3
System requirements
This chapter outlines the requirements that companies have for an analytics system that can answer questions, and can be used to create funnels with. First the type of questions a company would likely want to answer are detailed, which are used as a requirement for the system. Secondly funnels and the requirements for building a funnel are explained. Lastly the scalability and non-functional requirements are detailed.
3.1
Answer analytics questions
For the setup of the system that combines the profile and usage data trade-offs need to be made in terms of scalability (how much data can the system store, does it support multiple servers and multiple data centers), speed (how much events per second can it take in, how quick can the system combine and export data, how quick do SQL queries run), ease of use (setup time and complexity, can it be applied to existing systems, maintenance time), etc. To support these decisions it is important to know what kind of questions need to be answered by the system. These questions will be based on the needs of companies that build (web) apps, like Staying does. The identified questions will be used as a demonstration and benchmark for the system in the evaluation phase. The questions will be described for companies in general and for Staying specifically. This ensures the solution keeps in mind other companies and does not only work for the specific situation of Staying.
3.1.1 Generic questions
Below a number of questions are listed that could be asked by companies. These questions can either be answered using the usage data, the profile data or both. The base questions are as generic as possible, but can be extended by the ad-ditions listed below. The adad-ditions limit the scope of the question, making it more specific.
Base questions:
1. When did any action <last/first>happen?
2. How often did any action happen?
3. How long did an action last?
4. What is the distribution of property A? (like device size, android/ios, etcetera)
Additions:
• Specific action(s): limit to one ore more actions
• For entity: limit to an application specific entity (user, company, etcetera)
• In time period: limit to a specified time
3.1.2 Questions by Staying
1. When was the last activity from a venue on the portal?
Indicates if the venue is still active, if not the venue could be approached to see why they did not continue to use the platform
>derived from base question 1
2. When was the last activity of a user on the app and/or portal?
For providing support and approaching inactive users.
>derived from base question 1
3. How many times has each content item been viewed?
To show on the portal, indicates which items are most important for the venue. For example it might be a good idea to hightlight the most visited items.
>derived from base question 2
4. How long has each content item been viewed?
Gives more information about the popularity of content items, could indi-cate if a guest actually reads the information in the item or immediately closes it again.
>derived from base question 3
5. When did action X happen last in the app/portal for user/venue Y?
Analytics events contain user actions, which have a type like ’login success’ or ’switched venue’, Staying often like to see when an action happened last to assist better when providing support or approaching a venue owner.
>derived from base question 1
6. How often did action X happen in the app/portal for user/venue Y in time period Z?
For example how often did a venue edit content items, how many times it visited the portal, etcetera. This can be used to focus the development on the most used parts, or focus marketing on features that are not much used.
>derived from base question 1
7. Which device types are used per venue type?
Find the percentage of mobile, tablet and desktop/laptop users per venue type (lodges, apartments, hotel). This information can influence the de-velopment of the portal to focus more or less on compatibility with mobile devices with a small screen.
>derived from base question 4
3.1.3 Charts
While answers to the mentioned questions provides basic information about the state of the application and its users, a business often wants to know answers to these questions over time. Charts can be made using the question to show the answers for each day/week/month, whichever makes the most sense for the type of data. The effect of this addition to the demands of a business for the analytics system is that it needs to handle time based filtering and grouping efficiently.
which the rollup of the current day can be either updated with partial results (if there are more hours to come in this day), or finished (if this was the last hour). This solution is well known and used to keep charts of historic data quick to calculate.
3.2
Build funnels: tracking of business processes
Besides questions as described above, most companies also want to track their important business processes. To track these processes a funnel can be created, as described earlier. The following sections explain which features/statistics are expected to be in funnels, and the challenges that need to be solved to implement these features in a funnel.
3.2.1 Funnel features
For a funnel to properly support the company in making decisions there are a number of important features that need to be available. Below is a list of features that, in this case Staying, needs:
1. Selection of the entities that should be tracked.
2. Tracking of single entities through the funnel.
3. Per step information:
(a) Number of entities that made it.
(b) Percentage of entities compared to the initial step.
(c) Number of entities that stopped (possibly splitting into groups that have different causes).
(d) Number of entities that continued.
(e) Number of entities that rejoined (skipped the last step(s), but still did this one).
4. Custom statistics at steps (optional):
(a) Distribution graph or table for a certain property of the tracked entity (for example user language).
(b) Subsets of entities that performed a certain action (for example select ’remember me’ checkbox)
3.2.2 Funnel challenges
could be linked to the identifier for further tracking. This allows for easier tracking since analytics after sign up could use the user information instead of the identifier from the first marketing email. A system for creating funnel needs to support multiple identifiers for each entity, allowing for better tracking.
A second challenge comes when a funnel splits or merges. Following a process could be drawn as a directed cyclic graph. It would mean the user can follow certain steps, in any order and repeat some steps when they want to. Tracking such activity and displaying it is really hard, so that is why funnels are often simplified. The most basic way would be a sequential list of steps, showing how many users made it to each step. This simplification already allows companies to track most processes. To support situations where a user can choose from multiple paths to get to the next step funnels need to be a bit smarter. This could mean introducing split and merge steps, to allow for multiple paths.
A funnel could split if two possible paths can be followed, meaning both need to be tracked and showed correctly. This complicates the result calculation of funnels and makes them harder to display. Care should also be taken to keep the implementation maintainable.
3.3
Non-functional: scalability and interface
For the system build in this research project there are a couple scalability re-quirements to ensure that the system can handle large data sets for big or quickly growing companies. The scalability requirements are as follows:
1. Multi-server support: spread data among servers, with a redundancy factor
2. Redundancy support: multiple physical locations.
3. High throughput: up to Booking.com scale (2 billion events per day, which is 83.3 million per hour, 23148 per second, where the average event is around 10kb in size).
4. Low latency: simple queries should be completed in 100ms or less.
5. Good interface: the interface showing the result of funnels should be clear and easy to use.
6. Flexible: the system should be flexible so that it can be adjusted to the situation of the majority of companies.
7. Maintainable, secure: changing and updating the system should be easy and taken into account with the design.
Multi-server support is a requirement because storing and using huge data sets on a single server is not possible. Spreading data among multiple servers spread the CPU load and scale the system horizontally (adding more servers) instead of vertically (using a single more powerful server).
High throughput is the next requirement, which ensures that the system can scale with the company using it to handle large customer groups. High through-put is defined as the scale that Booking.com operates on, which is known from one of their blog posts2 with some extrapolation. If the scale of Booking.com usage and profile data works with the system, it will be suitable for the majority of companies.
Low latency is another requirement for the system. This means for example a query getting data about a user should not take more than 100ms, but preferable a lot less. Since the acceptable response time depends a lot on the type of query that is tested, the validation chapter of this project will test a list of them to make clear that this requirement has been met.
The interface of the results that get out of the system needs to be clear. The interface showing the funnel should be easy to understand and read, following standard design principles.
The system should be flexible so that it can be adjusted to other companies than Staying, so that the solution is not too domain specific.
The last requirement is about the standard software principles, that a system should be secure and maintainable. For security some measurements can be taken to prevent problems in the future, so that the system will not cause harm to the company. Keeping the implementation clean and well designed will make maintenance easier, so that the system can be maintained by other people in the company without too much effort.
4
System architecture
This chapter describes the system architecture that will be used to store usage and profile data.
[image:25.595.138.453.305.560.2]4.1
Structure
Figure 5 shows the architecture created for the system that will store usage and profile data, and can combine it to generate the desired statistics. At the top there is an ’Applications’ block, these are the systems that will read/write the database. For example apps and website will get the data from the system for displaying to the user. Getting this data might go through a backend, which in turn connects to the storage system. The applications also generate usage data, for example the app sends which screens are visited.
Figure 5: Usage and profile data storage architecture
The storage block of the figure shows the database servers, which hold the usage and profile data. The ’Database Master’ is the server that applications talk to, while ’Server 1’, ’Server 2’, etcetera are hidden storage nodes. This multi-server setup uses the PostgreSQL relational database system software in combination with CitusData that allows it to scale to these servers. Section 4.2 explains this in detail.
4.2
Multi-server storage
The storage in Figure 5 is based on PostgreSQL. This is a commonly used relational database system that uses SQL for CRUD (create, read, update, delete) operations on the data. PostgreSQL on its own is meant to be used on a single server (with exception of replication servers for having a live backup). This means that the data size is limited to that of one server and the performance is also limited to one server. Nowadays quite powerful servers can be rented or bought, but this still imposes a hard limit on performance. In this case the most relevant performance aspects are CPU speed, RAM size, network speed and disk speed and size. At the time of writing Amazons EC2 Virtual Private Server (VPS) hosting offers a server type with 128 cores, 1952GB of memory and a 25 Gigabit network connection (called ’X1 Extra High-Memory 32xlarge’, with internal name ’x1.32xlarge’), which would keep a database running for quite some time. However, vertical scaling is only a solution for companies that have a limited data set, that is growing slower than the technology of one machine improves. Therefore horizontal scaling is necessary for a lot of larger and data-heavy companies.
4.3
Database technology: PostgreSQL+CitusData
There are a lot of multi-server database solutions, of which the most popu-lar ones are described in Appendix B. For this system PostgreSQL with the CitusData extension has been chosen. The first reason of this choice is that this solution supports almost the full SQL language, which is widely used and known, making it easy to adapt. The second reason is that importing data from any relational database is easy, with most likely only minor SQL schema changes. This means that if a company currently has their data in a relational database, it is an easy migration path to this solution. A third reason is that a PostgreSQL and CitusData combination can be setup on any server, making it easy to create a prototype for this research project. Even though the prototype created in this project uses PostgreSQL and CitusData, the architecture and solutions of this project can also be used with other technologies.
4.4
Profile data storage
The database as described previously can easily store the profile data of compa-nies. This database works for storing users, messages, chats and a lot of other data. Since the database setup supports all regular PostgreSQL data types (and anything provided by extensions), storing the profile data is easy.
An important aspect of profile data storage is that it can be distributed among multiple servers with a distribution key. A common way to distribute profile data is to group data per customer, CitusData calls this a ’multi-tenant’ appli-cation. Staying provides its application to multiple ’venues’ (hotels, apartment complexes, etcetera), so that is what the ’tenant’ is for Staying. This means that data can easily be split per venue, so that is used as distribution key for most data tables in the application.
Most applications have such an entity that can be used to split all data, if not the performance of the application could degrade depending on the queries sent to the system. Performance of queries that only use one tenant is as good as with a single PostgreSQL database since the query can be sent to the server that has all data for that particular tenant. If a query use data of multiple (or all) tenants it can either let each server calculate results for its own tenants and combine the results in the database master
With this setup the profile data can be stored and queried, fulfilling this re-quirement.
4.5
Analytics events storage
Analytics storage will, just like the profile data storage be in a simple table. To keep analytics storage flexible, but at the same time have structured data that can be used for answering questions and building funnels a storage for-mat has been designed. Analytics normally consists of simple events, each time something happens an event is put into the system, describing what happened (including relevant context information). A simple schema can be used, with just an id, distribution column and data column. The data column is ajsonb
column, which can hold any JSON data. There are a few reasons for using a single data column, the first is to prevent a table with 100+ mostly empty columns. A second is that inserting a single JSON document into the database is a lot easier and quicker than putting everything into the right column. Since PostgreSQL has good support for JSON columns, with indexes and a bunch of JSON functions it does not hard usability. The flexibility this storage for-mat offers is welcome, it allows for storing events with the complexity and size companies need.
To get consistent data in the data column a schema has been defined to structure it, this schema can be found in Listing 1. First there is anat key, which stores
the timestamp of the event. This timestamp is the number of seconds since 1970, with decimals if needed. This timestamp should reflect when the event happened, and not when the event was collected or put into the database. So this could for example be the exact time that a user clicked a button. Next there is a type key, which is a simple string to indicate the type of event. To provide more information about the event an object can be added using thetype
information, like the system that generated the event, the user that the event is about and other references to application tables.
Listing 1: Schema for data of analytics events
1 # Event generated at (seconds since 1970) 2 at: number
3 # Top-level type of the event 4 type: string
5 # Object with more information about this type of event 6 <type>: object
7 # User that this event is about, reference to an application table 8 user?: number
To structure events further, the information object located under the key with the name of the type can again contain atypekey and more information. Listing 2 describes the structure of this information object, which can recursively be used again. This organization allows placing information at the level where it is relevant, without polluting other levels.
Listing 2: Sub-schema for type-specific data
1 # Sub-type of this events 2 type: string
3 # Object with more information about this type of event (same schema as
this listing)
4 <type>?: object
5 # Any other key can be used to store information that is relevant for
all events with the same parent type
Listing 3: Example of using the event schema
1 {
2 "at": 1498780800, 3 "user": 123, 4 "venue": 45, 5
6 "type": "email", 7 "email": {
8 "provider": "mailgun", 9 "id": "abcdef", 10
11 "type": "sent", 12 "sent": {
13 "to": "Thijs",
14 "from" : "University of Twente", 15 "subject": "abc"
16 }
17 }
18 }
Usage of the event data schema as described above is up to the company im-plementing it, but this structure helps with the combination of application and event data in a couple of ways. Firstly, all references to profile data are consis-tently at the top-level of the structure, making it easy to join with entries in those tables. Secondly, events are structured and can easily be filtered by type, making aggregating results easy.
The described architecture of analytics storage can easily store a lot of events and introduces structure to the events to be able to combine them with profile data and clearly type the events with a recursive type structure. This setup pro-vides flexibility while keeping data structured, this is a middle ground between fully ’schema-less’ event storage and completely typed event storage.
4.6
Answering analytics questions
the data to answer a question.
Because of the architecture of the combined database for usage and profile data answering questions is now reduced to simply performing queries in the database. This completes the required architecture for answering the defined analytics questions.
4.7
Building funnels
For building the funnels as described in the requirements of Section 3.2 there needs to be a way to get, store and display the required information. Below the general structure of funnels and how they are calculated is explained.
4.7.1 Required funnel data
To explain which data is required for calculating and displaying a funnel with the features as described in Section 3.2 the following example funnel will be walked through step-by-step.
1. A company sends a newsletter email to subscribers.
2. The subscriber opens and reads the newsletter email.
3. The subscriber clicks on a link to the website.
This funnel will measure how often newsletters sent by the company are opened, and how often this results in visiting the website. Since a funnel always tracks a certain entities through all steps, the first step is to determine which type of entities the funnel will track. In this case the funnel needs to users, these users will receive a newsletter, might open/read it, and could visit the website by clicking a link. In this case a user is identified by its email address, this is however not specific enough to gather data for the funnel. Because the company sends a newsletter each month, the email address alone is not a good way to identify users through the funnel. To properly track users through the funnel a combination of the email address and email itself is required, this could be a unique number attached to each email.
Step 1: Which emails have been sent?
Now that it is clear which entity is tracked in the funnel, a couple of funnel principles need to be explained before carrying on with the architecture variants. First the set of users to track in the funnel is selected, this could for example be based on the time the email is sent, for example to see how the November 2017 newsletter did. For each email that is sent to customers the company puts an event into the database as shown in Listing 4. Important is that it has a unique email id and contains the email template and the newsletter year and month (for filtering).
step. So the result of tracking the first step is a list of email identifiers have started this first step.
Listing 4: Example of an event for sending an email
1 {
2 "at": 1498780800, 3 "user" 123, 4
5 "type": "email", 6 "email": {
7 "id": "2017-11-123456", 8
9 "type": "sent", 10 "sent": {
11 "template": "newsletter", 12 "year": 2017,
13 "month": 11, 14
15 "subject": "Newsletter November 2017"
16 }
17 }
18 }
Step 2: Which emails have been read?
The next step of our example funnel is reading the email, to track this the company collects events like the one in Listing 5. For tracking email reading it is possible to add an image to the email, that will be downloaded when the user opens it. When the server detects that the image is downloaded it creates the event. The event contains the sameid field inside theemail object, which can be used to see which email has been read.
Listing 5: Event for reading an email
1 {
2 "at": 1498780801, 3 "user" 123, 4
5 "type": "email", 6 "email": {
7 "id": "2017-11-123456", 8
9 "type": "read"
10 }
11 }
Step 3: Which emails lead to website visits?
The last event of the funnel looks like in Listing 6. It contains the url that has been visited, and the parameters of the visited page. In this case the parameters contain the email id so that this visit can be linked to the link that has been clicked in the email. Getting results for this step again needs to take into account which email identifiers have started the funnel, just like the previous step.
Listing 6: Event for visiting the website
1 {
2 "at": 1498780802, 3 "user" 123, 4
5 "type": "website", 6 "website": {
7 "url": "https://company.com/article", 8 "params" {
9 "email_id": "2017-11-123456"
10 },
11
12 "type": "visit" 13 "visit": {
14 "session": "abcdefghijklmnopq"
15 }
16 }
17 }
Calculating results
With the email identifiers of each step the results can be calculated. The fol-lowing calculations can be done to gather the results for displaying the funnel:
1. Users that made the step: Count the number of email identifiers.
2. Users that stopped between two steps: Identifiers that are in the first step, but are missing in the second step.
3. Users that rejoined in a step: Identifiers that are in the current step, but are missing in the previous step.
step. The percentage of users that made it to a step can also easily be calculated by comparing it to the users that joined the first step.
4.7.2 Funnel data format
To separate the calculation of the required data from the visualization, an inter-mediate data format is used. This ensures that the software to get the results from the data source is decoupled from the visualization. This allows to easily swap the interface with different visualizations, making it more modular. It also supports swapping out the calculation of results so that for example, support for a different database product can be implemented.
Theoretically funnels could be graphs, but a simplification is applied to create a readable result. Other analytics tools simplify to a sequential list of steps, but this project has a more advanced structure. It allows a step to have par-allel tracks, and these tracks again have steps. The structure of this format is shown in 7, the definition is given in TypeScript types3, since these are clearly documented, modular and could be used when building a visualization.
It starts with the Funnel at top level. This defines the start and end time of the funnel, and a list of options. These options are fields that can be filled in by users, to be displayed in the visualization. Track contains a title and a list of steps. The steps are a mix of typeSingleSteporParallelStep.
SingleStepcontains absolute and relative numbers for identifiers that made this
step, how many came from the previous step, how many continued to the next step, how many stopped, and how many rejoined. It also contains exit data, which can split the people of thestoppedkey into sub groups.
It also contains an array ofNotes, which provide context about the step. ANote
can be of different sub types, which each have their own data. StatisticNote
contains one simple number and title. SubsetNotecontains a number and
per-centage, it could be used to indicate that a certain percentage of users in this step have completed a certain action or meet a particular criteria. TableNote
contains data for a table, the data array maps column names to values (which are any string). GraphNotecontain data for a simple bar graph and defines the x-axis name, y-axis name, maximum axis values, and has a data array. This could be expanded with different graph types in the future, like pie charts, line graphs, etcetera.
ParallelStepdefines a step that has multiple parallel tracks. Each track again
has a title and a list of steps, as described earlier.
Listing 7: Structure of funnel data (TypeScript data format)
1 interface Funnel { 2 start: number 3 end: number 4 track: Track 5 options: Option[] 6 }
7
8 type Option = NumberOption | SelectOption
9 interface NumberOption { 10 type: "number" 11 label: string 12 }
13 interface SelectOption { 14 type: "select" 15 label: string 16 options: string[] 17 }
18
19 interface Track { 20 title: string 21 steps: Step[] 22 }
23
24 type Step = SingleStep | ParallelStep 25 interface SingleStep {
26 type: "step" 27 title: string 28 subTtile?: string 29 result: number 30 totalPercent: number 31 fromPrev?: number 32 fromPrevPercent?: number 33 toNext?: number
34 toNextPercent?: number 35 stopped: number 36 stoppedPercent: number 37 rejoined: number 38 notes: Note[] 39 exit: ExitData[] 40 }
41 interface ExitData { 42 title: string 43 result: number 44 }
45 interface ParallelStep { 46 type: "parallel" 47 tracks: Track[] 48 }
49
50 type Note = TableNote | GraphNote | StatisticNote | SubsetNote 51 interface StandardNote {
52 title: string 53 }
54 interface StatisticNote extends StandardNote { 55 type: "statistic"
56 result: number 57 }
58 interface TableNote extends StandardNote { 59 type: "table"
60 data: Array<{[key: string]: string}> 61 }
63 type: "subset" 64 subset: number 65 subsetPercent: number 66 }
67 interface GraphNote extends StandardNote { 68 type: "graph"
69 graph: {
70 x: string
71 y: string
72 xMax: number
73 yMax: number
74 data: Array<{
75 x: number
76 y: number
77 }>
78 xMap: {[key: number]: number}
79 }
80 }
In this project the data for the funnel is generated using PHP code that connects to the database. The implementation of this PHP code and how to define funnels with it will be explained in the System implementation chapter. Instead of PHP code to build the structure and data of a funnel, a GUI could be created. In this project the goal is to make a flexible tool, that is used by people that know how to program. Since programming a funnel in a programming language offers a lot of flexibility this is suitable in this case. For other companies it might make sense to let marketing or sales employees build funnels, in which case PHP would not be suitable. My recommendation for those companies would be to either create a DSL (Domain Specific Language) to create funnels, which is at a higher level than raw PHP code. You could also go a step further and build a graphical user interface on top of the DSL or other implementation, so that not code needs to be typed to create funnels. I think this would reduce flexibility though, and make the solution more limited.
Another interesting idea is to use an existing business process modeling lan-guage, like BPMN (Business Process Model and Notation), to generate the basics of the funnel. This might give a good starting point for defining the funnel, but you would still need to map events in the usage data to the steps of the funnel. So this will not fully replace a programmatic or visual user interface for defining funnels.
4.7.3 Multi-identifier tracking
In the example used above there is a single identifier for each user in the funnel, the number that assigned to the newsletter email. This identifier is used in each step to check which users made it. In more complex funnels there is often not a single identifier, or it is hard to make sure the identifier is carried all the way through the funnel. To make it easier to track these long funnels, multiple identifiers could be used per user.
After following the funnel for a couple of steps with this identifier (for example email delivered and email read) there is a step where another identifier is in-troduced. In that step the first, and a new second identifier is known, so they can be linked to together (for example user creates an account on the website). After the second identifier is linked to the first one, all following steps can use the second identifier to indicate which users made it. The system will translate the second identifier to the first one, and can calculate and show the results as usual.
This concept will be implemented into the funnel to make them suitable for complex and longer funnels.
4.8
Visualizing funnels
This section will discuss how the interface of the funnel visualization has been designed.
[image:36.595.174.419.482.657.2]The funnels of Google Analytics and HeapAnalytics have the time axis of the funnel horizontally, where the first step is on the left and further steps are right of that. This has as downside that horizontal scrolling is needed if the funnel is more than about four steps. Because my implementation will include notes for each step, and merge/split mechanics this would not be good to display horizontally. Therefore the time axis is displayed vertically for this project. Meaning that first there is a horizontal bar for the first step, with title and description. Attached to this bar there could be notes of different types. These notes should not be bigger or more prominent than the steps themselves, because that could confuse the user about them. Therefore larger notes like tables and graphs will be collapsed by default, only showing their title, and will open when clicked.
Figure 6: Funnel arrow usage
of the previous step next to it. Next to this green arrow there will be a red arrow pointing to the right, indicating how many users stopped, again with an absolute number and percentage. If more is known about why a user stopped, these groups of users could be displayed with smaller red arrows below the large red arrow, to indicate the large arrow splits into several subgroups. Red arrows could be made orange if the number is zero, giving a hint that nobody stopped. As last there could be rejoining users from previous steps, this is visible by an orange arrow at the left of a step, pointing to the right towards the step title. Figure 6 shows the usage of all these arrows. Together these arrows show all paths users can take, and indicate if the path is good or bad. Google Analytics also displays the bad paths as red.
5
System implementation
This chapter describes the implementation decisions and details of the system that has been created to test the architecture of the previous chapter. First the required existing systems are described, after that the application and analytics storage is set up. Next the implementation of funnels is described in detail.
5.1
System environment
Before the implementation starts it needs to be clear in which environment the system will be integrated. The assumption is that there is an existing (single-server) relational database for the profile data, or that the used database can be migrated to a relational database. There could be one or more application (like websites, mobile apps, backend services) that use this profile data. Next to that there is the need for an event based analytics system that tracks certain actions. There could be existing analytics solutions, in-house or by an external company, but that should not interfere with implementing the system as described in this thesis.
The following assumptions are made about existing systems:
1. Profile data can be migrated to a relational PostgreSQL database (either because it is already stored in a relational database or because a migration path is possible).
2. Profile data has unique identifiers for all important data types (like users, chats, messages, etcetera).
3. There is a clear ’tenant’ in the profile data, which can be used to split the data among multiple servers.
4. Applications that use the database can connect to a PostgreSQL database.
Note that assumptions about compatibility with PostgreSQL are specific for this implementation, in general the solutions in this thesis can also be implemented using a different database technology.
5.2
Database: PostgreSQL and CitusData
First of all the servers that run the database need to be set up. There are a couple of options available to do this with CitusData, which will be explained briefly below.
Managed Citus Cloud Deployment
The easiest deployment is to order a Citus Cloud deployment, which is simply selecting the size and storage capacity of the cluster, and it is ready to go. With Citus Cloud there are options to select the amount of RAM and CPU speed of the database servers, and the available storage size. Up to 20 servers can be ordered in the cluster, with servers up to 32 CPU cores and 244GB of RAM. The storage capacity per server can be selected from 512GB to 2TB. Next to this a ’High Availability’ option can be selected, which duplicates a set of server to another datacenter.
Amazon CloudFormation Deployment
A more customizable option is to use the CloudFormation template that Citus provides to setup a database cluster using Amazon. CloudFormation works with a JSON template, which specifies the servers to start, which software to run on them, files to put on them and network and organization connections that should be made. The template sets up a cluster using an automatic scaling group of Amazon, which makes it easy to scale up the cluster. Downsides of this setup is that upscaling does not automatically add the new servers to the database, and that the company itself is responsible for the instances of the database, instead of a database service provider.
This setup is more customizable, but also introduces more responsibility for the user of the database to maintain and monitor it correctly.
Custom Deployment
The most flexible option is installing it on servers bought/rented by the com-pany. In this case the type of hosting, servers and software can be chosen freely. The downside is that linking the servers together and maintaining the cluster is all up to the company. A company would probably need to create some tools to manage a custom cluster like this, so that they can scale it up or down, run updates and do other required changes.
For the tests in this project the CloudFormation template deployment has been used. Instructions to use each of the options described above can be found on the documentation page4 of CitusData.
5.3
Profile data storage
After installation of CitusData on the master and worker servers following the documentation, the tables need to be created. The first step of creating a distributed table is to create a normal SQL table, as shown in Listing 8.
Listing 8: Create venues table
1 create table venues(
2 id bigint primary key not null, 3 name text,
4 city text 5 );
Now that the table is created it is still a regular table, living on the master node. To change this thecreate distributed tablecommand provided by CitusData is used as shown in Listing 9. The first argument of the command is the table name, the second column to be used as distribution key. Upgrading a table to a distributed table will move all existing data (if any) to the worker nodes, according to the distribution key.
It looks a bit odd to use a select to perform this operation, but that is an easy way for an extension to let users execute custom commands.
Listing 9: Promote venues table to a distributed table
1 select create_distributed_table(’venues’, ’id’);
After the distribution as done in the last step, running a query that uses this table will get send to worker nodes. Listing 10 shows the execution plan of
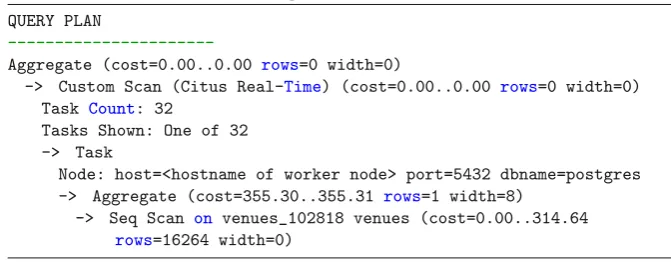
select count(*) from venues;. Line 3 shows that the aggregate count will be calculated. Line 4 shows that it will do a custom scan using the ”Citus Real-Time” executor. This executor divides the query among the workers, in this case it simply passes the query to the workers and adds the result of each worker together. It shows that there are 32 tasks, meaning that there are 32 shards, which is a fancy way of saying that the venue ids have been divided into 32 buckets. And each buckets gets assigned to one of the servers. On line 7 and further it shows one of the 32 tasks (since the plan will normally be the same for all tasks). Line 8 shows which node (database server) this specific plan comes from. Line 9 and 10 show that that is will do a scan on the venues table and count the rows, which is exactly the plan that shows up if this would be a regular table.
Listing 10: Runningexplain select count(*) from venues;
1 QUERY PLAN
2
---3 Aggregate (cost=0.00..0.00 rows=0 width=0)
4 -> Custom Scan (Citus Real-Time) (cost=0.00..0.00 rows=0 width=0) 5 Task Count: 32
6 Tasks Shown: One of 32 7 -> Task
8 Node: host=<hostname of worker node> port=5432 dbname=postgres 9 -> Aggregate (cost=355.30..355.31 rows=1 width=8)
10 -> Seq Scan on venues_102818 venues (cost=0.00..314.64 rows=16264 width=0)
The process above for the venues table can be repeated for more profile data tables, in case of Staying the ’stays’, ’users’, ’chats’, ’message’ and ’content’ tables can be added. A table like the users table cannot be distributed by the venue, since a user can be the owner of multiple venues. So this table can be made a reference table, which means it will get stored completely on each database worker. Listing 11 shows the query to create the users table (simplified users with only an id and a name).
Listing 11: Create the users table
1 create table users(
2 id bigint primary key not null, 3 name text
4 );
[image:40.595.121.457.368.499.2]Listing 12: Promote the users table to a reference table
1 select create_reference_table(’users’);
5.4
Analytics storage
Now that the venues table is created, an events table can be added. This table will also use the venue id as distribution key, will have its own id and have a data column. The SQL statement for creating this table can be found in Listing 13. Note that the primary key consists of the id column and the venue column, having the venue column in this primary key is required to use it as distribution key.
Listing 13: Create venues table
1 create table events( 2 id bigint, 3 venue bigint, 4 data jsonb, 5
6 primary key (venue, id),
7 foreign key (venue) references venues(id) 8 );
Just like the venues table, the events table is promoted to a distributed table, see Listing 14.
Listing 14: Promote events table to a distributed table
1 select create_distributed_table(’events’, ’venue’);
Now both tables are distributed by venue id, meaning that the venue data and events of that venue will be on the same worker node. To show that this setup works, lets follow a simple example. The company wants an overview of the number of events per venue, lets get that from the database. The query as shown in Listing 15 is used to get the result. This query is correctly distributed, meaning that each worker calculates the result for the venues it stores, and the master only combines the results of all the workers.
Listing 15: Get the events per venue
1 select
2 venues.name as venue, 3 count(*) as events 4 from events, venues 5 where
5.5
Funnels
Two different implementations have been made to get the funnel data. The first implementation is simple and easy to build, but does not scale well to a large number of events. This implementation is described first to show how results of a funnel are gathered and calculated. The second implementation is a more scalable implementation, built to solve the scalability issues found in the first implementation. Both implementations use PHP for application code, connect-ing to the PostgreSQL database to gather data and usconnect-ing Smarty (simple HTML template engine) to display the results. Both implementations follow the struc-ture as defined Figure 8 of the architecstruc-ture chapter. First the implementation of the funnel display is explained, since that gives a good idea about the results the implementations need to provide. Afterwards the implementations used to gather these results are explained in detail.
5.5.1 Funnel display
To display the results of either of the funnel implementations described above there are plenty of options. A native interface, an image or a web interface are main options of displaying the funnel results. To let it work on any device with a web browser the display for the funnel of this research project is a web interface. A web interface is also practical because user input is easy with forms, which allows for filtering the funnel to a certain time period (or another criteria). This project uses PHP with the Smarty template engine to create a simple web page that displays the results. Any other backend that produces the funnel data or frontend that displays the data and gathers user input could be used, below the implementation used for this research is discussed.
Steps
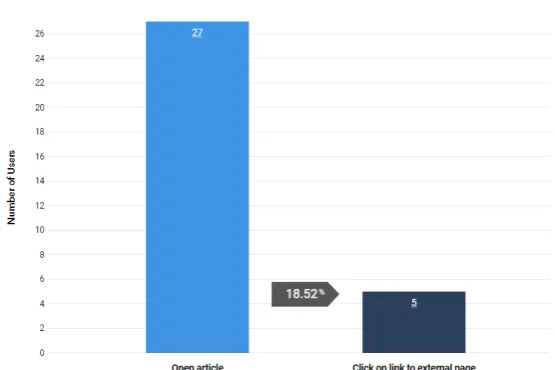
Figure 7 shows the result of a funnel. This steps of this funnel are sending an email, delivering the email, reading the email and finally visiting the website using a link in the email. These steps are displayed in blue on the web page. The funnel starts at the top of the page, and following steps are displayed below. Each step shows how many users made it to the step, and which percentage of users this is compared to the users in the first step. This percentage is important because it is what companies look for. In the example of the image the company is interested in how many people visit their website, while an absolute number shows how many visit the website, the percentage can be used to compare the funnel. For example this can be compared to a previous or future newsletter, another audience or something else.
Continued and Stopped
Figure 7: Results and display of an email delivery funnel
Stop groups
In some cases there is a clear reason for why a user stopped, for example when sending an email there might be feedback about why the email has not been delivered. This could for example be because the email address does not exist, the inbox is full or because it is rejected by a spam filter. If this kind of detailed information is available it can be displayed as a stopping group. Stopping groups are displayed below the ”stopped” statistic, to split the people that stopped into multiple groups. Figure 7 shows these stopping groups between ”emails sent” and ”emails delivered”. This kind of information helps to find out why a user stopped, in this case it is clear that some email never reached the users inbox, and therefore the user did not read it or visit the website.
Filters