1719
Lateral Geniculate Nucleus: Anatomic and Functional
Identification by Use of MR Imaging
Norihiko Fujita, Hisashi Tanaka, Mayako Takanashi, Norio Hirabuki, Kazuo Abe, Hideaki Yoshimura, and Hironobu Nakamura
BACKGROUND AND PURPOSE: MR imaging has the potential capacity for noninvasively
depicting the anatomy and function of thalamic nuclei. The purpose of this study was to identify the lateral geniculate nucleus (LGN), which is the thalamic relay nucleus for vision, with an-atomic and functional MR imaging at 1.5 T.
METHODS: Three-millimeter-thick axial images were obtained from eight volunteers by
using a double-echo turbo spin-echo sequence for proton density– and T2-weighted contrast and a spin-echo 3D gradient-echo sequence for T1-weighted contrast. Each participant under-went a visual activation experiment using gradient-echo echo-planar imaging at the same lo-cation as that of the anatomic study.
RESULTS: In all cases, the LGN was recognized on proton density–weighted images as a
small wedge-shaped area of high signal intensity relative to that of the surrounding white matter tracts. However, it was difficult to identify the LGN on T1- and T2-weighted images because of the smaller contrast-to-noise ratios between the LGN and the adjacent white matter tracts, compared with those of proton density–weighted images (P, .001). Bilateral thalamic activation and activation in the occipital cortex were shown in all participants. Each region of thalamic activation (236 3 mm2) was localized to the anatomically identified LGN.
CONCLUSION: The excellent correspondence between the anatomically and functionally
identified LGN confirms that MR imaging is an indispensable method for visualizing functional neuroanatomy in thalamic nuclei.
The thalamus is a complex cluster of gray matter nuclei located at the junction of the brain stem and cerebral hemispheres. A large number of pathways, including many sensory pathways, relay in more or less separate nuclei in the thalamus. Among these, the visual pathway relays in a distinctive subdivi-sion of the thalamus, the lateral geniculate nucleus (LGN). The LGN is innervated by most of the optic tract axons arising from retinal ganglion cells. In turn, neurons in the LGN give rise to axons that project by way of the optic radiation to the striate cortex in the ipsilateral occipital lobe.
Although the LGN is one of the main compo-nents of the visual pathway, it seems to be the one to which least attention is paid in the radiology literature. This discrepancy is thought to arise
be-Received September 12, 2000; accepted after revision April 30, 2001.
From the Departments of Radiology (N.F., H.T., N.H., H.Y., H.N.) and Neurology (M.T., K.A.), Osaka University Medical School, Osaka, Japan.
Address reprint requests to Norihiko Fujita, MD, Depart-ment of Radiology, Osaka University Medical School, 2-2, Ya-madaoka, Suita, Osaka 565-0871, Japan.
qAmerican Society of Neuroradiology
cause the normal LGN is difficult to identify on MR images. Findings from a previous MR imaging study of brain specimens and healthy subjects (1) have suggested that the LGN is not consistently visible on either T1- or T2-weighted images, even with high spatial resolution. This study showed that proton density–weighted images with high spatial resolution were essential for visualizing a small structure of 4–6-mm diameter (2). However, the use of a conventional spin-echo rather than a turbo spin-echo sequence resulted in prolonged imaging times of .20 min.
The purposes of this study were to determine an optimal pulse sequence for the identification of the normal LGN on anatomic MR images within an acceptable measurement time and to investigate whether the functionally identified LGN with blood oxygenation level–dependent (BOLD) contrast-based functional MR imaging (8–10) correctly cor-responds to the anatomically identified LGN by us-ing a clinical 1.5-T MR imager.
Methods
Eight healthy volunteers (seven male and one female partic-ipant; mean age, 35 years; age range, 25–43 years) participated in this study. Informed consent was obtained from each par-ticipant, as approved by our institutional review board. All imaging was performed by using a 1.5-T Vision MR imager (Siemens, Erlangen, Germany) equipped with echo-planar im-aging capabilities (with a maximum gradient strength of 25 mT/m and peak slew rate of 83 mT/m/ms). The participants were positioned in a standard, circularly polarized head coil by using a foam pad. For each participant, shimming was per-formed over the whole brain with the autoshim feature.
Anatomic Study
We obtained axial proton density– and T2-weighted images parallel to the anterior and posterior commissure lines by using a double-echo turbo spin-echo sequence with the following parameters: 3000/14/85/2 (TR/TE1/TE2/excitations); echo train length, 5 for each echo; matrix, 2503256; field of view, 200 mm; section thickness, 3 mm; 16 multisections with a 1-mm intersection gap. T1-weighted spin-echo images (400/12/3 [TR/TE/excitations]) were obtained at the same location and spatial resolution. Three-dimensional magnetization-prepared rapid gradient-echo images (13.5/7/2; inversion time, 300 ms; matrix, 1923256; field-of-view, 200 mm; 48 sections of 72-mm slab thickness) were also obtained for T1-weighted con-trast at the same location. The 3D magnetization-prepared rap-id gradient-echo images were then resectioned with a 3-mm section thickness and a 1-mm intersection gap for direct com-parison with the other anatomic images. The imaging times for each sequence were almost identical, within the range of 5 min 6 s to 5 min 9 s.
Three neuroradiologists (N.F., H.T., H.Y.) identified the LGN on the anatomic images by consensus. The location of the LGN was determined according to distinct anatomic landmarks sur-rounding the LGN, such as the posterior limb of the internal capsule, the optic radiation, and the lateral recess of the ambient cistern. The observers then investigated proton density–, T1-, and T2-weighted axial images to see whether it was possible to identify the LGN at its expected location as an area of different signal intensity compared with that of the surrounding tissues.
For quantitative evaluation, a single observer (N.F.) measured the signal intensity from the LGN and the surrounding tissues. Regions of interest for the LGN and the surrounding fiber tracts, which are the optic radiation and the posterior limb of the in-ternal capsule, were determined on proton density–weighted im-ages, whereas the region of interest for CSF in the ambient cistern was determined on T2-weighted images. Each region of interest was carefully set to exceed 16 pixels in size and to contain only target tissues. The posterior third quarter of the posterior limb of the internal capsule frequently shows hyper-intense foci on T2-weighted images (Fig 1C); these foci are reported to correspond to fascicles of the corticospinal tract (11). To avoid contamination from these foci, the region-of-interest setting for the posterior limb of the internal capsule was restrict-ed to its posterior fourth quarter immrestrict-ediately anteromrestrict-edial to the LGN. The signal-to-noise ratio of the LGN with each image was calculated as SILGN /N, where SI was the signal intensity,
and N was the SD of the background noise. Contrast-to-noise ratios of the LGN were calculated aszSILGN2SISTz/N, where ST indicates the surrounding tissue.
Functional Study
A functional MR imaging study was performed by using single-shot multisection T2*-weighted echo-planar imaging, with the following parameters for all participants: 2000/70 (TR/TE); flip angle, 908; matrix, 64364; field of view, 200 mm; section thickness, 3 mm. A total of 128 axial image sets were obtained, each consisting of 16 sections with a 1-mm intersection gap that matched the same location and orientation as those of the axial anatomic images obtained parallel to the bicommissure line. Visual stimulation was provided with an in-house binocular light goggle flashing at 8 Hz. The stimu-lation protocol consisted of a 40-s rest period and then a 40-s stimulation period, repeated three times. Each participant was instructed to keep his or her eyes closed during the rest period. Functional MR imaging data were transferred to an off-line Macintosh G3 computer. The data were analyzed by using in-house software developed from National Institutes of Health Image v1.61 (W. Rashband, National Institutes of Health, Be-thesda, MD). Involuntary head movements were estimated by calculating the center of mass of each echo-planar image in a functional series. To obtain data without motion artifacts, any functional series that was associated with head movements of
.0.5 mm in the central 32 3 32 pixels on each image was discarded, and the series was repeated in a new imaging ses-sion. We evaluated head movements in the central area, be-cause the movement estimation over the whole area of 643 64 pixels was considerably affected by signal intensity fluc-tuation in areas with a low signal-to-noise ratio. Cross-corre-lation coefficient images were calculated by comparing the sig-nal intensity with a standard time-shifted (6-s hemodynamic delay) boxcar function (12). Pixels were retained on the func-tional image when the correlation coefficient was.0.3, which corresponded to the probability value P,.001 for false-pos-itive images showing activated pixels. In any case, 2 pixels are expected to be activated by chance over the brain area investigated for statistical analysis (approximately 2000 pixels for each section). To reduce the number of falsely activated pixels, the resulting binary map was filtered by using a 2-or-more pixel cluster filter, in which a cluster was defined as pixels connected by either edges or corners (13, 14). The ef-fective number for chance activation of 2-or-more pixel clus-ters over the investigated brain area was calculated to be,0.05 (14), which was much smaller than the value of 2-pixel acti-vation in the case of a no-cluster filter. Because the volume of the LGN is estimated to be approximately 100 mm3(2), the
assumption of 2 or more voxels of 33333 mm for LGN activation, corresponding to .54 mm3 in volume, is
consid-ered to be justified.
FIG1. Images of participant 3. All images were obtained 4 mm inferior to the bicommissure line.
A, Proton density–weighted image (3000/14/2) shows the LGN (black arrowheads) bordered sharply by the optic radiation (OR) and the posterior limb of the internal capsule (PL). The medial geniculate nucleus can be seen as a small rounded eminence adjacent to the ambient cistern (white arrowheads).
B, Activation map superimposed on the proton density–weighted image shows 3-pixel clustered activation at the anatomically identified location of each LGN.Red pixels represent activation.
C, T2-weighted image (3000/85/2). The LGN is only faintly visible and its borders are difficult to identify. Note the bandlike areas of slightly higher intensity, compared with the surrounding area, in the posterior third quarter of the posterior limb (arrowheads). SC indicates the superior colliculus;HP, hippocampus.
D, T1-weighted magnetization-prepared rapid gradient-echo image (13.5/7/2; inversion time, 300 ms; resectioned). The LGN is only faintly visible, and its borders are difficult to identify.
Results
Anatomic Study
For all participants, the LGN was recognized on axial proton density–weighted images as a small area of high signal intensity relative to that of the surrounding white matter (Figs 1A and 2A). The LGN appeared as a wedge, with the lateral border sharply defined by the optic radiation and the an-teromedial border defined by the posterior limb of the internal capsule. The medial geniculate nucleus, which is the thalamic relay nucleus for the auditory pathway, was frequently identified posteromedial to the LGN (Fig 1A). The posteromedial border of the LGN was indistinct because it blended with the me-dial geniculate nucleus and the lateral wing of the ambient cistern, which were of almost the same signal intensity as that of the LGN on proton den-sity–weighted images. There was no disagreement in the opinions of the three observers regarding the
LGN identification on axial proton density–weight-ed images because of its characteristic location and shape.
FIG2. Images of participant 7.
A, Proton density–weighted axial image (3000/14/2) obtained 4 mm inferior to the bicommissure line through the LGN (arrowheads). SC indicates the superior colliculus.
B, Proton density–weighted coronal image (3000/14/2), obtained through the LGN (arrowheads), corresponds to the horizontal black line in D. HP indicates the hippocampus.
C, Proton density–weighted left parasagittal image (3000/14/2) obtained through the LGN (black arrowhead) corresponds to the vertical black line in D. The white arrowhead indicates the anterior commissure. Pu indicates the putamen; Pul, pulvinar.
D, Axial activation map superimposed on a proton density–weighted image shows LGN activation of 2 and 3 pixels on the right and left sides, respectively.
E, Coronal image with superimposed activated pixels shown in D.
F, Activated pixels of the left LGN are projected and superimposed on the left parasagittal image.
FIG3. Images of participant 4.
A, Activation map superimposed on proton density–weighted image (3000/14/2) obtained through the bicommissure line. Of the eight participants, only this participant had LGN activation (arrowheads) shown on two sections (one activated pixel on each).
TABLE 1: Quantitative evaluation of the SNR and CNR of the LGN (n516)
Image SNR LGN vs OR
LGN vs
PLIC LGN vs CSF PD-weighted
T2-weighted T1-weighted MP-RAGE
66.563.0* 32.261.1 35.161.4 31.261.8
9.361.7* 4.660.6 1.460.7 2.860.4
6.560.7* 1.660.6 1.460.6 2.960.7
0.161.2† 41.163.8 20.061.6 22.661.6 Note:—All data are the mean61 SD. CNR indicates contrast-to-noise ratio; MP-RAGE, magnetization-prepared rapid gradient echo; OR, optic radiation; PD, proton density; PLIC, posterior limb of the internal capsule; SNR, signal-to-noise ratio.
* SNR, CNR to the optic radiation, and CNR to the PLIC on PD-weighted turbo spin-echo images were significantly greater than those on all other images (P,.001; one-tailed paired t test).
† CNR-to-CSF ratio on PD-weighted turbo spin-echo image was sig-nificantly smaller than that on all other images (P,.001).
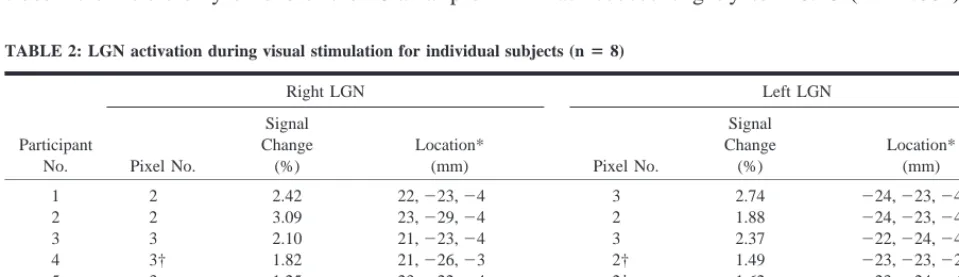
TABLE 2: LGN activation during visual stimulation for individual subjects (n58)
Participant No. Right LGN Pixel No. Signal Change (%) Location* (mm) Left LGN Pixel No. Signal Change (%) Location* (mm) 1 2 3 4 5 6 7 8 2 2 3 3† 3 2 2 3 2.42 3.09 2.10 1.82 1.25 2.07 1.90 2.46
22,223,24 23,229,24 21,223,24 21,226,23 23,222,24 24,223,28 24,222,24 22,223,24
3 2 3 2† 2‡ 2 3 2‡ 2.74 1.88 2.37 1.49 1.62 3.05 1.73 1.64
224,223,24
224,223,24
222,224,24
223,223,22
223,224,24
223,223,24
223,223,24
223,224,24 * Data are x, y, z coordinates.
† See Figure 3.
‡ For the statistical threshold with the cross-correlation coefficient.0.3, only one activated pixel could be identified at the anatomic location of the LGN. Therefore, these activated pixel numbers were obtained on the condition that the statistical threshold was slightly reduced to.0.28.
and resectioned T1-weighted magnetization-pre-pared rapid gradient-echo images were significantly smaller than those on proton density–weighted im-ages (P , .001). As expected, the mean LGN-to-CSF contrast-to-noise ratio from those images was significantly greater than that obtained from proton density–weighted images (P ,.001).
Figure 2 shows axial, coronal, and sagittal proton density–weighted images through the LGN, as well as the activation maps overlaid on each proton den-sity–weighted image. The LGN was visible as a small triangular area on these images at the ex-pected position: anterolateral and ventral to the pul-vinar, medial to the optic radiation, and supero-medial to the hippocampus. The supero-medial margin of the LGN was indistinct on the coronal view (Fig 2B) because the rest of the thalamus, which might include the medial geniculate nucleus, had almost the same signal intensity as that of the surrounding tissue. The posterior margin of the LGN was un-clear (Fig 2C) because the LGN appeared contig-uous to the pulvinar.
In six of the eight participants, the LGN on both sides were visible only on one of the 16 axial
pro-ton density–weighted images of 3-mm thickness. This location corresponded to the section 4 mm inferior to the bicommissure line (24-mm section), at the level of the superior colliculi. In the remain-ing two participants (Table 2, participants 4 and 6), the LGN on one side was visible only on the 2 4-mm section. However, for participant 4, the LGN on the other side was identified in the section ob-tained through the bicommissure line (0-mm sec-tion) and in the24-mm section (Fig 3); for partic-ipant 6, the LGN was seen only in the 28-mm section.
Functional Study
In all participants, activation of the calcarine cor-tex and activation in the associated visual areas of the occipital lobe were observed. As for the thal-amus, no activation was detected in areas other than the LGN. Table 2 summarizes the number of pixels, the percentage BOLD signal change, and the center-of-mass location of LGN activation for each participant. LGN activation was successfully detected at the expected location in 13 of 16 LGNs under postprocessing conditions of a correlation co-efficient .0.3 and a 2-or-more pixel cluster size. For these cases, the correspondence of the func-tionally identified LGN with the anatomically iden-tified LGN on proton density–weighted images was excellent (Figs 1 and 2).
[image:5.612.50.530.562.700.2]activation of the 2-pixel cluster was detected at a location corresponding to the anatomically identi-fied LGN. For one participant (participant 4), the left LGN seemed to be located between the 0-mm section and the 24-mm section, as stated previ-ously. On the activation map for this participant obtained before the application of the cluster filter, we detected 2-pixel cluster activation in the right LGN on the 24-mm section but only 1 pixel ac-tivation in the left (Fig 3). On the 0-mm section, we found on each side 1 activated pixel, which was spatially contiguous to the activated pixels of the LGN on the24-mm section. For participant 4, the numbers of pixels in each area of LGN activation were calculated as a summation of the activated pixels on these sections. Because of the possibility that spatially contiguous activated pixels of the LGN were present in different sections, we re-viewed the activation map before the application of the cluster filter for all individual participants. However, except for participant 4, no other cases were found. Finally, we evaluated the possible BOLD effects from the draining veins (15, 16); however, the pixels showing LGN activation did not contain any pixel corresponding to a large vein, in particular the basal vein of Rosenthal running through the ambient cistern adjacent to the LGN.
The slightly modified postprocessing procedures for the above three LGN allowed us to detect bi-lateral LGN activation of 2–3 pixels for all partic-ipants, as summarized in Table 2. For all 16 LGNs, the mean number of activated pixels was 2.460.3 pixels, and the mean BOLD signal change was 2.2
6 0.3%. No statistically significant difference be-tween right and left LGN activation existed. The point-to-point comparison of CSF spaces around the posterior region of the thalamus between the T2*-weighted functional images obtained with a 64
364 matrix and the T2-weighted anatomic images obtained with a 2563256 matrix revealed that the mean image mismatch was only 0.6 pixels (0.47 mm); this value seems to lie within the measure-ment error of the different matrix sizes. For all 16 LGNs, the coordinates of the position (in mm) of the mean center of mass of LGN activation area were x 522.86 0.5, y5 623.6 60.9, and z5
64.1 6 0.6, where the x coordinate (left-to-right direction) is represented as an absolute value. No statistically significant difference between the co-ordinates of the right and left LGN activation was found.
Discussion
The LGN serves as a relay station in the projec-tion of the visual pathway to the striate cortex. The microscopic structure of the LGN is characterized by a series of alternating gray matter and white matter layers. The primate LGN is a six-layered structure, with two subdivisions of four dorsal par-vocellular layers and two ventral magnocellular layers. Functionally, these two subdivisions are
as-sociated with different aspects of vision. The for-mer is involved mainly in the perception of form and color, and the latter, in the perception of move-ment and depth (17). With neuroophthalmologic tests, LGN lesions may be distinguished clinically from optic tract lesions according to the preserva-tion of the pupillary response, which indicates that a small number of optic tract axons to the midbrain are intact. LGN lesions may cause a characteristic sector or wedge-shaped pattern of homonymous vi-sual defect (18, 19). However, a completely hom-onymous visual defect can occur elsewhere in the retrochiasmatic pathway, and precise localization of retrochiasmatic lesions is therefore often difficult without the aid of neuroimaging techniques.
Although investigators have described patholog-ic conditions of the LGN in reports of recent MR imaging studies (19–23), they have been mostly discussed as a subsidiary issue in relation to optic tract lesions, such as wallerian degeneration and periventricular leukomalacia. To our knowledge, only one report concerning MR imaging of the nor-mal LGN exists in the radiology literature. Horton et al (1) reported the superior quality of proton den-sity–weighted images for the depiction of the LGN. Their study was performed before the advent of fast spin-echo techniques; a conventional spin-echo sequence was used, and two-to-four signal aver-aging was required to obtain adequate image qual-ity. This technique resulted in long imaging times of 10 min. As per current routine clinical practice, we used a turbo spin-echo sequence for proton dsity– and T2-weighted contrast; this sequence en-abled us to obtain images of almost the same qual-ity, with an acceptable imaging time.
although it may be effective in older participants with larger CSF spaces.
Horton et al (1) noted that optimal plane settings are essential for imaging the LGN. In their study, the optimal imaging plane for axial orientation was determined to be parallel to the line through the genu of the corpus callosum and the superior col-liculi, on the basis of imaging study findings in isolated brain specimens. However, it seemed that this plane could not be accurately reproduced in a clinical setting because of the relatively large size of the landmarks. Furthermore, it is well known that an isolated brain, unsupported by the surround-ing CSF and mensurround-inges, becomes seriously distort-ed, primarily because of the influence of gravity.
In standard textbooks of anatomy of the human brain, the LGN can be seen in axial orientation in a section through the superior colliculi (24, 25). Because of the proximity of the LGN to the supe-rior colliculi, the LGN is expected to be visible on an axial section obtained through the superior col-liculi, either parallel to the bicommissure line or slightly inclined relative to this line, as noted by Horton et al (1). In our study, we used the standard axial imaging plane parallel to the bicommissure line, and 14 of the 16 LGNs were localized on only the24-mm section at the level of the superior col-liculi. The remaining two LGNs were seen on the adjacent superior and inferior sections; this result may have been caused by the difficulty of setting symmetric imaging planes because of individual anatomic variability, as shown in Figure 3.
In this study, all LGN activation detected with functional MR visual stimulation was correctly su-perimposed on the LGN that was anatomically identified on proton density–weighted images. This finding suggests that the correspondence between the localization of the functionally and anatomical-ly identified LGN is excellent, despite possible in-dividual anatomic variability. The mean x, y, and z coordinates of the center of mass of LGN acti-vation were within the extent of the LGN depicted in a standard neuroanatomy atlas that showed the detailed structures of the thalamus of an isolated brain specimen (26). The mean number of activated pixels of 2.4 corresponds to an area of 23 mm2, which is compatible with a human LGN diameter of 4 to 6 mm (2). This value is within the range of 4-T functional MR imaging results that indicate an area of 21 mm2, with a higher in-plane resolution and the same section thickness (6), as well as an area of 38 mm2 with lower effective in-plane res-olution and a thicker section (4). In our study, the mean BOLD signal change of 2.2%, with a TE of 70 ms at 1.5 T, was similar to that obtained with a TE of 25 ms at 4 T (6), despite the difference of the static magnetic field strength. This finding may be explained by the similar T2* sensitivities, cor-responding to the static magnetic field strength multiplied by the TE, in addition to the similar siz-es of LGN activation, although the increase in the signal-to-noise ratio and BOLD contrast-to-noise
ratios at higher field strengths may be beneficial (27).
Our anatomic-functional MR imaging results did not show any activation in the thalamus other than the LGN, as noted in similar studies of the human brain at 2 T (5) and the monkey brain at 4.7 T (7). However, a functional MR imaging study at 4 T in humans (4) revealed simultaneous activation of the pulvinar with the LGN during visual stimulation. The role of the pulvinar is largely unknown, al-though its major inputs come from parts of the vi-sual system, and some evidence suggests that it is involved in visual perception or attention (28, 29). Because the pulvinar is close to the LGN, as shown in Figure 2C, we think that further anatomic-func-tional correlation with more complicated visual testing is required to explain this discrepancy.
In any functional MR imaging experiment, the locations of activation must first be verified on an-atomic images. T1-weighted anan-atomic images are conventionally used for this purpose, and the acti-vation maps are superimposed on them, because T1-weighted images provide adequate delineation of cortical anatomy and they are readily obtained at sufficient spatial resolution. As illustrated in our study of the anatomic delineation of the LGN, most T1- and T2-weighted images provide little distinc-tion between individual thalamic structures, be-cause the thalamus has a large amount of white matter interspersed between and within the various gray matter nuclei. Hence, on MR images, the thal-amus generally has an appearance between that of gray matter and white matter (30). The superior quality of proton density–weighted images has been shown for the visualization of other thalamic structures, such as the mamillothalamic tract (30, 31), as well as for the visualization of the LGN. Therefore, if the main objective concerns the de-tails of activation in parts of the thalamus, proton density–weighted images may be recommended as the most suitable anatomic images on which the locations of functional MR activation should be superimposed.
Conclusion
References
1. Horton JC, Landau K, Maeder P, Hoyt WF. Magnetic resonance
imaging of the human lateral geniculate body. Arch Neurol
1990;47:1201–1206
2. Andrews TJ, Halpern SD, Purves D. Correlated size variations
in human visual cortex, lateral geniculate nucleus, and optic tract. J Neurosci 1997;17:2859–2868
3. Kleinschmidt A, Merboldt KD, Haenicke W, Steinmetz H, Frahm J. Correlational imaging of thalamocortical coupling in the
primary visual pathway of the human brain. J Cereb Blood Flow Metab 1994;14:952–957
4. Chen W, Kato T, Zhu XH, Strupp J, Ogawa S, Ugurbil K.
Map-ping of lateral geniculate nucleus activation during visual stim-ulation in human brain using fMRI. Magn Reson Med 1998;39:
89–96
5. Buechel C, Turner R, Friston K. Lateral geniculate activations
can be detected using intersubject averaging and fMRI. Magn Reson Med 1997;38:691–694
6. Chen W, Zhu XH, Thulborn KR, Ugurbil K. Retinotopic
map-ping of lateral geniculate nucleus in humans using functional magnetic resonance imaging. Proc Natl Acad Sci U S A 1999;
96:2430–2434
7. Logothetis NK, Guggenberger H, Peled S, Pauls J. Functional
imaging of the monkey brain. Nature Neurosci 1999;2:555–562
8. Ogawa S, Lee TM, Kay AR, Tank DW. Brain magnetic
reso-nance imaging with contrast dependent on blood oxygenation. Proc Natl Acad Sci U S A 1990;87:9868–9872
9. Kwong KK, Belliveau JW, Chesler DA, et al. Dynamic magnetic
resonance imaging of human brain activity during primary visual sensory stimulation. Proc Natl Acad Sci U S A 1992;89:
5675–5679
10. Ogawa S, Tank DW, Menon R, et al. Intrinsic signal changes
accompanying sensory stimulation: functional brain mapping with magnetic resonance imaging. Proc Natl Acad Sci U S A
1992;89:5951–5955
11. Yagishita A, Nakano I, Oda M, Hirano A. Location of the
cor-ticospinal tract in the internal capsule at MR imaging. Radi-ology 1994;191:455–460
12. Bandettini PA, Jesmanowicz A, Wong EC, Hyde JC. Processing
strategies for time course data sets in functional MRI of the human brain. Magn Reson Med 1993;30:161–173
13. Forman SD, Cohen JD, Fitzgerald M, Eddy WF, Mintun MA, Noll DC. Improved assessment of significant activation in
function-al magnetic resonance imaging: use of a cluster-size threshold. Magn Reson Med 1995;33:636–647
14. Xiong J, Gao JH, Lancaster JL, Fox PT. Clustered pixel analysis
for functional MRI activation studies of the human brain. Hum Brain Mapp 1995;3:287–230
15. Lai S, Hopkins AL, Haacke EM, et al. Identification of vascular
structures as a major source of signal contrast in high
reso-lution 2D and 3D functional activation imaging of the motor cortex at 1.5-T: preliminary results. Magn Reson Med 1993;30:
387–392
16. Frahm J, Merboldt KD, Hanicke W, Kleinschmidt A, Boecker H.
Brain or vein: oxygenation or flow? on signal physiology in functional MRI of human brain activation. NMR Biomed 1994;
7:45–53
17. Livingstone M, Hubel D. Segregation of form, color, movement,
and depth: anatomy, physiology, and perception. Science 1988;
240:740–749
18. Shacklett DE, O’Connor PS, Dorwart RH, Linn D, Carter JE.
Congruous and incongruous sectoral visual field defects with lesions of the lateral geniculate nucleus. Am J Ophthalmol 1984;
98:283–290
19. Greenfield DS, Siatkowski RM, Schatz NJ, Glaser JS. Bilateral
lateral geniculitis associated with severe diarrhea. Am J Ophthalmol 1996;122:280–281
20. Savoiardo M, Pareyson D, Grisoli M, Forester M, D’Incerti L, Fariana L. The effects of wallerian degeneration of the optic
radiation demonstrated by MRI. Neuroradiology 1992;34:
323–325
21. Lexa FJ, Grossman RI, Rosenquist AC. MR of wallerian
degen-eration in the feline visual system: characterization by mag-netization transfer rate with histopathologic correlation. AJNR Am J Neuroradiol 1994;15:201–212
22. Uggetti C, Egitto MG, Fazzi E, et al. Cerebral visual impairment
in periventricular leukomalacia: MR correlation. AJNR Am J Neuroradiol 1996;17:979–985
23. Kitajima M, Korogi Y, Takahashi M, Eto K. MR signal intensity
of the optic radiation. AJNR Am J Neuroradiol 1996;17:
1379–1383
24. Parent A. Carpenter’s Human Neuroanatomy 9th ed. Philadel-phia, Pa: Williams & Wilkins; 1996;549, 636
25. Daniels DL, Haughton VM, Naidich TP. Cranial and Spinal
Mag-netic Resonance Imaging: An Atlas and Guide. New York, NY:
Raven; 1987;74
26. Mai JK, Assheuer J, Paxinos G. Atlas of the Human Brain. San Diego, Ca: Academic Press; 1995;206–219
27. Gati JS, Menon RS, Ugurbil K, Rutt BK. Experimental
deter-mination of the BOLD field strength dependence in vessels and tissue. Magn Reson Med 1997;38:296–302
28. Nolte J. The Human Brain: An Introduction to its Functional
Anatomy 4th ed. St Louis, Mo: Mosby; 1999;388–389
29. Robinson DL, Petersen SE. The pulvinar and visual salience.
Trends Neurosci 1992;15:127–132
30. Brown WD. Brain: supratentorial central nuclei and tracts.
Neuroimaging Clin N Am 1998;8:37–54
31. Yamada K, Shrier DA, Rubio A, et al. MR imaging of the