A COMPARISON OF THE PRINCIPAL ECONOMIC FEATURES OF EIRE AND DENMARK
By J. P. BEDDY, M.COMM., D.ECON.SC.
(Bead on Thursday, 25th November, 1943 )
Introductory.
Denmark is not only a smaller country than Eire but her climate is-less equable, her soils are, in general, lighter and poorer, she has no coal and no water power to compensate for its ahsence, nor has she any iron ore or other metallic ores to ser^e as a basis for industrial activities Yet, m comparison with Eire, she has a bigger population, a greater agricultural output, a more extensive industrial system, a larger foreign trade, a lower national debt, a higher national income and a better standard of living. It is the purpose of this paper to tlnow some ligl \ on this unusual economic paradox.
Like Eire, Denmark may be legarded as in ular since the counti} consists of a number of islands and the peninsula of Jutland which at its southern border is connected with the European Continent by an isthmus of only 30 miles m width The total aiea is 16,575 square miles which is 62-3 per cent, of that of Eire (26,601 square miles) , alternatively, Eire is 60 5 per cent larger than Denmark Jutland occupies almost the same percentage of the total area as is occupied m Ene by Munstev Connacht and Ulster (part), and the Danish islands and Lemstei covet' approximately the same percentage of total area m their respective countries Unlike Eire, Denmark has no mountainous regions and it a flat and, in parts, a gently undulating country, the highest point of which is only 564 feet above sea level This, and the fact that no part of 'Denmark is more than 30 miles from the sea, constitute natural limitations to the size and power of rivers and account for the absence of any important streams and hence of water power
190 A Comparison of the Principal Economic Features of Eire
and Denmark
CLIMATIC CHART
IRELAND , DENMARK
°F
G5
CD
SS
SO
4 5
4O
3 5
HRS
2OO
ISO
IOO
SO
INS
S
4
3
2
1
JAN FEB MAR APL MAY JUNE JULY AUG
-—
1 ! I 1 1
MEAN TEMPERATURE
(AV 4OVRS>>
•
/ MEAN ANN
y
HOURS OF SUNSHINE
(NORMAL) / "
S ' ' '
/ ^ • ' TOTAL ANN
RAINFALL
(AV 4OYRS DENMARK, 35 YR5 IRELAND)
"* "•"'""" ' TOTAL ANN
1 1 1 1 1
1 !
IRELAND DENMARK
N S
\ \
\ \
IRELAND DENMARK
' '
IRELAND DENMARK
1 { SEPT
\
49 S ° F 45 4 ° F
I39O (366
N
43 3 34-65
| OCT
I
\
i
NOV DEC 1
-\ V 1
\\
\
s. — FREEZING
POINT
_
•
-y
AV MONTHLY
-AV MONTHLY
-1 I 65
GO
55
£ O
Ah
4 O
3 5
HRS
2OO
3 SO
IOO
SO
fN5
5
4
3
1
By J. P Beddy, M Comm , D Econ Sc 191
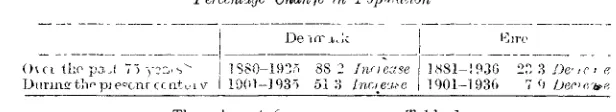
Climate.
As regards climate, Denmark is a country of much wind and, being flat, is unsheltered. It is this exposure to strong and continuous winds which in central and western Jutland makes for stunted tree growth and* lower soil temperatures so unfavourable to tillage operations. The prevailing winds and those of fiire are rather alike since their frequency is fairly evenly distributed over all directions between S. and N.W., but Denmark is liable to many shifts of wind and her proximity to the Continent exposes her to the severe outblowing easterly winds of that region. This and the fact that she is in approximately the same latitudes as Scotland explain why her winters are so much colder than those of Eire. That her summers are somewhat warmer than in Eire is due to her lower rainfall and her greater distance from moderating oceanic influences.
From the diagram (above) which shows average temperatures in Denmark and Ireland (there being no records for Eire for a sufficiently lengthy period) it can be seen that in only three months in the year (June to August) does the Danish temperature exceed that of Ireland, and that for the remaining nine months it is not only lower but in December-March is distinctly lower and is around freezing point m two of these months. It is characteristic of the Danish winter that there is much oscillation between a little freezing and a little thawing—a condition which imposes maximum strain on plant life. Temperatures below freezing point are usual during the three winter months, especially in the east—the Sound which separates Zealand from Sweden freezes on an average every second year for a mean duration of 47 days.
The diagram also deals with sunshine and rainfall. Though there is little difference betwseen Denmark and Ireland in total sunshine hours
(only 2 hours per month), the distribution is such that Ireland has more sunshine than Denmark from October to March, but has less in the important six months from April to September during .which Denmark's advantage becomes more marked in June and July for whicli months there is a total of 100 hours more sunshine than in Ireland These are two of the three months in which Danish temperature exceeds that of Ireland. As for rainfall, Ireland has the advantage of an average of over 3J inches per month which is 76 per cent, greater than the Danish figure of just over 2 inches. At all times of the year Denmark has a lighter rainfall but it is distributed rather more evenly than that of Ireland since it does not deviate so much from the monthly average
Population.
192 .4 Comparison of the Principal Economic Features of Eire
and Denmark
Peicertfage Change <n Population
D e ~i(
ilio -p3,J 7") y?:> 1880-1935 88 2 Inn ease ] 8 8 1 - ! 9 3 0 23 3 De>,c> e D u n n s t V p j e ^ c n r cc ntuiv 11901-1935 51 o Inae^e | 1901—193f) 7 (l Dec>cu+fi
Thr relevant figures appear m Table 1
The changes m population are reflected in the figures for Births Deaths and Marriages appearing m Table II From 1871 onwaids t\i-birth rates of both countries have fallen throughout but the Danish decline has been at a more rapid rate than ours, and hence their birth rate which exceeded ours by 5 2 per 1000 of population m 1871 /P0^ is now m excess by onty 1 2 per 1000 of population Offsetting to a substantial extent the fall m birth rates is a decline m the Danish deacli rates which is much more marked than the decline in our death rates While the Danish birth late fell between 1871 and 1930 by 10 6 per 1000 of population, the death rate also fell by 8-2 per 1000 of population and was thas responsible for limiting the reduction m. natural increase to only 2 4 per 1000 of population In the same period our natural increase fell by almost the same figure (2-5) but has in all years been substantially lower than that of Denmark (usually less than half) Since emigration is an additional factor affecting population changes. Table III shows the figmes for both countries since 1871 as evidence
of the much heavier dram of emigration on our population ^
[image:4.367.39.347.49.105.2]As for the marriage rates in Table II, ours, being among the lowest in the world, naturally contrast unfavourably with^those of Denmark. These rates are reflected in the following figures as well as m those oi' Table IV which present a still more jdeplorable position especially m regard to persons between 20 and 40 years of age —
' of Population ( lfales and Females) uzzorcVi>iq to Cjn)W;al
Eire (1936)
Denmark (1935) 27 542 0
d Widowed 3 9 3 5
Single 68-6 54 5
Total 100 100
FKMALES
Man led Widowed 29 3
40 8
8 8 7 1
Single
01 9
Tot
100
In the consideration of this mattei it must be borne m mmd that in comparison with Denmark not only have we a far greater proportion of unmarried persons in the various age groups but m the age groups 25-34 and 35-44 we have smaller proportions of our total population. Relatively, therefore, we have fewer marriages and fewer marriageable people Table V bears on this pom I
Of particular interest is the distribution of population between tc * n and count1'v areas The figures at the latest Census dates are contrast vd
By J. P Beddy, M.Comm , D Econ Sc 193
a greater number ¥of them and the table bears out this—there are, for
example, apart from the capital, eleven cities or towns of over 20,000 inhabitants, whereas there are only three in Eire. The changes in urban and rural populations have followed such different courses in the two countries over the past 65 years that the following comparison is of interest.—
Year
Denmark
1870 1901 1930 1935
Eire
1871 1901 1926 1936
Population (thousands) Uiban
Denmark
443 1,074 2,093 2,299
Eire
934 911 959 1,055
Rural Denmark
1,341 1,376 1,458 1,407
fiire
3,119 2,311 2,013 1,914
Percentage of total population Urban
Denmark /o 24 8 43 8 58 9 62 0
Eire 0/
/o 23 0 28 3 32 3 35 5
Rural Denmark
0/ /o 75 2 56 2 41 1 38 0
Eire 0/
/o 77 0 71 7 67 7 64 5
(Denmark includes S Jutland in 1930 and 1935 The " urban " populations for Eire represent the populations within the 1936 boundaries of cities and towns with populations of 1,500 or over m 1936 The Danish and Irish definitions of " urban " and " rural " a,re not strictly comparable such differences as there are would scarcely upset the general picture)
The figures show that the Danish urban population has increased greatly both absolutely (over 5 times) and relatively, while the rural population has increased slightly (by 5 per cent, since 1870) though it has decreased relatively. In Eire, the urban population has also increased absolutely and relatively but the absolute increase is only 12\ per cent, and is trifling in comparison with Denmark. Our rural population has declined greatly both absolutely (by 39 per cent) and relatively (by 12| per cent.) and our loss of 1 | millions rural population is only slightly reduced by the increase of 121,000 in urban population. Our rural areas have borne the whole weight of the decline in our population since 1871, while in Denmark the rural areas.shared to a slight extent in the increase in population. In 1870 Denmark's rural population was less than half of ours ; in 1935, mainly because of shrinkage in our figures, Denmark's ratio had increased to over 70 per cent. Her urban population in 1870 was just over 47 per cent, of ours , in 1935, because of industrial develop-ment, it was more than twice as great as ours.
As to the economic activities of the respective populations, Table VII shows that while approximately one half of our working population is engaged in agriculture and rather more than a further one quarter are occupied in industrial and commercial pursuits, only a little over one-third of Danish workers are agriculturists and a further 40 per cent, are engaged in industry and commerce. One is aware of the hazards of international comparison (even in the very general manner of Table VII) of statistics of persons in occupational or industrial groups. The classification used for Eire is on the " industrial " basis, i.e. transport workers, clerks, etc., are attributed to this industrial or commercial group.
194 A Comparison of the Principal Economic Features of Eire
and Denmark
Farmers
Farmers' children and lelatives Other Agricultural workeis . .
TOTAL
Percentage of Occupied Agricultural Population
Denmark (1923)
35 1 20 0 44 9 100
Eire (1936)
40 2 37 9 21 9 100
The percentages indicate the greater extent to which non-family labour is utilised on Danish farms as compared with ours. There is a further difference in the fact that, in Denmark, 40 per cent, of the occupied agricultural population are agricultural labourers who are " living in," whereas the figure for Eire is only just over 5 per cent. The farm workers of the two countries live entirely differently. In Denmark, there is no significant number of farm workers who, like the majority of such workers in Eire, spend most of their lives as agricultural labourers living away from the farms on which they work and supporting themselves and their dependents on the wages they earn. Hence agricultural labourers as a class scarcely exist in Denmark. A considerable proportion of non-family farm workers are the sons and daughters of neighbouring farmers whose object in accepting employment is to gain wider experience, but irrespective of this, many farm workers share the same table as their employer and are neither regarded nor regard themselves as in any way socially inferior. In general they have the outlook of farmers rather than of employees.
As to density of agricultural population, though Denmark has a smaller rural population than Eire its density is greater in relation to the area of cultivated land. The following is a comparison based on such' statistical material as is available :—
Occupied agricultural population Cultivated area (thousands) . . No per 1,000 Cultivated acres Of which —
Farmers . . Farmers' children and relatives Other agricultural workers .
DENMARK
545,491 (1930) 7,728 acres (1933)
70 6
2 4 |
14
3 1 | .
E I R E
643,965 (1936) 11,607 acres (1936)
55 5
22£
21
12
As compared with ]§ire, Denmark has, therefore, 15 more persons per thousand cultivated acres, or one additional worker on each 67 acres. Had we a similar density our occupied agricultural population would be 174,000 (or 27 per cent.) more than in 1936, and our rural population, i.e. working agriculturists and their dependents, would number about 350,000 mo e.
Agriculture.
By J. P. Beddy, M.Comm., D.Econ.Sc. 195
farmers utilize their land. That this differs considerably from that of Eire is evident from the following :—
Percentages of Total Area.
Agricultural land
Tilled (excl. Fallow) Permanent Grass . . Non-agricultural land
DENMARK (1929)
61 01
V 74. 1
r ' * l
13 1J 25 9 100 0 '
E I R E
22-01 46-9 J
(1931)
68*9
31 1 100-0
(The tillage figures include Hay —Denmark (est.) 8% , £ i r e 13-6%.)
There have been important changes in these ratios over the past 70 years. Between 1871 and 1931 the proportion of agricultural to non-agricultural land in Eire declined by 7 | per cent., while that of Denmark increased by about 13^ per cent, between 1870 and 1929. To a sub-stantial extent the Danish improvement is attributable to the reclamation of great areas of Jutland heaths which was mainly achieved by private enterprise and brought about a 100 per cent, increase^ in the population of that area between 1860 and 1925. Apart from these altered ratios, the manner of utilisation of agricultural land underwent important changes which assumed a different character m each country. Table VIII and the following diagram shows that in Denmark there was but a slight reduction between '1871 and recent years in the substantial proportion of cultivated land used for cereals, a relatively large reduction in the proportion of hay and pasture areas and a very big increase in the proportion applicable to root crops and other corps. In Eire, the small proportion of cereal areas declined to a still lower figure, the hay and pasture proportion increased relatively largely and the proportion for root crops and other crops so declined that, while it was over 3J times that of Denmark in 1871, it was less than one-third of the Danish 1933 proportion.
1871
1901
1911 1933
1*71 g I9OI |£
19(2 >
1933 H
196 A Comparison of the Principal Economic Fealui es of Eire
and Denmark *
These changes reflect the > different agricultural policies of the two countries. Up to almost 1880, Denmark was a cereal-exporting country, but altered the entire character of her agricultural system when, for reasons which have now passed into economic history, cereals declined in value relatively to dairy produce and meat. The following is an indication of the magnitude of this decline :— •
1871-5 1891-5
Value of 1 kg of Butter expressed as kg of
W H E A T
8 5 16 5" •
BARLEY
13 6 20 2
Value of 1 kg of Bacon expressed as 1 kg of
W H E A T
5 8 4
BARLEY
8 10 3
Even if these differences in values were not so marked, Denmark had little choice but to follow the agricultural policy she adopted. Apart from the competition in cereals by the newly-developed countries of the Western Hemisphere, her soil was too poor for a continuance of the same type of cereal cropping and her rainfall and general climatic conditions did not point the way to grazing. Hence her development has been on the lines of animal husbandry based upon tillage. She has therefore specialised in Dairy Produce, Bacon and Eggs in which she is among the world's leading producers and exporters. Her policy involves the growing of large quantities of cereals and forage crops for ammal fodder which is supplemented by imported feeding-stuffs of high protein content. So great is the need for arable land that there is comparatively little permanent pasture ; in fact, m- only one small area of poor reclaimed fenland, is agriculture conducted on the basis of what an American writer describes as " opening and shutting gates." Climatic conditions are such that animals must be housed for a comparatively large part of the year and hence extensive farm buildings are required not only for this purpose but for the storage of fodder. This constant care of livestock is associated with that regular, as opposed to seasonal, production of livestock products which is so important a feature of marketing. These facts explain why Denmark continued to grow cereals not for export as human food but of the type more suited to her soil and climate and intended for animal fodder. They also explain the great expansion in the area under root and other crops and the reduction in the hay and pasture areas.
By J P Beddy, M Comm , D Econ Sc 197
not the advantage of regularity. There resulted less employment, less activity on the land, fewer farm buildings and less farming capital. From the strict economic standpoint it no doubt represented our natural contribution to the international division of labour in a world of Free Trade ; from the social standpoint, however, its effects have been in may respects deplorable.
[image:9.367.29.327.373.484.2]As to the relative sizes of farms m both countries, Table IX compares the percentage distribution of farms of different sizes according to numbers and areas. Because of a different method of classification by size in Denmark, direct comparisons are not possible, but when estimated adjustments have been made it would appear that there is little difference between the two countries in regard to the percentages of total cultivated area which are applicable to farms of similar size. An exception is in the 15-30 acre group which accounts for a somewhat larger area m Eire than in Denmark. As regards numbers of farms as distinct from their areas, it would seem that we have rather more of the 1-15 acie and ,15-30 acre types and rather fewer of the 50-100 acre and over 100 acre tvpes
Table X shows in greater detail the manner in which cultivated areas were utilised m both countries in 1933 (the choice of the year being determined here, as elsewhere, by the availability of comparable statistics). The figures are so eloquent in themselves that it is only necessary to remark that in the Tillage section fiire's figures exceed those of Denmark in only two items—Potatoes and Turnips—but our excess is trifling in comparison with the enormous lead of Denmark in other items Table XI carries the analysis further, i.e., by reference to farms of various sizes and shows in general that the differences in the agricultural methods of the* two countries are common to all sizes of farms.
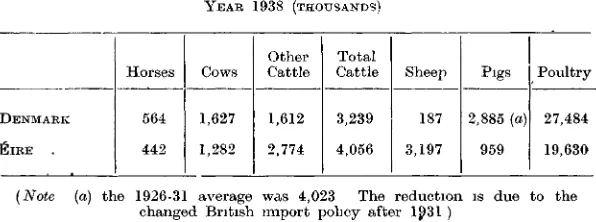
The agricultural policies of both countries had important effects on the livestock position, which in 1938 was as follows :—
YEAR 1938 (THOUSANDS)
DENMARK
^ I R E .
Horses
564 442
Cows
1,627 1,282
Other Cattle
1,612 2,774
Total Cattle
3,239 4,056
Sheep
187 3,197
Pigs
2,885 (a) 959
Poultry
27,484 19,630
(Note (a) the 1926-31 average was 4,023 The reduction is due to the changed British import policy after 1J)31 )
198 A Comparison of the Principal Economic Features of Eire
and Denmark
A mere comparison of the respective numbers of livestock fails to
bring out clearly the extent of the gap between the two countries in this respect, and hence the following is of interest since it compares the relative densities per 1,000 acres of crops and pasture .—
D E N M A B K
liliRE
Horses
72 38
Y E A R 1938
Cows
204 110
Total Cattle
* 405 348
Sheep
24 275
Pigs
361 82
poultry
3,497 1,687
Except for sheep, which do not fit into the Danish system of agriculture, the figures for Denmark greatly exceed ours in all categories. Had we similar densities, we would have 1*1 mill, more milch cows, our total cattle would be increased by 660,000, and our numbers of pigs would be greater by over 3J million.
Table XII has been included so as to show that the substantial differences in the livestock densities of both countries are found in farms of all sizes though they become less marked as acreages increase. The fact that the acreage under tillage is so extensive in Denmark ' means that there is not the same degree of choice as in Eire in the location of tillage areas, and hence one might reasonably expect higher crop yields in the latter country. Except for hay and potatoes, however, this is not so. Some figures on this matter are as hereunder :—
Yields of crops per acre (1934-8 average).
Wheat, cwts Barley, Oats, Potatoes, tons
Mangels ,, . Turnips
Sugar Beet (Factory) tons Hay (1938 only) cwts .
Denmark
24-2 23 7 21 3 6 8 23 4 17-7 13 5 38 1
Eire
18 9 19 7 19 5 7-6 19 0 17 9 9 8 43 9
Per cent of Eire to Denmark
0/ /o 78 83 91i 112
81 101 73 -115
Milk yields follow the same general tendency. The Danish milk yield in 1925 has been estimated at 645 gallons per cow, as compared with about 400 gallons for ]£ire, i.e., more than 50 per cent, greater The comparison is, of course, a reflection of the difference between the Danish milking breeds and our dual-purpose breeds.
By J. P Beddy, M Comm , D Econ Sc 199
and privately in Eire (see Mr. Murphy's important contributions m J.S.S.I., 1938/9 and -1941/2) and the results are summarised and contrasted in Table XIII for the two nearest years for which figures are available. They show a much higher family remuneration per acre in Denmark, irrespective of the size of farms. Though the figures for Ei^e represent a greater percentage return on capital, this arises only from our relatively lower capitalisation (about £21 and £24 per acre, respectively, on the N. Cork and W. Cork farms, as compared with £92 per acre on the Danish farms) Not only is more capital invested in Danish farms in buildings and livestock, but also m machinery. For 1932/3 it has been estimated that in Denmark the value of agricultural machinery, implements, etc., per acre, was just over £2.18.0, the figures for farms up to 25 acres and between 25 and 50 acres being 50 per cent, and 20 per cent, greater, respectively. These figures contrast with £1 and £1.14.0 respectively on the N. Cork and W. Cork farms surveyed by Mr. Murphy. To supplement this point, Table XIV shows the very great differences between Eire and Denmark in regard to the numbers of some leading items of agricultural machinery.
Industrial Enterprise.
It has already been pointed out that despite absence of coal, water-power or metallic ores, a greater proportion of the Danish working population is engaged in industrial and commercial pursuits than m agriculture. Denmark's industry and trade are, however, closely linked with her agricultural system. They have developed so -as to meet the needs of that system and have done so without tariff protection and despite proximity to two of the most highly industrialised nations of the world until to-day Danish industry supplies about 80 per cent, of total domestic market requirements The agricultural system is such that it involves the production, repair and renewal of large stocks of agricultural machinery and implements, the upkeep of extensive farm buildings, the importation and distribution—and m some cases the processing and packing—of bulky products such as oil seeds, fertilisers, animal food-stuffs, etc., the collection, handling and exportation of the large quantities of agricultural products, and, finally, the satisfaction of most of the everyday requirements of a farming community with a high standard of living and with so marked a degree of specialisation in output that such goods as bread, meat and even vegetables are now purchased rather than produced on the farm. In addition, there is the demand of the large urban population itself for industrial products of all kinds and for commercial and professional services. Hence,, it is not surprising to find such marked differences between fiife and Denmark as appear in the following •—
Industrial Output.
EIRE, (1936)
DENMARK (1935)
Value of Gross Output
£81 2 mill £219 6
Persons Engaged
153,888 459,775
200 A Comparison of the Principal Economic Features of Eire
and Denmark
Numerous small concerns have been excluded from the figures for Eire, but the addition of their gross output, estimated at £10 millions, has little effect on the large gap between the two sets of figures. Table XV gives the details of which the above is a summary. In no group do our figures approach those of Denmark, nor do our groups follow the same order of importance, our principal groups and those of Denmark being, from the employment standpoint, in the following order :—
E I R E
(Over 10,000 Employees per Group) Foodstuffs (includes inter aha breweries,
distilleries, bakeries and flour mills, bacon, biscuit'and tobacco factories) Technical and Chemical (includes inter
aha electricity, gas and water works, laundries, dyers and cleaners printers and soap and candle manufacturers) Building and Construction
Iron and Metals (including assembly, construction and repair of' vehicles)
DENMARK
(Over 20,000 Employees pei Group) Iron and Metals (includes 'inter
alia.ship-building aud machinery construction and repair)
Building and Construction
Foodstuffs (as per descript3on for Eire). Technical and Chemicals ( do
Wood (i e , wooden manufactures). Stone (includes bricks, cement,
pot-tery, glass, etc.)
Textiles (mainly spun, woven and knitted fabrics)
By J P Beddij, M Comm , D.Econ Sc 201
Size of Business Enterpriser {Personnel)
DENMARK (1935)
Small (including " one-man ") concerns With 1-5 persons
,, 6-20 „ ,, 21-100 „ ,, over 100,,
Persons Engaged 48,599(a)
125,692 78,656 92,935 113,893
459,775
]
1
y 0/
/o
37
17
20
24
100 $
1
2
8
E I R E (1936)
Small (including " one-man ") concerns Under 5 persons With 5-19 „
,, 20-99 „ ,, 100
and over
Persons Engaged 58,430(6)
2,455 18,459 42,902
95,783 218,029
1
J
%
27
8
19
43
100 9"
5
7
9'
(a) Obviously working proprietors , (b) excluded from Census of Industrial Production
Thus, the Danish small and medium-sized concerns (i.e., employing up to about 20 workers) account for 55 per cent, of persons engaged, while similar concerns in Eire account for only about 28 per cent, of total persons engaged. At the other end of the scale there are, of course, many large concerns in Denmark, though the Irish percentage for personnel in enterprises with 100 or over persons is co spicu-ously the greater. For example, in the industry which provides the most employment, i.e., construction of ships (iron) and machines, there were over 32,000 workers in 1935, of which almost 22,000 were engaged by 48 enterprises—the average per enterprise being considerably greater than that of our brewing industry.
Internal Trade
Marked cjifferences between the two countries also exist in regard to* internal trade, both wholesale and retail. Our population is 80 per cent, of that of Denmark, but the greater proportion of urban population in that country and the substantial volume of rural purchasing so increase the volume of internal trade that ours falls short of it by much more than 20 per cent. The following summarises the position for which detailed figures, so far as retail trade is concerned, appear in Table XVI:—
Wholesale Trade — Enterprises (Nos ) Persons engaged (Nos ) Turnover (£ mill ) Retail Trade —
Enterprises (Nos ) . . Persons engaged (Nos ) Turnover (£ mill)
DENMARK (1935)
General
6,044 50,461 £161 1
Agents, etc
5,631 14,288 £39 2
Total
11,675 64,749 £200 3
86,566 192,476 144-8
(1933)
1,419' 18,871 £37 3
202 A Comparison of the Principal Economic Features of Eire and Denmark
The turnover of our wholesale and retail trade in 1933 was nearly twice as large as our external trade and over If times as large as our gross industrial output; m Denmark the relative positions are somewhat similar. The4 Danish wholesale trade is considerably more developed
than ours, and as to retail trade, though our turnover per shop is only slightly below that of Denmark, our turnover per person engaged is only £499, as compared with the Danish figure of £752. The explanation of this is that we have relatively fewrer shops of a
medium size (£500-£5,000 turnover).
As to the share of the capital cities of each country m retail trade, the following shows the relatively wider marketing area tapped by Dublin shops, many of which have customers' all over Eire :—
Total Copenhagen Percentage
DENMARK (1935) No
of Shops 86,566
22,965 26 5
Persons Engaged
192,476
64,655 33 6
Turn-over £ Mill
144 8
50 5 34 9
EIRE (1933)
Total
Dublin Co Borough Percentage
No of Shops 37,628
5,609 14 9
Persons Engaged
124,799 29,455 23 6
Turn-over £ Mill
62 3 20 4 32 8
To conclude the review of industry and internal trade it should be said that about 79,000 persons were engaged m Denmark in 1935 m transport and communications as compared with 69,000 in Eire in 1936. In this category, therefore, figures are more in relation to total popula-tion than in either industry or internal trade.
i
External Trade.
The following contrasts the 1938 foreign trade of Denmark with that of fiire :—
Imports Exports . .
TOTAL, TRADE
DENMARK
£ Mill
72 5 68 5
141
Per Head of Population (latest Census)
£ 19 6 18 5
38 1
£ Mill
41 4
* 24 2 05 5
EIRE
Per Head of Population (latest Census)
. £ 14 0
8 1
' 22 1
supple-By J. P Beddy, M.Comm , D Econ Sc 203
mented by pensions and emigrants' remittances from abroad, the investments being partly fortuitous* to the exterit that they arose through the exceptional circumstances and high price levels associated with the 1914-18 War,
On the export side, Table XVII sets out the most important export items in the foreign trade of both countries. Denmark's trade in Butter was almost 8 times that of Eire , in Bacon nearly 7f times and m Eggs over 5 times, while our trade in Live Animals was 3J times that of Denmark Our trade is much less diffused, i.e. we have one large export item (live cattle) against which Denmark has two such items (butter and bacon) each of which is over If times greater than ours—in fact Denmark's trade in eggs alone, which is her third item of export, repre-sents 60 per cent, of our cattle trade Alternatively, our trade in Jive animals is offset by the Danish trade in live animals and machinery ; our drink trade is offset by the Danish trade in tnimal and vegetable oils, fats and waxes and this leaves the very great difference of £36 mill, in dairy products, eggs and meat, in addition to a further £2§ mill, in fish and non-metallic minerals. The two sums are over ]J times our total export trade' in 1938.
From the figures for export trade, interesting comparisons which are summarised m Table XVIII, may be drawn The figures show that while there are 1|- times as many milch cows m Denmark as in Eire, the former country produces over three times the amount of butter. Denmark exported over 80 per cent of her output (in previous years over 90 per cent.) while Eire exported not quite one-third of output, the result being that Danish exports were 8J times those of Eire in quantity and, because of a somewhat lower average price, was over 7f times ours in value.
In regard to bacon, with a pig population of nearly three times that of Eire, Denmark's output was nearly four times greater She exported two-thirds of her output while we exported 47 per cent, of ours, the resultant Danish exports being 6J times that of Eire in quantity and, because of higher prices, over 7J times in value.
As for eggs, with not quite If times the number of our poultry Denmark produced over If times our output of eggs, of which she -exported 77 per cent, as against our 30 per cent, and hence her exports were 4f times greater than ours in numbers and 5 | times greater in value since Danish eggS commanded a 10 per cent, higher price.
204 A Comparison of the Principal Economic Features of Eire
and Denmark
of comparison these figures help towards an appreciation of the magnitude of the greater agricultural productivity of Denmark.
As regards imports, Table XIX compares the main import items of both countries. The type of imports which constitute our 20 leading items and represent nearly 79 per cent, of total imports account in Denmark for about 72 per cent, of total imports but their order and magnitude in the import lists differ considerably. In addition, some of Denmark's leading types of imports have no counterparts m our list. In general we import relatively more consumers' goods while Denmark, because of her greater industrialisation and her different agricultural technique, imports relatively more producers' goods. Compared on the basis of the League of Nations' Classification of Imports, the 1938 figures are :—
•
Imports — Crude
Simply transformed More elaborately
trans-formed Unclassified
DENB
£ (000's)
21,042 27,091
24,363
N i l
72,496
4AEK
0/
/o
29 1 37 4
33 5 — 100
EIRE
£ (000's)
14,899 8,194
16,941 1,380 * 41,414
0/
/o
36 0 19 8
40 9 3 3 100
In crude products, our actual figures exceed those of Denmark in such goods as wheat, maize, food, beverages (tea is nearly £\ mill-more) and tobacco (£1-35 mill, mill-more) and we import relatively more coal, whereas Denmark imports actually and relatively more fertilisers, oil seeds, nuts, etc. In simply transformed goods, Denmark's substantial lead is m animal foodstuffs, iron and steel, oils and fats, coke and petrol. In more elaborately transformed goods our relative lead is mainly in goods ready for retail sale or consumers' use and in capital equipment which we do not ourselves manufacture, while Denmark's figures exceed ours actually and relatively in such items as textile fabrics, vehicles and transport equipment, wood, cork, pulp and chemicals
As to destination of the exports and the sources of the imports of" both countries, we have a greater degree of reliance on a single export destination and a somewhat more restricted field in the-matter of imports. Our trade with Great Britain and Northern Ireland about balanced in 1938 (imports almost £21 mill., exports £22 mill.) and we utilised our income from external sources to purchase-goods from other countries. Denmark's trade with Great Britain in the same year resulted in an export surplus of over £13 mill, which she used to finance purchases elsewhere.
By J P. Beddy, M.Comm , D Econ Sc 205
between 7-3 per cent, and 9*1 per cent, and are in the main very steady ; ours vary between 5-9 per cent, and 10-8 per cent, and are less steady.. If, however, instead of total exports, a comparison was based on exports of butter, bacon and eggs our figures would be very much less steady than those of Denmark—for example between 55 per cent, and 60 per cent, of our creamery butter production is between May and August.
National Income ; National, Local and Agricultural Debt.
As might be expected from the various figures already quoted, the national income of Denmark is greater than that of Eire. In the Majority Report of the Banking Commission (p 304) the figures shown in respect of the" national incomes per head of population in Eire and Denmark indicate that the total national income of the former country was in excess of ours by about £66J millions, or almost 45 per cent. How far this difference is representative of a number of years is difficult to assess, but at least one other estimate (that of Mr. Colin Clark) which relates to 1925/34, puts the Danish national income at approximately 40 per cent, in excess of ours.
Despite our lower national income, our national debt is greater than that of Denmark. Quoting again from the above Report, the Danish rational debt in 1934 was £59J mill, or £16 per head of popula-tion, while ours was £73 mill, or £24 per head of population. The built of our debt (about 92 per cent.) carries interest rates not exceeding 4|.per cent., whereas 37 per cent, of the Danish debt is at rates varying from 5 per cent, to 6 per cent. Only an insignificant part of our debt is external and is covered many times over by our substantial foreign investments of upwards of £300 mill, (pre-1939), whereas over half (54-7 per cent.) the Danish funded debt (£53 J mill, in 1938) is external, Denmark being a debtor country. In 1871, however, she was a creditor country having foreign investments of some 140 mill. Kroner, which at the then existing value of money and in relation to her size and importance was substantial. With her considerable capital investments at home, particularly in agriculture, she has not only realised her foreign investments but has borrowed abroad to the extent of over £29 mill.
A point of importance is that if the value of State assets are set against Denmark's national debt there is a net State wealth of about £16 mill. These assets consist of cash, securities, State lands and undertakings such as State Railways, the Postal System, Parks, Forests, State Build-ings, etc. and yield a revenue sufficient to meet about 85 per cent, of the total interest charge on the national debt. In Eire, our State assets are insufficient to cancel our State debts and hence what has been termed our net dead-weight debt (over £37 mill, in 1937) is substantial.
The debts of local authorities in both countries also differ. In 1938, those of Denmark amounted to £53-6 mill, or £14 10s. per head of (1935) population. In Eire, such debt amounted to £30-1 mill, or a little over £10 per head of (1936) population. As in the case of national debt in Denmark, the value of the capital assets of local bodies exceeded liabilities, the surplus being £28-3 mill. Comparable figures for Eire are not available.
As to agricultura7 debt, the nature of the farming activities in Denmark
206 A Comparison of the Principal -Economic Features of Eire
and Denmark
buildings. In July, 1937, out of almost 202,000 agricultural holdings only just over 7,400 were free from debt, while 60 per cent, of all pro-perties were mortgaged to the extent of about 76 per cent, of their mortgage value, Jutland being the biggest borrower. Total mortgage debt was over £184 mill, to which should be added a further £13f mill, other debt, making in all £198 mill, of which 64 per cent, referred to Jutland which covers 45 per cent, of Danish territory. These figures indicate a debt of over £25 10s. per cultivated acre. The bulk of the finance is provided as follows, the portion provided by commercial banks being relatively small:—
£ Mm.
By Agricultural Credit Societies ,, Savings Banks
,, State
fi Commercial Banks . .
,, 'Other financial organisations
TOTAL
89-5 32-7 15-4
7-4
34-4 .. £179-4 (90-6
total
% o f
debt) By contrast, the figures for Eire are very small and are symptomatic of our light agricultural capitalisation rather than of freedom from the necessity to borrow. According to the Majority Report of the Banking Commission the advances to farmers by Irish Banks amounted to £12-6 mill, at January, 1937. To this should be added £-8 mill, for loans to Co-operative Societies and £1-4 mill, (at 31/10/'36) for loans by the Agricultural Credit Corporation. These amount in all to £14-8 mill, or a little over 25/- per cultivated acre. Even if there is added the £26-8 mill, outstanding Land Bonds at 31st March, 1937 (a debt which has no Danish counterpart) the total of £41-6 mill, or just over £3 10s. per cultivated acre is still veryjfar short of that of Denmark and indicates the room which exists in ]£ire for further agricultural investment.
Standard of Living
Despite substantial payments by so large a part of the Danish com-munity for interest and amortisation charges, there is a higher standard of living than in l£ire as indeed is suggested by the respective national incomes of both countries. While available statistics do not admit of precise measurement in this matter, a few facts will serve to support the point. In Denmark in 1938 there was a telephone to every 10 or 11 persons ; in Eire there was not quite one to every 100 persons. So also, nearly one out of every five persons had a wireless set as compared with a little over one to every 20 persons in iSire. These and other amenities are not confined to urban districts. Unlike Eire, in nearly all rural homes there is electric light; in many there is central heating, a bathroom and a telephone ; while in even the smallest house there is usually a wireless set. In addition, Denmark had over 2J times more automobiles than Eire in 1938.
By J. F Beddy, M Comm , B Econ Sc
1937 Consumption per Head pw annum
207
T e a
Coffee Sugar Tobacco
DENMARK
0-3 lbs 16 5 lbs.
7 9 stones 4 9 lbs
E I R E (Estimated)
8 6 lbs 0 2 lbs 5 4 stones 3 2 lbs
(Figures for l£ire have been estimated on the basis of imports except m the case of sugar for which 100,000 tons has been taken as the annual national consumption .
While we are among the heavy tea-drinking nations, Denmark a& a consumer of coffee drinks about one-third more.per head than U.S.A. and is also one of the world's heaviest consumers of sugar. In Butter and Milk she falls far short of Eire, some figures regarding this being :—
Consumption per Head per annum.
Eire, 1938/39 Denmark, 1925
Butter (lbs )
32 12
Milk (gals)
31 19
Milk equivalent of Butter and Milk'
111
50 (increased greatly after 1931)
This, however, is no indication of a higher standard of living, since the figures in the final column compare with 65 for Great Britain and 82 for U.S.A. ; all that the figures signify is that we use butter and milk as alternatives to other foods to a much greater extent than many other countries. This is a reflection of our relatively low purchasing power which restricts the shopping activities of our rural population. We are also heavy consumers of eggs, our figures per head in this respect being a little over twice those of Denmark. In* meat, however (i.e. a dearer commodity and one which must usually be purchased in shops)^ our consumption is substantially lower than that of Denmark ; per head of population we eat about 40 per cent, less pig products and only about half as much fresh meat. So also in cheese, our consumption is trifling while that of Denmark is, in weight, over 75 per cent, of her butter consumption. Finally, Denmark's consumption of fish in 1938 was 36-lbs. per head of population which contrasts with approximately 12i-lbs. in Eire.
Conclusion
208 A Comparison of the Piincipal Economic Featuics of Eiie
and Denmark
in Denmark and also on her advanced educational system (in particular, adult education through the Folk Schools) that it is ur- necessary to do more than acknowledge the great importance of their contributions to Danish economic advancement Emphasis on this importance, powerful and far-reaching as it has been, might perhaps distract .attention from what has been stressed m this paper as the fundamental explanation of the differences between Eire and Denmark in economic prosperity and social welfare. Primarily and indeed, paradoxically, it is our climatic advantages which are the cause of our relative economic and social disadvantages since they permit us, though they do not compel us, to adopt a system of agriculture which has led to a declining population, a heavy emigration, a low agricultural productivity, restricted activity in agriculture, m industry, in commerce and m foreign trade and a lack of opportunity for profitable domestic invest-ment of capital resources. If ]£ire is to advance towards the leahsation of her true and greater economic destiny it can only be on the basis of an agricultural system involving a far more intensive utilisation of her natural resources than at present. It is for agricultural experts to advise on the means to this end, and no doubt our great advantages in the production of grass will dictate a system with a pattern somewhat .different from that of Denmark.
There remains the difficulty of finding profitable markets for a greater agricultural output. Apart from the home market which would expand under a more intensive agricultural system (especially if, because of better education, public standards of taste m food, clothes and housing improved) access to export markets on the basis of regular and not merely seasonal production would be necessary. No one can foresee the course of international trade but this does not involve refraining from catering for it especially by means of a system which permits of as much flexibility as possible, and hence of adjustment to changes in demand (eggs and bacon being examples of commodities which react quickly to price changes). At any rate the task of gearing a more highly developed agricultural system to the most suitable available volume and type of export trade is not an insuperable one. With any system we must have exports to pay for our imports. What is important is that the system shall be free from the restrictive effects of our present one and by stimulating maximum profitable agricultural activity and employment will enable us ultimately to attain greater general economic prosperity "by that natural method of progress epitomised by the late Sir Horace Phmkett in his familiar phrase " Better farming, Better business, Better living."
-I wish to express my gratitude and thanks to the Danish Consul (Mr. H A. V. Osterberg) and his Staff who so kindly permitted me access to official Danish pubhcations, to Mr. B. Olsen for his help m translation difficulties, and to the officials of the Meteorological Office, m particular Dr. L. W. Pollak, our colleague in this Society^ for providing me with climatic data.
By J P Beddy, M.Comm , D.Econ Sc 209
satisfied that this consideration does not necessitate the qualification of any of the conclusions m this paper.
Finally, I desire to pay a tribute to the excellence of the official statistics of Eire. Not only do they measure up fully to the high standards of the Danish statistics, but in certain important respects are distinctly superior—in particular, m relation to agricultural and industrial, output.
TABLES.
I—Changes m Population in Denmark and Ewe, 1880-1936.
Year
1880 1890 1901 1911 1925 (a) 1035 {a)
DENMARK
Population (thousands)
1,969 2,172 2,450 2,757 3,435 3,706
% Increase
13 5 12 8 12 6 24 6 7 9
Year
1881 ' 1891 1901 1911 1926 1936
IClRE
Population (thousands)
3,870 3,469 3,222 3,140 2,972 2,968
% Decrease
10 4 7 1 2 5 5 3 1-3
(a) Include South Jutland, acquired under Treaty of Versailles
IT.—Marriages, Births and Deaths since 1871 (per 1,000 of Population).
1871-1880 1881-1890 1891-1900 1901-1910 1911-1920 1921-1930
D E I
M
7 8 7 3 7-2 7 3 7 - 4 f 7 8
OEABK
B
31-4 31-9 30-2 28 6 24-9 20.8
D
19 18 17 14 13 11
4 5 5 2 0
. 9
Natural Increase (Births Deaths)
12 0 13 4 12-7 , 14-4 11-9 9-6
1871-1881 1881-1891 1891-1901 1901-1911 1911-1926 1926-1936
M
4 5 4 0 4 4 4 8 5-0 4 6
ElRfl
B
26 22 22 22 21- 19-2 8 1 4 1 6
D
18 17 17 16 16 14 1 4 6 8 0 2
N a t u r a l Increase (Births
Deaths)
210 A Comparison of the Principal Economic Features of Eire
and Denmark #
III — • Aierage Annual Emigration since 1871
1871-1881 1881-1891 1891-1901 1901-1911 1911-1926 1926-1936
E I R E
50,172 59,733 39,641 26,154 27,002 16,675
DENMARK
1871-1880 1881-1890 1891-1900 1901-1910 1911-1920 1921-1930
3,900 8,200 5,000 7,300 5,200 5,900
The Danish figures represent net overseas emigration while the figures for represent net emigration (including emigration to Great Britain, etc.).
TV—Single persons invasions Age Groups expressed as a percentage of the total persons Married, Widowed and Single in that Group.
Age Group
"£ire, 1936 Denmark, 1935
Eire, 1936 . . Denmark, 1935
' 15-19
99 9 99 9
99 1 97 8
20-24
96 2 88 8
86 4 68 4
25-29 30-34
Males 82 3 50 5
63 5 25 2
35-39
48-4 14 9
40-49
370 10 1
Females
64-1 35 0
44-1 22-9
32 8 18-7
26 3 16-2
50 & over
27 3 76
23-5 13 9
V—Population according to Age Groups
Tqtal Number (thousands) . . Females per 1,000 Males
Age Groups 0-14 Years 15-24 ,, 25-34 ,, 35-44 ,, 45-59 ,,
60 and over . .
Males Denmark
(1935)
1,824 — % 26 1 17 8 16-'5 13-4 15 4 10 8 100 0
Eire (1936)
1,520 — 0/
/o
27 4 17 9 13 6 11 9 15-4 13-8 100 0
Females Denmark
(1935)
1,882 1,032
0/ /o
24 7 17 2 16 7 13 9 15 7 11 8 100 0
Eire (1936)
1,448 952 o/
/o
27 9 17-3 13 3 12 1 15 0 14 4 100 0
All Persons Denmark
(1935)
3,706 —
0/ /o
25 3 17 5 16 6 13 7 15 6 11 3 100 0
Eire (1936)
2,968 —
0/ /o
By J P Beddy, M Comm , D.Econ Sc 211
VI—Distribution of Population between Urban and
Type of Town, etc
d
Pipital and Suburbsop. over 50,000 , 40,000-50,000 , 20,000-40,000 , 10,000-20,000 5,000-10,000 1,500- 5.000 500- 1,500 200- 500 Less than 200 Total Town and
Vill-age Population Other Population TOTAL ». DENMABK (1935) No. of Towns 2 I 8 20 23 69 235 — Total Pop 946,630 169,301 48,132 207,082 270,735 171,170 185,509 198,723 101,759 2,299,041 1,407,308 3,706,349 o/ /o 25 5 4 6 1 3 5-6 7 3 4 6 5-0 5-4 2 7 62-0 38-0 100 Rural Areas
£ I R E (1936
No of Towns 1 1 1 8 18 69 121 215 386 — — Total Pop 507,888 80,765 41,061 27,968 102,917 108,925 184,984 98,685 67,070 47,620 1,267,883 1,700,537 2,968,420 0/ /o 171 2-7 1-4 0-9 3 5 3-7 6-2 3 3 2-3 1-6 42-7 57-3 100
VII — Wo? king Population.
(League of Nations International Classification')
Industrial Group
Agriculture and Fisheries Industry . . Commerce . Other Employments
TOTAL
£ i r e (1936)* Number Per-(thousands) centage 616 199 127 293 1,235 49 9 16 1 \2 6.5 10 4 /2 6 5 23 6 100 Denmark (1930) Number Per-(thousands) centage 560 431 196 401 1,588 35 3 27 2 \3 12 3 /a y 5 25 2 100
* Persons at work, industrially classified.
VIII.—Changes in Utilisation of Land 1871-1938
Percentages of Cultivated Land (other than Fallow) devoted to Cereals, etc
Cereals
Root Crops and other Crops
Hay and Pasture
TOTAL 1871 Den-mark 45 3 2-6 52 1 100 IS ire 12 0 94 78 6 100 1901 Den-mark 43 3 7 9 48 8 100 ID ire
212 A Comparison of the Principal Economic Features of Eire
and Denmark
IX.—;Pe?c6?uage Distribution of Farms
Acres 1-15 15-30 30-50 50-100 Over 100 ^IRE (1931) Numbers of Farms (Percentage) 30 9 26 9 18 6 14-9 8 7 100 Areas of Farms (Percentage) 7 0 15-5 17-9 24 9 34 7 100 DENMARK (1933) Acres 1-12 12-25 25-37 37-74 74-148 Over 148 Numbers of Farms (Percentage) 27-2 24-5 13 2 22 3 10-5 2 3 100 Areas of Farms (Percentage) 5*2 11-4 10-5 30-7 26-6 15-6 100 Holdings in fiire under 1 acre have been excluded so as to facilitate comparison
with the Danish figures)
X—Utilisation of Areas under Crops and Pasture.
Description
CORN CROPS —
Wheat Oats Barley Rye Mixed Cereals Others
TOTAL . .
ROOT AND GREEN CROPS . —
Potatoes Turnips ...
Mangels and Swedes . . Sugar Beet ... . . ... < Others
TOTAL . .
Flax and Fruit and other cropped land
Total Corn, Root and Green Crops, Flax and Fruit
Green Fodder, Lucerne and . . Hay
Total iCrops (including Hay) ... Pasture
Total Area,under Crops and Pas-ture Acres (Thousands) ]£IRE (1938) 230 570 118 2 — (6) 920 327 143 85 51 29 636 12 1,568 2,037 3,605 8,040 11,645 DENMARK (1938) 331 941 999 364 758 9 3,402 199 35 844 150 , 87 , 1,315 109 4,826 933 5,759 2,236 7,995
Percentage of Total Area' under Crops and
By J P Beddy, M.Comm., I) Econ 8c 2VS
X I — Utilisation of Crops and Pasture Areas by Sizes of Holdings (Holdings over 1 Acre).
»ize of ldmg axes 5 10 15 30 50 100 200 re 200 Com Crops % 8 0 8 5 8 2 7 4 7 1 7 0 6 2 3 8 EIRE (1931) Root and Gieen Crops % 17 1 10 7 9 0 7 3 6 2 5 3 4 2 2 5 Total Ploughed. Land % 25 6 19 3 17 2 14 7 13 3 12 3 10 4 6 3 Hay % 29 4 27 7 26 1 23 7
2 1 9
20 1 17 2 12 5 Pas-ture % 45 0 53 0 56 7 61 6 64 8 67 6 72 4 81 2 Total Crops and Pas-ture Acres (000) 93 272 454 1,812 2,087 2,901 2,269 1,781
Size of Holding
Acres 1- 4 4- 7 7- 12 12- 25 25- 37 37- 74 74-148 148-296 above 296 DENMARK Corn Crops . % 37 3 42 0 43 8 43 7 43 1 42 6 41 4 39 4 41 6 Root and Green Crops % 25 2 22 8 21 8 20 6 18 8 17 1 15 1 13 0 12 8 1933) Total Ploughed Land % 66 5 66 6 66 6 64 7 62 3 60 2 57 2 53 6 58 8 Hay, Green Fodder
a n d
Lucerne % 11 7 13 4 13 3 13 5 13 6 14 0 13 7 12 8 9 3 Pas-ture %
2 1 8
20 0 20 1 21 8 24 1 25 8 29 1 33 6 31 9 Total Crops and Pas-ture Acres (000) 20 107 272 882 814 2,360 2,052 707 505
XII—Livestock Densities %n Relation to Farms of different sizes (Holdings over 1 Acre). Numbers of Livestock per 1,000 Acres of Cultivated Land
Area (Acres)
1 - 6 6 - 10 . 0 - 15 5 - 30 . 0 - 50 0-100 •0-200 :>ove 200 Total Cattle 500 442 400 362 351 348 328 292
E I R E (1931)
Milch Cows 233 185 156 130 121 112 82 41 Pigs 275 164 152 134 125 112 74 32 Sheep 351 292 253 253 271 275 322 410 Poultry 10,317 5,340 4,253 3,045 2,130 1,461 894 451 Horses 85 55 49 45 43 39 31 22 Area (Acres)
1 - 4 4 - 7 7 - 12 1 2 - 25 2 5 - 37 3 7 - 74 74-148 148-296 296-593 593 and over
Total Cattle 514 520 504 454 430 414 373 329 308 284 DENMAI Milch Cows 390 391 355 296 254 225 191 164 166 166 EtK (193
P i g s
1,095 935 896 738 626 570 481 410 328 250 3) Sheep 27 21 12 12 20 23 26 25 20 16 Poultry 25,650 13,000 7,857 4,864 3,278 2,349 1,599 924 520 285 Horses 91 108 125 98 68 60 68 43 34 34
XIII—Summary of Financial Results of Selected Fatms
937-8 Eire (N Cork)
940-1 ,, (W. Cork)
936-7 Denmark No of Farms 98 61 811 Average Area per Faim (Acres) 74 28 93 7 Gross Receipts per Acre £ 5 02 9 15 27 5 Expenses per Acre Labour £ 2 72 4 73 13 0 Other Expenses £ 2 30 4 42 14 5 Family Remun-ration per acre (mcl m Laboui chaige) £ 1 90 4 12
8 3 (a)
Percentag Crops 6 1 19 5 10 9 Cattle 66 3 32 4 45 6
e of Gross Receipts fiom Pigs 17 2 20 3 28 6 Poultry 9 3 23-7 8 6 Sun-dries 1 1 4-1
214 A Comparison of the Principal Economic Features of Eire
and Denmark XIV— Agricultural Type
Power Machinery — Tractors
Steam Engines . . • Electric Motors . . Oil, Petrol and Gas Engines Windmills . .
Field Machinery —
Seed-Sowing Machinery—Corn Drills —Broadcast sowers Mowers and Reapers
Self Binders Potato Diggers Beet Lifters Manure Distributors Liquid Manure Distributors Stable and Barn Machinery —
Ordinary Threshers . . . Other Threshers (including combined
Threshers and Finishers and Winnowers) Straw Balers (or Compressors)
Crushers . . . .
Chaff Cutters
Liquid Manure Containers or Pits Ensilage Containers or Pits
Machinery. DENMARK (1936) 6,660 1,268 73,511 34,822 15,514 112,237 15,823 126,539 82,303 7,133 19,954 11,965\ 5,499 / 33,163 109,020 43,796 86,089 139,728 174,418 1,218 EIRE (1929) 797^ 580 | 177 J-1928 '2,430 | 74 J 13,134 3,372 106,472 17,558 10,826 No figures Q Q/1O O,6<kO 8,473 20,648 292 6,033 22,011 1 [•No figures
J
XV — Industrial Production
(NOTE —Irish figures are exclusive of small, including " one-man " concerns, gross output of which was about £10 mill)
EIRE (1936)
Natuie of Commodity
Foodstuffs (including Drmk and Tobacco)
Tianspoit and Local Authorities a n d Government Depts
Technical and Chemi-cal and Others
Building and Con-struction
Iron and Metals
Clothing
Wood
Leather
Stone, Ceramics and Glass Textiles TOTAL Entei-pnses 1,048 130 790 614 383 331 367 91 269 91 4,123 N o Of Persons Engaged 31,411 28,764 25,192 18,207 10,618 15,440 6,769 6,474 4,993 6,020 153,888 Gross Value of Pro-duction £Mill 43 7 4 6 10 5 5 4 5 3 3 8 2 4 2 4 1 0 2 1
8 1 2
DENMARK (1935)
Natuie of Commodity
Iron and Metals
Building and Construc-tion
Foodstuffs ' (including Drmk and Tobacco)
Technical and Chemical and Other?
Clothing
Wood
Stone, Ceiamics and Glass
Textiles Leathei TOTAL Entei-prises 17,619 18,711 16,045 16,367 11,757 10,653 2,357 980 7,807 102,296 N o of Peisons Engaged 95,164 79,087 73,677 70,888 49,597 31,390 22,445 20,129 17,398 459,775 \ Gross Value of Pro-duction £Mill 30 7
1 8 1
By J P Beddy, M Comm , D.Econ Sc 215
XVI—itefewZ Trade
DENMARK (1935)
IIETATL TRADE
Oroceis (mcl Co-op Societies) Bread, Milk, etc Butchers' ( 1 e Meat,
including Pork) Fruit, Vegetables and
Flowers Tobacco and Wines Other Foodstuffs Drapers
Boot and Shoe Eetailers Paper, Books, Music,
E t c
Woodwoikeis, etc Furniture
Hardware, Glass, Poi-celam
Autos, Cycles and Vehicles
Hotels
Restaurants and Pen-sions g Sundry Otlieis TOTAL Entei-prises No 16,748 10,218 6,257 4,703 4,280 5,107 8,558 2,432 2,430 2,732 3,571 1,328 2,764 1,975 > 6,384 7,079 86,566 Pei Sons Engaged 36,625 20,276 10,158 8,466 5,709 11,532 24,764 3,338 5,705 5,349 4,491 4,355 3,266 12,728 25,900 9,814 192,476 Turn-over £ Mill 42 3 12 6 9 7 3 8 4 6 6 6 22 5 2 6 3 1 6 0 4S, 3 1 5 3 3 3 8 0 7 0 144 8 EIRE EETAIL TRADE
GI ocery and Pi ovisions Public Houses and
Grocery (comb ) Public Houses Biead, Flour,
Confec-tionery Fiesh Meat Vegetables and Fimt Sweets, Tobacco and
Newspapers Milk and Dany
Pio-ducts Other Foodstuffs Drapei s
Boot and Shoe Eetaileis Paper, Stationery and
Books
Hardware, Glass and Porcelain Cycles and Autos (mcl
Garages)
Hotels and Ptestaurants Co?l Merchants Metals & Metal Goods Jewellery, Watches,
etc Chemists Hucksters
Otheis l
216 A Comparison of the Principal Economic Features of Eire
and Denmark
GROUP
Live Animals (chiefly for food)
Dairy Products, Eggs and Honey Meat Beveiages Machmeiy, Vehicles and TianSport Equipment
Annual and Veg Oils, Fats, Greases and Waxes and their Manufactures FisL Non-Metallic Minerals TOTAL XVII—Export Value £000 10,390 3,692 3,070 2,345 7 -19,497 EIRE Mainly Co'isistii of £000 Cattle Butter Eggs Bacon Other Pig Pro
ducts Poultry Portei,Beera AJe -— Items g 9,574 2,160 1,177 2,206 238 427 nd 2,205
Exceeding £1 Mill
Per-centage of Total Domestic Exports 43 5 15 5 12 8 9 3 -83 6 1 Value £000 3,145 24,351 18,411 7,847 2,501 1,594 1,166 59,015 DENMARK Mainly Consisting of £000 Cattle Pigs 2,192 916 Buttei 16,903 Eggs 6,211 Bacon Machinery Ships Autos, includ-ing Chassis 16,174 3,140 3,329 1,340 Hydrogenated Oils and Fats 568
Lard 500 -Cement -236 Pei-centage of Total Domestic Exports 4 6 35 6 ?6 9
1 1 5
". 6
2 3
1 7
86 2
NOTE —The inclusion of Horses and Gaeyhounds, etc , in the figures for Live Animals exported from Eire would increase the total to £11,942,000 and the percentage to 50 0 per cent It would increase the total of the Table to £21,049,000 or 88 1 pei cent of totat domestic exports The item has been omitted as it do^s not come within the gioup description
XVIII.— Value of Export Trade in relation to Stocks of Animals (1938).
No. of Milch Cows Butter Produced (cwts )
Butter Exports—Quantity (cwts ) —Value (£000) . No of Pigs
Output (cwts )
Bacon Exports—Quantity (cwts ) —Value (£000) No. of Hens and Ducks Egg Output (Gt Hunds ) Egg Exports—Quantity
(Gt. Hunds.) ... —Value (£000) DENMARK (1) 1,599,200 3-72 m 3,111,200 16,903 2,841,600 4,568 3,425,900 16,174 14-5 m 16-9 12-988 6,211 EIRE (2) 1,281,852
1 2 m 377,467 2,160 958,805 1,160 545,834 2,206 10 05 m
9-17 2 726 1,177
RATIO OF • (1) TO (2)
12 to 1 -3-1 to 1 8-2 to 1 7-8 to 1
By J. P Beddy, M Comm , B Econ.Sc 217
XIX—Twelve Leading Import Items (1938)
ElBB
Description
!
Cereals
>ducts for Heat-"*} Qg, Lighting & > 'ower,
Lnbn-•ants, etc J
stile Fabric*
h^clesandTians-»OTt Ectuipment
a, Coffee, Cocoa, etc
se Mewl Manu-factuies
n-Electric Machinery
ood, Cork and Mknufactuie&
ec Machmeiy
311 and Steel
ip, Paper, etc
rns and Thread Value £000 5,530 5,083 2,348 1,830 1,804 1,766 1,753 1,462 1,241 1,234 1,183 1,162 26,396 Pei-centage of Total Imports % 13 4 12 3 5 7 4 4 4 3 4 3 4 2 3 5 3 0 3 0 2 8 2 8 63 7 Large Individual Items /Wheat 3,048 \Maize 2,258 fCoal 3,319 j Petrol 695 J Lamp Oil &
! White Spmt 302 ULubncating O.I 190 (Cotton 3,003 Wool and
< Fine Hairs 548
Art Textile [_ Fabrics 357
Motoi Cais (Chassis) 805 (Bodies) 531
Tea 1,072
(Plates, Sheets Bars, Eods and/ Tubes)
f Wool and
*{ Fine Hair 582
^Cotton 370
DENMARK
Descuption
Products for He3tmg- Light-ing and Power, Lubricants, etc
Animal Foodstuffs
lion and Steel
Textile Fabrics. Cereals Vehicles and Transport Equipment Oil Seeds Fertilisers
Wood, Coik, etc
Non-Electric Machinery
Pulp, Paper etc
Base Metal Manufactures Value £000 10,880 5,306 5,063 4,745 4,710 3,868 3,359' 2,881 2,793 2,266 2,320 2,037 50,028 Per-centage of Total Imports % 15 0 7 3 7 0 G 5 6 5 5 3 4 6 4 0 3 9 3 1 2 9 2 8 68 9 Laige Individual Items (Coal 4,334
< Coke 2,382
[Petrol 1,702
Oilcakes 4,707 (Mainly Cotton and Sunflower Seeds, Ground Nuts)
Bars, Sheets and Tubes ("Cotton 1,858 <( Wool,etc 1,627 {^Artificial 650
(Maize 1,868 <( Wheat 1,515
[Rye 704
(Autos (in 1 parts, 2,182
< Autos
(com-plete) 617 [ships 492
/Soya Beans 1,520 \ C o p i a 864
"Calcium Nitrate, Sulphate of Am-monia, Nitrate
< of Soda,
Phoe-p h a t e s a n
218 A Comparison of the Principal Economic Features of Eire
and Denmark
APPENDICES.
and Local Taxation—-1937-8
State Taxation ..' Local Taxation
TOTAL
Per head of population
Combined Expenditure Social Expenditure Education
Koads, Streets, Bridges and Sanitary Services Justice
Agriculture and Fisheries Defence
Debt Service . .
TOTAL
E I R E
£31-21 m 5 85 m
£37-06 m £12 6
£ Mill
7 9
5-1
3 6
2 1
4-1
1 5 1 8
—
Percentage of Total .Revenue 21 3" 13-8
9-6^ .44.7
5 7 11-1
4 0
4-9
70 4
DENMARK
£23-25 m. 22 82 m.
£46 07 m £12 4
£ Mill
14 7 .
6 9
5 9
2-1
1 9 1 7
—
—
Percentage of Total Revenue
31-9") 15 0 ^59-7
12 8J
4 6
4 1
3 7
—
72-1
(2)—Legal Tender Circulation
Legal Tender Notes (end of 1938)
Per head of popubati and
on .
Bank Notes in Circulation
DENMARK
£19-7 m
£5-3
l^IRE
£15-9 m
By J P Beddy, M.Comm , D Econ Sc 219
(3)—Bank Deposits, 1938.
Deposits
Current, Deposit and other Accounts
Savings Bank JDe}3osits
TOTAL (approx )
Per head of population
DENMABK
£114-4 m
98 1 m
£212-5 ra £57 3
E I R E
£157 0 m ~\ Trustee 2 3 m
I P.O.S.B 1 (me. Gt B) J 11 4 m
£170 7 m £57 5
(4) Balance of Payments, 1938—-Main Items only £ Million
DENMARK
Capital Items Debt Amortisation Loans
Foreign Invest-ment
Foreign Credits or Debits (I e short term)
Sundries
Total Capital Items Current Items
Impoi ts & Exports Loan Interest Remittances
(Business) Tourists
Freights earned abroad Navigation Exes Sundries
Total, Current Items
Outward
2 0 —
3-3
5 2
0 7
11 2
74 3 4 0 0 7 2-2
— 4 3 0 9
86-4
Inward
— * 2 5
1-3
0 9
0-4
5 1 . 70 6
0 7 1 8 1 6 12 5 3 3 0 9 91 4
ElBE
Financial Agreement Payment Foreign
Invest-ment
Changes %n ' Sterling Holdings
of Currency Com Net External
assets of Banks Other sterling
hold-ings
Payment to For-eign L A Coys Sundries
Imports & Exports Investment Income Emigrants'
Remit-tances
P e n s i o n s f r o m abroad'
Sundries
Outward
' 10 00 4 32
2 00
0 27
0 16 1 30 18 05
41 05 7 10
—
—r
1 07
49 22
Inward
—
3 54
5 05 1 28
— 4 21 16-08
23-88 13 40 3 43 2 43 3-33
220 A Comparison of the Principal Economic Features of Eire
and Denmark
(5A) Co-Operative Oiganisations
DENMARK
Dsscnption
Co-operative Dairies Co-operative Bacon
Factories Egg Exporting
Societies Cattle
Feeding Stuff ,, Fertiliser ,,
No of Organi-sations (Local Societies)
1,405
61
800 18
1,476 1,458
(1037)
No of
Members
190,000
192,180
45,000 16,682 93,275 55,757
Turn-over
£m
25 9
20 8
1 1
0 8
6 0 1 1
ElKE
"Desciiptior
Cieamenes
Other Agiicultmal Pro-ductive Societies Otliei Pi oductive Societies Agricultural Distributive
Societies Other Distributive
Societies Othei Societies'
(1038)
No of Organi-sations
219
7 •8
85
21 168
No of
Members
52,160
14,053 3,802
18,958
15,145 44,672
Turn-over
£ra
7 0
0 95
—-1 2
0 2 0 3
(5B) Co-Opeiati%e Organisations—Denmark (1923)
•
Description
Co-opeiative D a m e s Co-operative Bacon
Factories
Cattle Exporting Socs Egg Collecting Centres Feedm? Stuffs Societies
Fertiliser Societies
% of Total N o of Farms
Represented
89 5
69 4 11 1 21 5 31 2
24 3
% of Total Livestock Eepresented
Pigs
Cattle Poulti y COWS Pigs Area
75 4 17 6 25 9 33 4
So 1