1
Running title: Brain rhythms and human vision 2
Revised manuscript to: International Journal of Psychophysiology 3
Date: 8th December 2010 4
5
Manuscript # CCD766 6
7
8
9
10
11
The role of oscillatory brain activity in object processing
12
and figure-ground segmentation in human vision
13
14
15
K. Kinseyab†, S.J. Andersona, A. Hadjipapasa and I.E. Hollidaya 16
a
School of Life and Health Sciences, Aston University, 17
The Wellcome Trust Laboratory for MEG Studies, Birmingham, B4 7ET, UK 18
b
School of Life and Health Sciences, Dept. of Psychology, University of the West of 19
England, Bristol, BS16, 1QY, UK 20
21
22
23
24
25
Correspondence: Dr K. Kinsey ([email protected]) 26
†
Current address: Department of Psychology, School of Life and Health Sciences, 27
University of the West of England, Frenchay Campus, Bristol, BS16 1QY, UK. 28
29
30
Figures: 6 31
Word count: 6347 (excluding references and figure captions) 32
Keywords: MEG, SAM, vision, object-recognition, gamma, figure-ground, binding 33
Abstract
35
The perception of an object as a single entity within a visual scene requires that its 36
features are bound together and segregated from the background and/or other objects. 37
Here, we used magnetoencephalography (MEG) to assess the hypothesis that coherent 38
percepts may arise from synchronized high frequency (gamma) activity between neurons 39
that code features of the same object. We also assessed the role of low frequency (alpha, 40
beta) activity in object processing. The target stimulus (i.e. object) was a small patch of a 41
concentric grating of 3 c/deg, viewed eccentrically. The background stimulus was either a 42
blank field or a concentric grating of 3 c/deg periodicity, viewed centrally. With patterned 43
backgrounds, the target stimulus emerged – through rotation about its own centre – as a 44
circular subsection of the background. Data were acquired using a 275-channel whole-45
head MEG system and analyzed using Synthetic Aperture Magnetometry (SAM), which 46
allows one to generate images of task-related cortical oscillatory power changes within 47
specific frequency bands. Significant oscillatory activity across a broad range of 48
frequencies was evident at the V1/V2 border, and subsequent analyses were based on a 49
virtual electrode at this location. When the target was presented in isolation, we observed: 50
(i) contralateral stimulation yielded a sustained power increase in gamma activity; (ii) both 51
contra- and ipsilateral stimulation yielded near identical transient power changes in alpha 52
(and beta) activity. When the target was presented against a patterned background, we 53
observed: (i) contralateral stimulation yielded an increase in high-gamma (> 55 Hz) power 54
together with a decrease in low-gamma (40-55 Hz) power; (ii) both contra- and ipsilateral 55
stimulation yielded a transient decrease in alpha (and beta) activity, though the reduction 56
tended to be greatest for contralateral stimulation. The opposing power changes across 57
different regions of the gamma spectrum with „figure/ground‟ stimulation suggest a 58
possible dual role for gamma rhythms in visual object coding, and provide general support 59
of the binding-by-synchronization hypothesis. As the power changes in alpha and beta 60
activity were largely independent of the spatial location of the target, however, we 61
conclude that their role in object processing may relate principally to changes in visual 62
attention. 63
1. Introduction 65
Although the primate brain contains over 30 distinct visual areas (Van Essen, 2004), we 66
experience a unified perceptual view of the world in the blink of an eye. How the brain 67
executes this feat of combining information across spatially separate areas with 68
millisecond precision, rendering our visual world stable and whole, remains an open 69
question. A solution to „the binding problem‟, as it has come to be known, is keenly sought 70
not only because it may lead to a significant increase in our understanding of visual 71
processing but also because it may provide some insight into consciousness itself (Crick, 72
1994). Assuming that activity in disparate cortical areas must be grouped at some stage of 73
processing – for it is difficult to imagine how a coherent percept could be achieved 74
otherwise – the choice of binding solutions appears limited to one based on hierarchical 75
processing and/or co-ordinated activity among distributed cortical areas. It is clear that 76
hierarchical processing must play some role in the formation of coherent percepts, for it is 77
known from the pioneering work of Hubel and Wiesel (1962, 1968) and others that large 78
sections of the visual system are organised in just such a manner. However, a binding 79
solution based entirely on hierarchical (feedforward) processing is not feasible as the 80
number of neurons required to process each unique view of every object would be 81
unacceptably large. Moreover, such a theory disregards the multitude of feedback 82
projections within the visual system that may be vital for the generation of global percepts 83
(Bullier, 2001; Halgren, Mendola, Chong, & Dale, 2003; Thielscher, Kolle, Neumann, 84
Spitzer, & Gron, 2008) 85
86
More recently, it has been hypothesized that coherent percepts may arise from 87
synchronized spike activity between neurons that code features of the same object. The 88
binding-by-synchronization model, which attributes roles to both feedforward and feedback 89
processes, has been advanced largely on the basis of animal studies (Eckhorn, et al., 90
1988; Gray & Singer, 1989; Kreiter & Singer, 1996; W Singer, 2007). Our goal in this paper 91
was to make use of the spatio-temporal resolution offered by the neuroimaging technique 92
of magnetoencephalography (MEG) to assess the synchronization model of object 93
processing in human vision. What follows is a brief overview of cortical oscillatory activity 94
and its possible role in neural binding, and a rationale for the protocols used in our study. 95
96
1.1 Cortical oscillations and visual binding 97
The cortical process whereby several object features are represented as a whole, 98
perceptual view of the world. Phenomenologically, this grouping and segregation is 100
described within a Gestalt framework as „figure-ground‟ perception. The binding-by-101
synchronization hypothesis holds that grouping and segmenting information operates 102
through a neural mechanism whereby visual features coded across distributed neuronal 103
assemblies are represented as components of a common object through synchronous 104
oscillatory firing patterns (Eckhorn, et al., 2004; Gail, Brinksmeyer, & Eckhorn, 2000; W. 105
Singer, 1999). For example, neurons in the visual cortex show synchronous firing activity 106
when coding for a single light bar moving across the visual field, but decouple into two 107
distinct synchronous assemblies when coding for two independent light bars (Engel, 108
Konig, & Singer, 1991). There is evidence that coding of this type is supported by activity 109
within the gamma (~30 – 90 Hz) frequency band (Tallon-Baudry & Bertrand, 1999; 110
Woelbern, Eckhorn, Frien, & Bauer, 2002). Gamma activity in particular has been studied 111
in both animals (Fries, Roelfsema, Engel, Konig, & Singer, 1997; Gail, et al., 2000; 112
Logothetis, Pauls, Augath, Trinath, & Oeltermann, 2001; Rols, Tallon-Baudry, Girard, 113
Bertrand, & Bullier, 2001; Siegel & Konig, 2003) and humans (Keil, Muller, Ray, Gruber, & 114
Elbert, 1999; Tallon-Baudry, 2003), and may play a defining role in feature integration 115
(Gray & McCormick, 1996), object recognition (Tallon-Baudry & Bertrand, 1999) and 116
selective attention (Fell, Fernandez, Klaver, Elger, & Fries, 2003). 117
118
Numerous studies have suggested that alpha rhythms (8 – 13 Hz) may also play a key role 119
in object processing and visual attention (Thut, Nietzel, Brandt, & Pascual-Leone, 2006; 120
Vanni, Revonsuo, Saarinen, & Hari, 1996; Worden, Foxe, Wang, & Simpson, 2000; 121
Yamagishi, Callan, Anderson, & Kawato, 2008; Yamagishi, et al., 2003; Yamagishi, Goda, 122
Callan, Anderson, & Kawato, 2005). Beta rhythms (13 – 30 Hz) may be important for 123
visuo-motor processing, including both real (Maratos, Anderson, Hillebrand, Singh, & 124
Barnes, 2007) and imagined (Neuper, Scherer, Wriessnegger, & Pfurtscheller, 2009) 125
interactions with objects. Recent evidence also provides strong support for the role of beta 126
rhythms in modulating general visual attention (Kinsey, et al., 2009; Maratos, et al., 2007). 127
128
1.2 Challenges to the binding-by-synchronization hypothesis 129
Despite much speculation on the importance of neural oscillatory synchrony for primate 130
vision, several reports question the functional significance of brain rhythms at any level of 131
processing (for a review, see Shadlen & Movshon, 1999). There are specific reports, 132
based on animal studies, that synchronized firing in a pair of neurons is not related to 133
organization of a scene (Lamme & Spekreijse, 1998). Others suggest that synchronized 135
activity may be minimal or absent altogether for processes related to both figure-ground 136
patterns (Craft, Schutze, Niebur, & von der Heydt, 2007) and drifting coherent plaid 137
patterns (Thiele & Stoner, 2003). Finally, an electroencephalographic study on humans 138
demonstrated that the striking perceptual differences between Gestalt and non-Gestalt 139
images were not accompanied by marked changes in gamma activity (Heinrich, Aertsen, & 140
Bach, 2002). The failure in several studies to find changes in oscillatory activity to figure-141
ground patterns calls into question the specific role played by oscillatory activity in 142
segregation and challenges the basis of the binding-by-synchronization hypothesis. 143
144
1.3 The current study 145
Our aim was to assess the viability of the binding-by-synchronization hypothesis and in 146
particular characterize the role gamma rhythms may play in segregating visual objects 147
from their background. We also sought to clarify further the role of low frequency (alpha, 148
beta) rhythms in object processing. 149
150
In earlier MEG work, we showed that gamma activity is modulated by low-level visual 151
features such as contrast and spatial frequency (Adjamian, Holliday, et al., 2004; Hall, et 152
al., 2005), and is maximal for high contrast gratings of 3 c/deg periodicity (Hadjipapas, 153
Adjamian, Swettenham, Holliday, & Barnes, 2007; Logothetis, et al., 2001). Recent 154
evidence shows that concentric gratings also induce strong gamma activity in the early 155
visual cortex (Hoogenboom, Schoffelen, Oostenveld, Parkes, & Fries, 2006). A wide range 156
of stimuli yield power changes in alpha and beta within early visual cortex, including 157
grating patterns (Maratos et al., 2007). We utilized all these findings in designing our target 158
and background visual stimuli. Using MEG and functional magnetic resonance imaging 159
(fMRI) retinotopic mapping, we reliably identified visual areas associated with rhythmic 160
activity (alpha, beta and gamma) in the ventral cortex at the border of areas V1 and V2, 161
and based our analyses on virtual electrodes at this position. 162
163
164
2. Method 165
2.1. Participants 166
Twelve participants (six male and six female, aged 25 – 40 years) with no history of 167
neurological or psychiatric disorders were recruited. All participants had normal or 168
consent of each subject, received local ethical committee approval and conformed to the 170
Code of Ethics of the World Medical Association (Declaration of Helsinki). 171
172
2.2. Procedure and stimuli 173
All stimuli were displayed on a Dell LCD monitor at a frame rate of 60 Hz, with a resolution 174
of 1024 lines by 768 pixels, using Presentation software (http://www.neurobs.com/) that 175
also delivered coded stimulus identification and synchronization pulses to the MEG 176
recording equipment. 177
178
Both non-patterned and patterned background stimuli were used. The non-patterned 179
background consisted of a uniform blank (black) screen. The patterned background 180
consisted of an achromatic circular square-wave grating of 3 c/deg periodicity and 95% 181
contrast, confined within a hard-edged circular window of 12.5 deg viewing angle. The 182
concentric rings of the background pattern were centred on the fixation point. The target 183
stimulus (i.e. object or figure) was a circular sub-section of the background pattern, and 184
subtended 5.5 deg of viewing angle. The centre of the target patch was presented 3.125 185
deg either to the left or right of fixation. Note that the target was distinguishable from the 186
patterned background only when rotated about its own centre. Figure 1 shows examples of 187
the stimuli as they appeared in the experiment, plus stimulus icons that are used in this 188
paper to guide understanding of the results. 189
190
A central fixation point remained on-screen throughout the experiment, and participants 191
were instructed to maintain fixation throughout each trial. The stimulus presentation 192
sequence on each trial, depicted in Fig. 1 using icons, was as follows: (a) the target patch 193
was presented to the right (left) of fixation for two seconds, initially rotating anticlockwise 194
about its centre at 20 deg/sec for one second, then clockwise for one second, returning to 195
its original position; (b) the screen was blank for two seconds; (c) the patterned 196
background, centred on the fixation point, was presented for two seconds; (d) the target 197
patch appeared to the right (left) of fixation against the patterned background for two 198
seconds, following the same rotational movement sequence as in the initial two second 199
period of the trial – note that a circular contour was visible throughout the target‟s rotation 200
sequence but that in its original and final position the target was indistinguishable from the 201
background; (e) the patterned background was visible for a further two seconds following 202
the disappearance of the target patch. The inter-trial interval was 2 seconds, during which 203
was repeated 120 times, alternating between left- and right-lateralized target 205
presentations. 206
207
--- 208
Figure 1 near here 209
--- 210
211
2.3. MEG co-registration, recording and pre-processing 212
Continuous MEG data were acquired using a 275-channel whole-head MEG system (from 213
VSM MedTech Ltd, Port Coquitlam, BC, Canada). The sampling rate was 1200 Hz. The 214
data were baseline-corrected and an anti-aliasing filter with a cut-off of 200 Hz was used. 215
Third-order gradiometers and a low-pass filter of 100 Hz were applied, and notch filters 216
(width 2 Hz) at both 50 Hz and 60 Hz were used to remove any signal artefacts arising 217
from power lines and the display monitor. Participants sat upright in a magnetically 218
shielded room and viewed the display monitor (located outside the room) in a front-silvered 219
mirror (located within the room) through a small window in the room. The optical viewing 220
distance was 2.1 m. Participants wore a headband with three electromagnetic coils 221
attached to it. Following data acquisition, a Polhemus Isotrak 3D digitizer was used to map 222
the surface shape of each participant‟s head and localise the head coils with respect to 223
that surface. This surface was matched to the head shape extracted from MRI scans of 224
each participant (see Adjamian, Barnes, et al., 2004 for details), enabling co-registration of 225
MEG and MRI data to form a functional brain image. 226
227
2.4. Synthetic aperture magnetometry (SAM) ‘virtual electrodes’ (VEs) 228
A spatial filtering („beamformer‟) technique known as synthetic aperture magnetometry 229
(SAM) (Hall, et al., 2005; Hillebrand & Barnes, 2005; Hillebrand, Singh, Holliday, Furlong, 230
& Barnes, 2005; Kinsey, et al., 2009; Robinson & J, 1999; Singh, Barnes, Hillebrand, 231
Forde, & Williams, 2002; Van Veen, van Drongelen, Yuchtman, & Suzuki, 1997) was used 232
to generate statistical parametric maps (SPMs) of stimulus or event-related changes in 233
signal power (Pfurtscheller & Lopes da Silva, 1999). In brief, SAM is based on a 234
constrained minimum-variance beamformer that allows for localized time series 235
reconstruction of multiple uncorrelated induced signal sources in the brain. An optimal 236
spatial filter for the 30-90 Hz frequency band – nominally the gamma band – over „active‟ 237
(post-stimulus from zero to 1.5 s) and „passive‟ (pre-stimulus from -1.5 s to zero) time 238
(Van Veen, et al., 1997). The output of the beamformer is an estimate of the neuronal 240
activity at each computed location and is referred to as the “virtual electrode” (VE), 241
assessed using a pseudo-t statistic (Robinson & J, 1999). In our analysis, beamformer 242
estimates were calculated throughout the brain volume on a 5x5x5 mm grid of points. This 243
output was co-registered with each individual‟s MRI and then into standard MNI space 244
using SPM99 (http://www.fil.ion.ucl.ac.uk/spm/snpm/). 245
246
SAM beamformer estimates for comparisons within the 30-90 Hz frequency range were 247
made between the baseline condition (fixation only) and the target condition for both left 248
and right visual field locations of the target patch. The results of this analysis (Fig. 2) show 249
focal increases in gamma at the occipital poles in contralateral hemispheres. The locations 250
of peak gamma activation in each hemisphere were chosen for subsequent time-frequency 251
analysis (see Table 1), and participants were excluded from further analyses if activations 252
in each hemisphere did not reach a pre-specified t-value of 3.0 (which approximates a p-253
value of 0.001). The time course of oscillatory power changes within both the left- and 254
right-hemisphere VEs for each participant and for each condition was examined using a 255
Morlet-wavelet time-frequency analysis. The spectrograms were computed using a scale 256
of seven cycles per wavelet. This scale gives a satisfactory balance between time and 257
frequency resolutions, and is typically used in MEG analyses using Morlet wavelet 258
decomposition (Gruber, Maess, Trujillo-Barreto, & Muller, 2008). The resulting 259
spectrograms were averaged across participants to create group-averaged spectrograms 260
for each hemisphere and for each experimental condition. Note that visual inspection of 261
the single-trial data in sensor space did not identify signal artefacts in the recordings, and 262
no epochs were removed for further analysis in source space. Note also that the SAM 263
beamformer actively suppresses any undetected noise or artefact sources that may have 264
occurred in spatially removed locations, such as the eyes. This is so because the lead 265
field patterns typically generated at the target source (occipital) are uncorrelated with those 266
generated at the noise source (ocular) (for further discussion on SAM suppression and 267
orthogonal lead field relationships between sources, see Brookes, et al., 2008; Brookes, et 268
al., 2009). However, further indication that activity in the occipital VEs did not include 269
noise contamination from the eyes was evident in that SAM images did not show 270
significant patterns of ocular activity in the 30-90 Hz frequency band across 271
trials (Bardouille, Picton, & Ross, 2006). 272
273
275
Both induced and evoked activity was assessed. Evoked activity is tightly phase-locked to 276
the stimulus whereas induced activity is not. To reveal the level of induced (plus evoked) 277
activity, spectrograms were created from single-trial activation waveforms for a given VE 278
and from these an average time–frequency spectrogram was created. To demarcate 279
evoked activity, time–frequency spectrograms were created from the average of the 280
activation waveforms for each VE. The induced spectrograms show percentage change in 281
energy per time–frequency bin relative to the pre-stimulus interval (T = -2 s to zero). The 282
evoked spectrograms show amplitude change per time–frequency bin relative to the 283
baseline (computed over T = -2 s to zero). Statistical significance of the changes was 284
assessed using bootstrap analysis (Graimann, Huggins, Levine, & Pfurtscheller, 2002) and 285
only changes that were significant at p < 0.05 are displayed in the results (see Fig. 5). 286
287
The statistical significance of the spectrogram results was assessed across participants by 288
first setting the value of each time-frequency point where p < 0.05 to p = 0.05, yielding a 289
conservative binary statistical significance time-frequency map for each participant. The 290
combined p-value for each time-frequency point across participants was then calculated as 291
292
Eq. 1 293
294
where n is the number of probability values to be combined (n = 7) and k = P1 * P2....*Pn 295
is the product of the individual probabilities at each time-frequency point. Equation 1 is the 296
n-dimensional extension of Fisher's test (Fisher, 1932), provided by l. Jost 297
(http://www.loujost.com/Statistics%20and%20Physics/Significance%20Levels/CombiningP 298
Values.htm). Calculated p-values were set equal to 1.0 if p > 0.001, and the resulting 299
statistical significance map is given in Fig. 6, showing all time-frequency points with 300
significant activation (p < 0.001) at the group level. 301
302
2.5 FMRI retinotopic mapping 303
To aid identification of functional MEG sources in the brain, functional boundaries within 304
the early visual cortex were identified using the retinotopic mapping paradigm of Sereno et 305
3T MR scanner (from Magnetom Trio, Siemens, Erlangen, Germany) using a gradient-307
echo, echo-planar (EPI) sequence (slices = 44; TR = 3000 ms; TE = 30 ms; flip angle = 90 308
deg; voxel size = 2.5 x 2.5 x 2.5 mm). High-resolution (1 x 1 x 1 mm) anatomical scans 309
(MP-RAGE, Siemens) were obtained for MEG data co-registration and statistical 310
parametric mapping. Cortical surface reconstruction and retinotopic mapping analyses 311
were completed using the Freesurfer analysis software 312
(http://surfer.nmr.mgh.harvard.edu/fswiki/Home). Data from the eccentricity and polar 313
angle scans were combined to generate maps that show visual regions coded for 314
successive mirror image and non-mirror image representations of the retinotopic 315
projections anticipated anatomically. Visual areas V1 and V2 were identified as described 316
in previous studies (Tootell, et al., 1997). 317
318
319
3. Results 320
3.1. Cortical localization of gamma activity 321
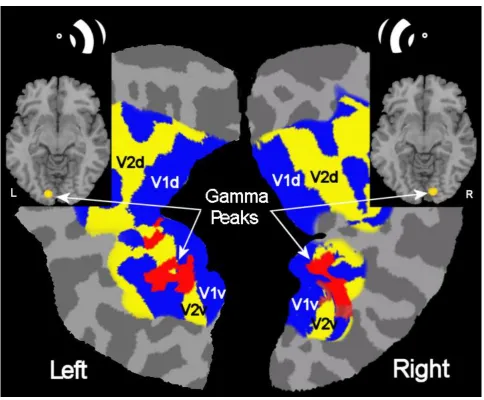
Figure 2 shows the borders of the primary and secondary visual areas on flattened cortical 322
maps, as identified in a single participant (P1) using a standard fMRI retinotopic mapping 323
procedure (Sereno et al., 1995). Overlaid in red are the areas where maximal gamma 324
band activity (30 – 90 Hz) was detected (pseudo-t > 3.0) using SAM from MEG responses 325
to the target (figure) patches presented against a blank background in either the left or 326
right visual field (i.e. from the initial two second period of each trial; see Fig. 1). 327
Corresponding sites of gamma activity between the flattened maps and axial brain slices 328
are indicated by arrows. Note that hemifield stimulation resulted in significant (pseudo-t > 329
3.0) contralateral gamma activity within the ventral cortex at the V1/V2 border in seven 330
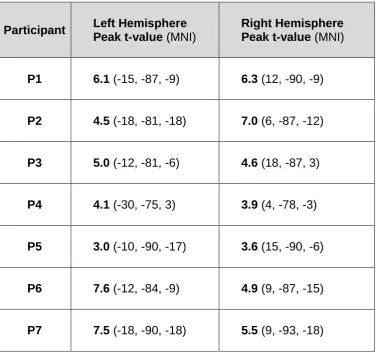
participants. Table 1 shows the MNI co-ordinates of peak gamma activity (t > 3.0) for each 331
of these participants. MEG activity in subsequent figures is estimated for these locations. 332
333 334
--- 335
Figure 2 and Table 1 near here 336
--- 337
338 339
3.2. Cortical dynamics during figure-ground segregation 340
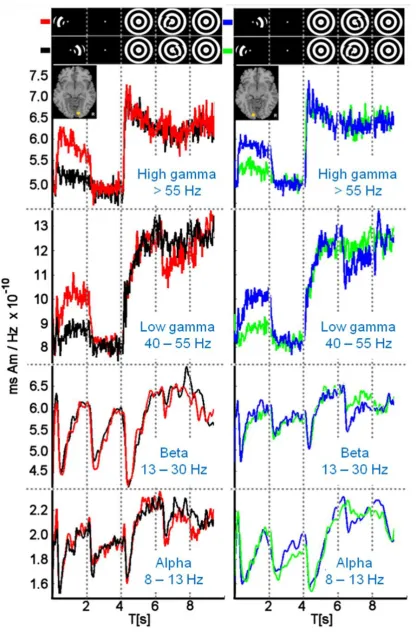
Figure 3 shows the group-averaged (n = 7) time course of oscillatory power changes, 341
activity was recorded in each participant for each cortical hemisphere (from Fig. 2 and 343
Table 1). Mean response power (rms Am/Hz) is plotted as a function of time (s), with the 344
different periods of the trial demarcated by vertical dotted lines. The icons at the top of the 345
figure indicate the presence (absence) and spatial arrangement of the target and 346
background for each period (see also Fig. 1). The red (black) traces show the responses 347
obtained with the target positioned in the left (right) visual field, contralateral (ipsilateral) to 348
the VE. The blue (green) traces show the responses obtained with the target positioned in 349
the right (left) visual field, contralateral (ipsilateral) to the VE. Details are reported below 350
for each frequency band. 351
352
--- 353
Figure 3 near here 354
--- 355
356
357
3.2.1 High gamma frequency band (> 55 Hz) 358
Target presentation against a blank background (at T = 0 s) resulted in a rapid 359
contralateral power increase in high frequency gamma, sustained until the target‟s 360
disappearance at T = 2 s (red/blue traces). Ipsilateral target presentation had little effect 361
on high gamma during this time period (black/green traces). Disappearance of the target at 362
T = 2 s resulted in a sustained reduction in gamma. From T = 2 – 4 s, where only the 363
fixation target was visible, the magnitude of gamma power was the same in each 364
hemisphere. Presentation of the centrally-viewed background grating at T = 4 s resulted in 365
another rapid rise in gamma within both hemispheres. Although not evident in Fig. 3, 366
during the critical period of the trial from T = 6 – 8 s, when the target was presented 367
against a patterned background, high frequency gamma activity for contralateral targets 368
exceeded that for ipsilateral targets (between approx. 6.25 s and 7.0 s). This effect can be 369
seen in the significance maps of Fig. 4 (discussed below). 370
371
3.2.2 Low Gamma frequency band (40 – 55 Hz) 372
The pattern of results for low gamma band activity was broadly similar to that for high 373
gamma activity. The notable exception was during the critical period from T = 6 – 8 s, 374
when the target was presented against a patterned background. Between approximately 375
less than that for ipsilateral targets (black/green traces). This is also evident in Fig. 4 377
(discussed below). 378
379
3.2.3 Beta frequency band (13 – 30 Hz) 380
Unlike the sustained change in gamma activity to the appearance of the target in isolation 381
at T = 0 s, or its disappearance at T = 2 s, power changes within the beta band were more 382
transitory in nature. Also unlike the results reported above for gamma, beta activity within 383
the initial two periods of each trial was independent of the spatial location of the target; i.e. 384
both contra- and ipsilateral targets yielded indistinguishable power changes within each 385
hemisphere from T = 0 – 4 s. The appearance of the background at T = 4 s also produced 386
indistinguishable contra- and ipsilateral responses. During the critical trial period from T = 387
6 – 8 s, when the target was presented against the patterned background, both contra- 388
and ipsilateral stimulation yielded a decrease in beta at about 6.5 s, though the reduction 389
tended to be greatest for contralateral stimulation (red/blue traces). The latter was more 390
evident for the left hemisphere VE than for the right hemisphere VE. 391
392
3.2.4 Alpha frequency band (8 – 13 Hz) 393
The pattern of changes in alpha band activity was qualitatively similar to that reported 394
above for beta activity across each trial period. 395
396
Figure 4 shows, for each cortical hemisphere, a group-averaged (n = 7) significance map 397
(Mann-Whitney-Wilcoxon test, p < 0.05, corrected significance) of the differences between 398
the time-frequency responses for contra- and ipsilateral targets during the „figure-ground‟ 399
trial period from T = 6 – 8 s: red (blue) indicates a relative increase (decrease) in power for 400
contralateral targets. The location of the VE within each hemisphere is shown on the axial 401
brain slice at the top of each panel (see also Fig. 2, Table 1). Each map therefore shows 402
significant power differences between the responses obtained for the „figure-ground‟ 403
stimulus versus the background pattern alone. Three main effects were observed: (i) in 404
each cortical hemisphere there was a relative increase in high-gamma power, beginning 405
shortly after the onset of the target (across 6.25 – 6.75 s in the right hemisphere, Box a; 406
and across 6.25 – 7.0 s in the left hemisphere, Box b); (ii) in each hemisphere there was a 407
relative decrease in low-gamma power from approximately 6.2 – 6.9 s (Box c, Box d); and 408
(iii) in the left cortical hemisphere there was a relative decrease in both alpha and beta 409
power centred at approximately T = 6.5 s (Box e). Note that the increase in gamma 410
(see Fig. 3, T = 0 – 2 s), whereas the relative changes in gamma associated with the onset 412
of the target against a patterned background lasted 0.5 – 0.75 s. 413
414
--- 415
Figure 4 near here 416
--- 417
418
419
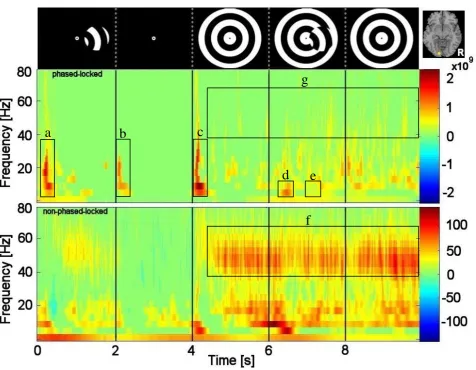
3.3 Evoked versus induced responses 420
Figure 5 shows the time–frequency plots for activity at the V1/V2 border in the left 421
hemisphere (from Fig. 2) for a single representative participant, depicting both evoked 422
activity (top panels) and induced-plus-evoked activity (bottom panels). The time axis is 423
partitioned into the five components of the stimulus presentation cycle, as indicated by the 424
icons at the top of the figure. The red/blue colour scales represent significant (p < 0.05) 425
changes in amplitude (evoked spectrograms) or energy (induced-plus-evoked 426
spectrograms). Note that evoked activity was confined to the alpha/beta frequency range 427
and was transient in nature. It was most evident shortly after the onset of the target in 428
isolation (at T = 0 s, Box a), at the offset of the target (at T = 2 s, Box b), and again shortly 429
after the onset of the background pattern (at T = 4 s, Box c). At the onset of the figure (T = 430
6 s), there is evidence of a small amount of evoked activity confined to the alpha frequency 431
region (Box d). Note, however, there is no evoked activity at the time of motion reversal (T 432
= 7 s, Box e). The spectral power changes evident within the gamma frequency range in 433
the induced-plus-evoked spectrograms (Box f) were not reflected in the evoked 434
spectrograms (Box g). This same pattern of results is reflected in the group-averaged (n = 435
7) significance maps (p < 0.01) of power changes (see Fig. 6). This indicates that the 436
gamma activity we observed in this study must reflect induced activity, which is consistent 437
with previous studies (Adjamian, Holliday, et al., 2004; Hadjipapas, et al., 2007; Hall, et al., 438
2005; Muthukumaraswamy, Singh, Swettenham, & Jones, 2009). 439
440
--- 441
Figures 5 and 6 near here 442
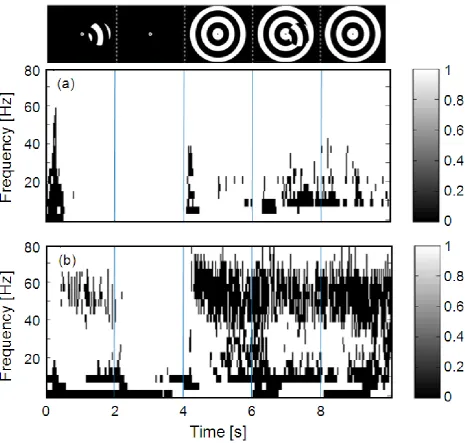
--- 443
From Figs. 5 and 6, note also that there is a marked decrease in alpha/beta activity shortly 445
after the start of each time frame (i.e. near 0.5 s, 2.5 s, and 4.5 s), consistent with the 446
fluctuations evident in alpha/beta power shown in the group data of Fig. 3. 447
448
449
4. Discussion 450
Our goal was to characterise the role brain rhythms may play in object processing and in 451
segregating an object from its background. Using MEG we identified a region within each 452
hemisphere at the border of areas V1 and V2 where robust oscillatory activity was evident 453
during the perception of a grating patch (our target object). Data analyses using synthetic 454
aperture magnetometry were conducted for a virtual electrode placed at this location. 455
456
MEG responses to the target stimulus varied depending on whether it was presented 457
against a uniform or patterned background. When the target was presented against a 458
uniform background, striking differences were apparent between the response profiles for 459
low- (alpha and beta) and high-frequency (gamma) activity. We observed sustained power 460
changes in gamma but transitory power changes in alpha and beta (see Fig. 3 for the trial 461
period T = 0 – 2 s). Further, the changes in gamma were only evident within the 462
contralateral hemisphere, whereas the power changes in alpha and beta were evident 463
within both contralateral and ipsilateral hemispheres (Fig. 3, T = 0 – 2 s). The dependence 464
of gamma on the spatial location of the target provides support for its putative role in visual 465
object coding (e.g. Adjamian et al., 2004; Hall et al., 2005). However, because the power 466
changes in alpha and beta were independent of target location, we conclude that their 467
presence may signify a more general role in object processing, perhaps related to 468
attentional mechanisms (see also Maratos et al., 2007). 469
470
Assessment of the MEG responses to target stimuli presented against a patterned 471
background were analyzed to determine the role of cortical oscillations in „figure-ground‟ 472
processing. These results relate to the critical trial period from T = 6 – 8 s (see Figs. 3 - 6), 473
and are discussed below for both high- and low-frequency oscillatory activity. 474
475
4.1 High frequency activity (> 40 Hz) 476
Appearance of the target against a patterned background yielded, within the same brain 477
volume, an increase in high-gamma (> 55 Hz) power accompanied by a decrease in low-478
activity (Figs. 5, 6). Such changes could be consequent upon a shift in gamma to a range 480
of higher frequencies, a phenomenon that has been noted to occur immediately following 481
the onset of grating patterns (Hall et al., 2005). However, in this study we found no 482
evidence for an upward shift of the gamma frequency range following the onset of our 483
target patch (see Fig. 5, panel T = 6 – 8 s). 484
485
The role of gamma rhythms in figure-ground segregation is hypothesised to result from 486
one or two general processes: (i) region labelling, achieved by labelling corresponding 487
elements in an isomorphic surface representation (Lamme, 1995); and/or (ii) border 488
ownership coding, achieved through contour representation following the activity of 489
orientation-selective units (Craft, et al., 2007). These different schemes may explain the 490
opposing power changes in gamma reported here. While opposing power changes in 491
gamma within the same visual area have not been reported before, we note that previous 492
studies on figure-ground segregation have reported either increases (Lamme, 1995; 493
Zipser, Lamme, & Schiller, 1996) or decreases (Gail et al., 2000) in gamma activity. 494
Evidence from previous experimental work, together with theoretical arguments on the 495
nature of brain rhythms, suggest that increases in gamma may relate to the process of 496
region labelling whereas decreases in gamma may relate to the process of border 497
ownership. For example, studies on figure-ground coding in monkey V1 have reported 498
enhanced spike rates within an object‟s surface representation (Lamme, 1995; Zipser, et 499
al., 1996). On the other hand, multi-unit cellular recording in non-human primates showed 500
strong decoupling of population activity across a figure/ground border (Gail, et al., 2000). 501
The latter is supported by Eckhorn et als. (2004) model, where power decreases in 502
gamma observed in figure-background segregation stem from orientation-defined contours 503
disrupting lateral coupling connections between neurons. Thus, segregation of the figure 504
and background stimuli may depend on the coding of border ownership (Craft, et al., 505
2007). 506
507
Power increases in high frequency gamma may also represent attentional changes in 508
response to global motion onset. In a recent study examining motion processing and 509
oscillatory activity (Swettenham, Muthukumaraswamy, & Singh, 2009), significant power 510
increases in high frequency gamma were reported for moving gratings, while changes in 511
low frequency gamma were associated with static stimuli. Similarly, Siegel et al. (2007) 512
concluded from their data that high frequency gamma (60-100 Hz) was specific for coding 513
power increases in high frequency gamma we observed may represent specific coding for 515
the motion component of the figure (i.e. the figure‟s slow rotation clockwise/anticlockwise – 516
see Methods). However, we note that no increase in gamma was evident on reversal of 517
the figure‟s rotational motion at T = 7 s (Fig. 4), where the motion transient was greatest. 518
519
Modulation of cortical oscillations within a brain region can either be stimulus driven or in 520
response to feedback from higher-order cortical areas. While some have argued that 521
feature segmentation and grouping occurs automatically and pre-attentively (Scholte, 522
Witteveen, Spekreijse, & Lamme, 2006), other have shown that gamma activity is strongly 523
identified with attentional mechanisms (Halgren, et al., 2003; Herrmann & Mecklinger, 524
2000; Kaiser, Buhler, & Lutzenberger, 2004; Vidal, Chaumon, O'Regan, & Tallon-Baudry, 525
2006). One hypothesis is that top-down effects support segregation and grouping of visual 526
features. For example, lesions in the dorsal extra-striate area (Super & Lamme, 2007) and 527
anaesthesia (Lamme, Zipser, & Spekreijse, 1998) can reduce the figure-ground effect. 528
Moreover, functional imaging studies suggest that higher visual areas such as V4 may 529
contribute to texture segmentation as well as illusory contour detection (Kastner & 530
Ungerleider, 2001; Mendola, Dale, Fischl, Liu, & Tootell, 1999). As suggested by Qiu, 531
Sugihara and von der Heydt (2007), such attentional mechanisms associated with figure-532
ground segregation are independent of border ownership coding but interact with signal 533
neurons in area V2. From our data (Fig. 4), the late occurrence of gamma changes (~250 534
ms after target onset) in the V1/V2 region supports the notion that feedback from higher 535
cortical areas is important for figure-ground segregation. 536
537
4.2 Low frequency activity (< 40 Hz) 538
The origin of low frequency rhythms and their role in information processing both within 539
and between brain areas continue to be debated. Historically, the alpha rhythm (8 – 13 Hz) 540
has received the most interest. The standard view is that large-amplitude alpha 541
characterizes an idling cortical network (Adrian & Matthews, 1934; Pfurtscheller, 2001; 542
Pfurtscheller, Stancak, & Neuper, 1996). However, some studies provide evidence for 543
task-dependent increases in alpha (Jensen, Gelfand, Kounios, & Lisman, 2002; Klimesch, 544
1999; Worden, et al., 2000). In a series of studies, Yamagishi et al. (2008; 2003; 2005) 545
suggested that increased alpha in the calcarine may serve to enhance the efficiency of 546
processing information related to the visual stimulus, and that power changes in alpha 547
(both increases and decreases) may be an integral part of the neuronal operations 548
provide evidence that power changes in alpha may also be important for controlling 550
interactions between brain regions (also see Hummel, Andres, Altenmuller, Dichgans, & 551
Gerloff, 2002; Mima, Oluwatimilehin, Hiraoka, & Hallett, 2001; Pfurtscheller & Lopes da 552
Silva, 1999; Sauseng, et al., 2005; Thut, et al., 2006; Worden, et al., 2000; Yamagishi, et 553
al., 2005). 554
555
The functional role of low frequency oscillatory activity in figure-background segregation 556
has largely been unexplored. In our study, we observed that, unlike the sustained changes 557
in gamma to the appearance and disappearance of stimuli, power changes within alpha 558
and beta were of a transitory nature (Figs. 3 & 4). These results are broadly consistent 559
with Van der Togt‟s (2006) EEG study, which showed that enhanced low frequency activity 560
(< 20 Hz) prior to stimulus onset was followed by a decrease in activity post-stimulus 561
onset, results that were interpreted within the context of attentional modulations. Indeed, 562
previous work has demonstrated a link between gamma binding and attentional 563
mechanisms linked to activity within the alpha frequency band (Ward, 2003). 564
565
Perhaps the most striking difference we observed between high- (gamma) and low-566
frequency (alpha/beta) activity was the dependence or not on the spatial location of the 567
target. Unlike the results for gamma, power changes in alpha and beta were independent 568
of the spatial location of the target when it was presented against a blank background 569
(compare gamma activity with alpha/beta activity in Fig. 3 for T = 0 – 2 s). And again 570
during the critical trial period, when the target was presented against a patterned 571
background, both contralateral and ipsilateral stimulation yielded reductions in alpha and 572
beta (see Fig. 3 for T ~ 6.5 s). Although the reduction in alpha/beta was greatest for 573
contralateral stimulation, the difference only reached significance for the left hemisphere 574
(Fig. 4). It should be noted however that the amplitude of the alpha/beta responses 575
reported here may be sub-optimal as the low frequency activity was estimated for a 576
location of interest defined by peak gamma activity (namely at the V1/V2 border). This was 577
unavoidable if we were to satisfy our aim of comparing response profiles of different 578
oscillatory rhythms within the same brain area. Nonetheless, we note that our amplitude 579
measures for alpha/beta are similar to those reported using VEs optimally positioned for 580
low frequency activity (Maratos et al., 2007). 581
582
In summary, although the changes in gamma activity at the V1/V2 border appear directly 583
not discounting a possible role in figure-ground segregation, we concur with other studies 585
that the principal role of alpha and beta rhythms in object processing may relate more to 586
changes in visual attention. The role of gamma, on the other hand, is much more tightly 587
bound to the figural properties of the visual stimulus. Notably, gamma is modulated by the 588
emergence of the figure against the patterned background, when presumably large 589
numbers of neurones are already strongly activated by the background itself. The spatial 590
frequency and contrast of the target are equal to the background and consequently the 591
gamma modulation we observed cannot be a consequence of gross changes in the 592
incoming sensory projection to the cortex, as might be the case when the target appears in 593
isolation (i.e. against a uniform background). Therefore, we assume our results reflect 594
processing of figural information within the cortex, at a stage following the initial projection 595
of information from the LGN. This conclusion is supported by our results showing an 596
absence of evoked gamma activity linked to the onset of the figure (Fig. 5, Box g at T = 6 597
s; Fig. 6), as evoked activity is often linked to this early stage processing. 598
References 600
Adjamian, P., Barnes, G. R., Hillebrand, A., Holliday, I. E., Singh, K. D., Furlong, P. L., et al. 601
(2004). Co-registration of magnetoencephalography with magnetic resonance imaging using 602
bite-bar-based fiducials and surface-matching. Clin Neurophysiol, 115(3), 691-698. 603
Adjamian, P., Holliday, I. E., Barnes, G. R., Hillebrand, A., Hadjipapas, A., & Singh, K. D. (2004). 604
Induced visual illusions and gamma oscillations in human primary visual cortex. Eur J 605
Neurosci, 20(2), 587-592. 606
Adrian, E. D., & Matthews, B. H. C. (1934). The Berger rhythm: potential changes from the 607
occipital lobes in man. Brain, 57(355). 608
Bardouille, T., Picton, T. W., & Ross, B. (2006). Correlates of eye blinking as determined by 609
synthetic aperture magnetometry. Clin Neurophysiol, 117(5), 952-958. 610
Brookes, M. J., Stevenson, C. M., Hadgipapas, A., Barnes, G. R., Mullinger, K. J., Bagshaw, A. P., 611
et al. (2008). Beamformer Imaging and Interference Rejection. In R. Kakigi, K. Yokosawa 612
& S. Kuriki (Eds.), Boimagnetism. Interdisiplinary research and exploration (pp. 62-64): 613
Hokkaido University Press. 614
Brookes, M. J., Vrba, J., Mullinger, K. J., Geirsdottir, G. B., Yan, W. X., Stevenson, C. M., et al. 615
(2009). Source localisation in concurrent EEG/fMRI: applications at 7T. Neuroimage, 45(2), 616
440-452. 617
Bullier, J. (2001). Integrated model of visual processing. Brain Res Brain Res Rev, 36(2-3), 96-107. 618
Craft, E., Schutze, H., Niebur, E., & von der Heydt, R. (2007). A neural model of figure-ground 619
organization. J Neurophysiol, 97(6), 4310-4326. 620
Crick, F. (1994). The Astonishing Hypothesis. London: Simon and Schuster. 621
Dong, Y., Mihalas, S., Qiu, F., von der Heydt, R., & Niebur, E. (2008). Synchrony and the binding 622
problem in macaque visual cortex. J Vis, 8(7), 30 31-16. 623
Eckhorn, R., Bauer, R., Jordan, W., Brosch, M., Kruse, W., Munk, M., et al. (1988). Coherent 624
oscillations: a mechanism of feature linking in the visual cortex? Multiple electrode and 625
correlation analyses in the cat. Biol Cybern, 60(2), 121-130. 626
Eckhorn, R., Gail, A., Bruns, A., Gabriel, A., Al-Shaikhli, B., & Saam, M. (2004). Neural 627
mechanisms of visual associative processing. Acta Neurobiol Exp (Wars), 64(2), 239-252. 628
Engel, A. K., Konig, P., & Singer, W. (1991). Direct physiological evidence for scene segmentation 629
by temporal coding. Proc Natl Acad Sci U S A, 88(20), 9136-9140. 630
Fell, J., Fernandez, G., Klaver, P., Elger, C. E., & Fries, P. (2003). Is synchronized neuronal gamma 631
activity relevant for selective attention? Brain Res Brain Res Rev, 42(3), 265-272. 632
Fisher, R. A. (1932). Statistical Methods for Research Workers. Edinburgh: Oliver and Boyd. 633
Fries, P., Roelfsema, P. R., Engel, A. K., Konig, P., & Singer, W. (1997). Synchronization of 634
oscillatory responses in visual cortex correlates with perception in interocular rivalry. Proc 635
Natl Acad Sci U S A, 94(23), 12699-12704. 636
Gail, A., Brinksmeyer, H. J., & Eckhorn, R. (2000). Contour decouples gamma activity across 637
texture representation in monkey striate cortex. Cereb Cortex, 10(9), 840-850. 638
Graimann, B., Huggins, J. E., Levine, S. P., & Pfurtscheller, G. (2002). Visualization of significant 639
ERD/ERS patterns in multichannel EEG and ECoG data. Clin Neurophysiol, 113(1), 43-47. 640
Gray, C. M., & McCormick, D. A. (1996). Chattering cells: superficial pyramidal neurons 641
contributing to the generation of synchronous oscillations in the visual cortex. Science, 642
274(5284), 109-113. 643
Gray, C. M., & Singer, W. (1989). Stimulus-specific neuronal oscillations in orientation columns of 644
cat visual cortex. Proc Natl Acad Sci U S A, 86(5), 1698-1702. 645
Gruber, T., Maess, B., Trujillo-Barreto, N. J., & Muller, M. M. (2008). Sources of synchronized 646
induced Gamma-Band responses during a simple object recognition task: a replication study 647
Hadjipapas, A., Adjamian, P., Swettenham, J. B., Holliday, I. E., & Barnes, G. R. (2007). Stimuli of 649
varying spatial scale induce gamma activity with distinct temporal characteristics in human 650
visual cortex. Neuroimage, 35(2), 518-530. 651
Halgren, E., Mendola, J., Chong, C. D., & Dale, A. M. (2003). Cortical activation to illusory shapes 652
as measured with magnetoencephalography. Neuroimage, 18(4), 1001-1009. 653
Hall, S. D., Holliday, I. E., Hillebrand, A., Singh, K. D., Furlong, P. L., Hadjipapas, A., et al. 654
(2005). The missing link: analogous human and primate cortical gamma oscillations. 655
Neuroimage, 26(1), 13-17. 656
Heinrich, S. P., Aertsen, A., & Bach, M. (2002). Striking Gestalt modulates EEG gamma activity - 657
but not in accordance with the temporal binding hypothesis. Journal of Vision, 2(7), 230a. 658
Herrmann, C. S., & Mecklinger, A. (2000). Magnetoencephalographic responses to illusory figures: 659
early evoked gamma is affected by processing of stimulus features. Int J Psychophysiol, 660
38(3), 265-281. 661
Hillebrand, A., & Barnes, G. R. (2005). Beamformer analysis of MEG data. Int Rev Neurobiol, 68, 662
149-171. 663
Hillebrand, A., Singh, K. D., Holliday, I. E., Furlong, P. L., & Barnes, G. R. (2005). A new 664
approach to neuroimaging with magnetoencephalography. Hum Brain Mapp, 25(2), 199-665
211. 666
Hoogenboom, N., Schoffelen, J. M., Oostenveld, R., Parkes, L. M., & Fries, P. (2006). Localizing 667
human visual gamma-band activity in frequency, time and space. Neuroimage, 29(3), 764-668
773. 669
Hubel, D. H., & Wiesel, T. N. (1962). Receptive fields, binocular interaction and functional 670
architecture in the cat's visual cortex. J Physiol, 160, 106-154. 671
Hubel, D. H., & Wiesel, T. N. (1968). Receptive fields and functional architecture of monkey striate 672
cortex. J Physiol, 195(1), 215-243. 673
Hummel, F., Andres, F., Altenmuller, E., Dichgans, J., & Gerloff, C. (2002). Inhibitory control of 674
acquired motor programmes in the human brain. Brain, 125(Pt 2), 404-420. 675
Jensen, O., Gelfand, J., Kounios, J., & Lisman, J. E. (2002). Oscillations in the alpha band (9-12 676
Hz) increase with memory load during retention in a short-term memory task. Cereb Cortex, 677
12(8), 877-882. 678
Kaiser, J., Buhler, M., & Lutzenberger, W. (2004). Magnetoencephalographic gamma-band 679
responses to illusory triangles in humans. Neuroimage, 23(2), 551-560. 680
Kastner, S., & Ungerleider, L. G. (2001). The neural basis of biased competition in human visual 681
cortex. Neuropsychologia, 39(12), 1263-1276. 682
Keil, A., Muller, M. M., Ray, W. J., Gruber, T., & Elbert, T. (1999). Human gamma band activity 683
and perception of a gestalt. J Neurosci, 19(16), 7152-7161. 684
Kinsey, K., Anderson, S. J., Hadjipapas, A., Nevado, A., Hillebrand, A., & Holliday, I. E. (2009). 685
Cortical oscillatory activity associated with the perception of illusory and real visual 686
contours. Int J Psychophysiol, 73(3), 265-272. 687
Klimesch, W. (1999). EEG alpha and theta oscillations reflect cognitive and memory performance: 688
a review and analysis. Brain Res Brain Res Rev, 29(2-3), 169-195. 689
Kreiter, A. K., & Singer, W. (1996). Stimulus-dependent synchronization of neuronal responses in 690
the visual cortex of the awake macaque monkey. J Neurosci, 16(7), 2381-2396. 691
Lamme, V. A. (1995). The neurophysiology of figure-ground segregation in primary visual cortex. 692
J Neurosci, 15(2), 1605-1615. 693
Lamme, V. A., & Spekreijse, H. (1998). Neuronal synchrony does not represent texture segregation. 694
Nature, 396(6709), 362-366. 695
Lamme, V. A., Zipser, K., & Spekreijse, H. (1998). Figure-ground activity in primary visual cortex 696
is suppressed by anesthesia. Proc Natl Acad Sci U S A, 95(6), 3263-3268. 697
Logothetis, N. K., Pauls, J., Augath, M., Trinath, T., & Oeltermann, A. (2001). Neurophysiological 698
Maratos, F. A., Anderson, S. J., Hillebrand, A., Singh, K. D., & Barnes, G. R. (2007). The spatial 700
distribution and temporal dynamics of brain regions activated during the perception of 701
object and non-object patterns. Neuroimage, 34(1), 371-383. 702
Mendola, J. D., Dale, A. M., Fischl, B., Liu, A. K., & Tootell, R. B. (1999). The representation of 703
illusory and real contours in human cortical visual areas revealed by functional magnetic 704
resonance imaging. J Neurosci, 19(19), 8560-8572. 705
Mima, T., Oluwatimilehin, T., Hiraoka, T., & Hallett, M. (2001). Transient interhemispheric 706
neuronal synchrony correlates with object recognition. J Neurosci, 21(11), 3942-3948. 707
Muthukumaraswamy, S. D., Singh, K. D., Swettenham, J. B., & Jones, D. K. (2009). Visual gamma 708
oscillations and evoked responses: variability, repeatability and structural MRI correlates. 709
Neuroimage, 49(4), 3349-3357. 710
Neuper, C., Scherer, R., Wriessnegger, S., & Pfurtscheller, G. (2009). Motor imagery and action 711
observation: modulation of sensorimotor brain rhythms during mental control of a brain-712
computer interface. Clin Neurophysiol, 120(2), 239-247. 713
Pfurtscheller, G. (2001). Functional brain imaging based on ERD/ERS. Vision Res, 41(10-11), 714
1257-1260. 715
Pfurtscheller, G., & Lopes da Silva, F. H. (1999). Event-related EEG/MEG synchronization and 716
desynchronization: basic principles. Clin Neurophysiol, 110(11), 1842-1857. 717
Pfurtscheller, G., Stancak, A., Jr., & Neuper, C. (1996). Event-related synchronization (ERS) in the 718
alpha band--an electrophysiological correlate of cortical idling: a review. Int J 719
Psychophysiol, 24(1-2), 39-46. 720
Qiu, F. T., Sugihara, T., & von der Heydt, R. (2007). Figure-ground mechanisms provide structure 721
for selective attention. Nat Neurosci, 10(11), 1492-1499. 722
Robinson, S. E., & J, V. (1999). Functional neuroimaging by synthetic aperture magnetometry 723
(SAM). Sendai: Tohoku University Press. 724
Rols, G., Tallon-Baudry, C., Girard, P., Bertrand, O., & Bullier, J. (2001). Cortical mapping of 725
gamma oscillations in areas V1 and V4 of the macaque monkey. Vis Neurosci, 18(4), 527-726
540. 727
Sarvas, J. (1987). Basic mathematical and electromagnetic concepts of the biomagnetic inverse 728
problem. Phys Med Biol, 32(1), 11-22. 729
Sauseng, P., Klimesch, W., Stadler, W., Schabus, M., Doppelmayr, M., Hanslmayr, S., et al. (2005). 730
A shift of visual spatial attention is selectively associated with human EEG alpha activity. 731
Eur J Neurosci, 22(11), 2917-2926. 732
Scholte, H. S., Witteveen, S. C., Spekreijse, H., & Lamme, V. A. (2006). The influence of 733
inattention on the neural correlates of scene segmentation. Brain Res, 1076(1), 106-115. 734
Sereno, M. I., Dale, A. M., Reppas, J. B., Kwong, K. K., Belliveau, J. W., Brady, T. J., et al. (1995). 735
Borders of multiple visual areas in humans revealed by functional magnetic resonance 736
imaging. Science, 268(5212), 889-893. 737
Shadlen, M. N., & Movshon, J. A. (1999). Synchrony unbound: a critical evaluation of the temporal 738
binding hypothesis. Neuron, 24(1), 67-77, 111-125. 739
Siegel, M., Donner, T. H., Oostenveld, R., Fries, P., & Engel, A. K. (2007). High-frequency activity 740
in human visual cortex is modulated by visual motion strength. Cereb Cortex, 17(3), 732-741
741. 742
Siegel, M., & Konig, P. (2003). A functional gamma-band defined by stimulus-dependent 743
synchronization in area 18 of awake behaving cats. J Neurosci, 23(10), 4251-4260. 744
Singer, W. (1999). Neuronal synchrony: a versatile code for the definition of relations? Neuron, 745
24(1), 49-65, 111-125. 746
Singer, W. (2007). Binding by synchrony. Scholarpedia, 2(12), 1657. 747
doi:10.4249/scholarpedia.1657 748
Singh, K. D., Barnes, G. R., Hillebrand, A., Forde, E. M., & Williams, A. L. (2002). Task-related 749
changes in cortical synchronization are spatially coincident with the hemodynamic response. 750
Super, H., & Lamme, V. A. (2007). Altered figure-ground perception in monkeys with an extra-752
striate lesion. Neuropsychologia, 45(14), 3329-3334. 753
Swettenham, J. B., Muthukumaraswamy, S. D., & Singh, K. D. (2009). Spectral properties of 754
induced and evoked gamma oscillations in human early visual cortex to moving and 755
stationary stimuli. J Neurophysiol, 102(2), 1241-1253. 756
Tallon-Baudry, C. (2003). Oscillatory synchrony and human visual cognition. J Physiol Paris, 757
97(2-3), 355-363. 758
Tallon-Baudry, C., & Bertrand, O. (1999). Oscillatory gamma activity in humans and its role in 759
object representation. Trends Cogn Sci, 3(4), 151-162. 760
Thiele, A., & Stoner, G. (2003). Neuronal synchrony does not correlate with motion coherence in 761
cortical area MT. Nature, 421(6921), 366-370. 762
Thielscher, A., Kolle, M., Neumann, H., Spitzer, M., & Gron, G. (2008). Texture segmentation in 763
human perception: A combined modeling and fMRI study. Neuroscience, 151(3), 730-736. 764
Thut, G., Nietzel, A., Brandt, S. A., & Pascual-Leone, A. (2006). Alpha-band 765
electroencephalographic activity over occipital cortex indexes visuospatial attention bias and 766
predicts visual target detection. J Neurosci, 26(37), 9494-9502. 767
Tootell, R. B., Mendola, J. D., Hadjikhani, N. K., Ledden, P. J., Liu, A. K., Reppas, J. B., et al. 768
(1997). Functional analysis of V3A and related areas in human visual cortex. J Neurosci, 769
17(18), 7060-7078. 770
van der Togt, C., Kalitzin, S., Spekreijse, H., Lamme, V. A., & Super, H. (2006). Synchrony 771
dynamics in monkey V1 predict success in visual detection. Cereb Cortex, 16(1), 136-148. 772
Van Essen, D. C. (Ed.). (2004). Organization of visual areas in macaque and human cerebral 773
cortex (Vol. 1): MIT Press. 774
Van Veen, B. D., van Drongelen, W., Yuchtman, M., & Suzuki, A. (1997). Localization of brain 775
electrical activity via linearly constrained minimum variance spatial filtering. IEEE Trans 776
Biomed Eng, 44(9), 867-880. 777
Vanni, S., Revonsuo, A., Saarinen, J., & Hari, R. (1996). Visual awareness of objects correlates 778
with activity of right occipital cortex. Neuroreport, 8(1), 183-186. 779
Vidal, J. R., Chaumon, M., O'Regan, J. K., & Tallon-Baudry, C. (2006). Visual grouping and the 780
focusing of attention induce gamma-band oscillations at different frequencies in human 781
magnetoencephalogram signals. J Cogn Neurosci, 18(11), 1850-1862. 782
Ward, L. M. (2003). Synchronous neural oscillations and cognitive processes. Trends Cogn Sci, 783
7(12), 553-559. 784
Woelbern, T., Eckhorn, R., Frien, A., & Bauer, R. (2002). Perceptual grouping correlates with short 785
synchronization in monkey prestriate cortex. Neuroreport, 13(15), 1881-1886. 786
Worden, M. S., Foxe, J. J., Wang, N., & Simpson, G. V. (2000). Anticipatory biasing of 787
visuospatial attention indexed by retinotopically specific alpha-band electroencephalography 788
increases over occipital cortex. J Neurosci, 20(6), RC63. 789
Yamagishi, N., Callan, D. E., Anderson, S. J., & Kawato, M. (2008). Attentional changes in pre-790
stimulus oscillatory activity within early visual cortex are predictive of human visual 791
performance. Brain Res, 1197, 115-122. 792
Yamagishi, N., Callan, D. E., Goda, N., Anderson, S. J., Yoshida, Y., & Kawato, M. (2003). 793
Attentional modulation of oscillatory activity in human visual cortex. Neuroimage, 20(1), 794
98-113. 795
Yamagishi, N., Goda, N., Callan, D. E., Anderson, S. J., & Kawato, M. (2005). Attentional shifts 796
towards an expected visual target alter the level of alpha-band oscillatory activity in the 797
human calcarine cortex. Brain Res Cogn Brain Res, 25(3), 799-809. 798
Zipser, K., Lamme, V. A., & Schiller, P. H. (1996). Contextual modulation in primary visual cortex. 799
J Neurosci, 16(22), 7376-7389. 800
Figure Captions 816
817
Figure 1. The top panels depict the target and target-background stimuli as they appeared 818
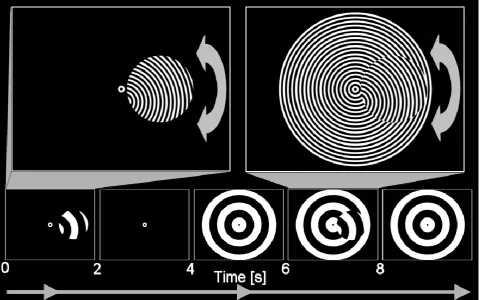
on the experimental display screen: the bi-directional arrows signify that the target 819
was rotated about its own centre by +/- 20 deg. The bottom panels show the 820
stimulus presentation sequence on each trial, depicted using icons, from time zero 821
to ten seconds. 822
823
Figure 2. Visual areas identified in a single participant (P1, Table 2) using a standard fMRI 824
BOLD retinotopic mapping procedure: the field-sign map includes retinotopic areas 825
V1 and V2 (ventral and dorsal). Areas coloured yellow represent the visual field in 826
normal polarity, while areas coloured blue represent a mirror-reversed visual field. 827
Overlaid in red on the flattened cortical maps are the areas where peak gamma 828
activity (30 – 90 Hz) was evident in the left hemisphere (MNI = -15, -87, -9) for a 829
right lateralized target, and in the right hemisphere (MNI = 12, -90, -9) for a left 830
lateralized target (as depicted by stimulus icons at the top of the figure). 831
Corresponding sites of gamma activity between the flattened maps and axial brain 832
slices are indicated by white arrows. 833
834
Figure 3. Group-averaged (n = 7) time course of oscillatory power changes within alpha (8-835
13 Hz), beta (15-30 Hz), low-gamma (40-55 Hz) and high-gamma (> 55 Hz) 836
frequency bands for a VE placed at the site of peak gamma activity in each cortical 837
hemisphere (from Fig. 2 and Table 1). Mean response power (rms Am/Hz) is plotted 838
as a function of time (s), with the different periods of the trial demarcated by vertical 839
dotted lines: the icons at the top of the figure indicate the presence (absence) and 840
spatial arrangement of the target and background for each period. The red (black) 841
traces show the responses obtained with the target positioned in the left (right) 842
visual field, contralateral (ipsilateral) to the position of the VE. The blue (green) 843
traces show the responses obtained with the target positioned in the right (left) 844
visual field, contralateral (ipsilateral) to the position of the VE. 845
846
Figure 4. Group-averaged (n = 7) significance map (Mann-Whitney-Wilcoxon test, p < 847
0.05, |Z| > 1.96) of the differences between the time-frequency responses for left- 848
and right-lateralized targets for the trial period from 6 – 8 s: red (blue) indicates a 849
based on a VE within each cortical hemisphere, as indicated on the axial brain 851
slices at the top of each panel (see also Fig. 2, Table 1). The colour scale shows Z 852
scores computed from the Mann-Whitney-Wilcoxon distribution, thresholded at |Z|> 853
1.96. See text for explanation of Boxes a – e. 854
855
Figure 5. Morlet-wavelet time–frequency spectrograms for activity at the V1/V2 border in 856
the left hemisphere (from Fig. 2 for participant P1), depicting both evoked activity 857
(top panels) and induced (plus evoked) activity (bottom panels). The time axis is 858
partitioned into the five components of the stimulus presentation cycle (see stimulus 859
icons). The red/blue colour scales represent significant changes in amplitude 860
(evoked spectrograms) or energy (induced-plus-evoked spectrograms). The evoked 861
spectrograms show amplitude (fAm/Hz) change per time–frequency bin relative to 862
baseline (computed over T = -2 s to zero). The induced spectrograms show 863
percentage change in energy per time–frequency bin relative to the pre-stimulus 864
interval (T = -2 s to zero). Statistical significance of the changes was assessed 865
using bootstrap analysis, and only changes that were significant at p < 0.05 are 866
displayed in the results. See text for explanation of boxes a – g. 867
868
Figure 6. Combined significance maps of power changes in cortical activity at the V1/V2 869
border in the left hemisphere locations given in Table 1 for all participants (n = 7). 870
Statistically significant (p < 0.001) levels of evoked activity (a, top panel) and 871
induced (plus evoked) activity (b, bottom panel) are shown for frequencies from 0 – 872
80 Hz as a function of time (s) from 0 – 10 s. The time axis is partitioned into the 873
five components of the stimulus presentation cycle, as indicated by the stimulus 874
icons at the top of the figure. 875
876