XJziiveirsity of Southampton.
Inequality i n Pre-School
Provision:
A Geographical Perspective
Steven P i n c h
No. 16
a .
REFERENCE ONLY This book may not be taken out of the Library
SOUTHAMPTON UNIVERSITY LIBRARY
BOOK NUMBER 8 3 - 0 5 6 6 4 4
CLASS MARK u F 7 & q . 5 e » 3
8 3 0 5 6 6 4 4
I S S N 0 1 4 0 - 9 8 7 5
I n e q u a l i t y i n P r e - S c h o o l
Provision:
A G e o g r a p h i c a l Perspective
Steven Pinch
No. 16
J a n u a r y 1983
a
The Editor
'
D i s c u s s i o n Papers,
Department of Geography,
The U n i v e r s i t y ,
S o u t h a m p t o n ,
PREFACE
This F^per is a preliminary analysis of pre-school services, a field which, with a few exceptions (Holmes, Williams and Brown, 1972; Freeman, 1977) has been
ignored fcy geographers and irxie^ other urban analysts concermd with service
allocations in cities. There are numerous possible explanations for this state of affait^i not the least inportant being the fact that study of the under-fives IBS been dominated by psychologists concerned with the intellectual, motional and social development of your^ children. Furthermore, as this paper reveals,
numerous elements need to be integrated to analyse this problan a spatial
perspective - accessibility indices within cities, the social structure of neighbourhoods, the operation of the local political syston and the development of social policy at the national and international level. Various authors have examined these issues in isolation but few have brought the necessary synthesis fbr a spatial view of pre-school services. It must also be remembered that there are in any case relatively few 'official' pre-school facilities so that inevitably
tlie major itons of expenditure in the fields, of housing, transportation, social
services and the like have received the lions share of attention. Howevo?, the major reason'must be the fact that these services primarily affect the lives of women and in cannon with all such issues have been neglected by geographers. Despite a iximber of recent pleas for a redress of this imbalance (eg. Jfonck & Hanson, 1982) there has so far been relatively little empirical research
(eg. Tivers, 1977). One final difficulty is that the ccnplex almost chaotic
[JST OF
1. Provision for the urdei^-fives.
2. Rankir^ of total number of pre-school places in the English local authorities per 1000 population under 5.
3. Rankings of numb^ of places in local authority nursery schools and mrsery
Glasses per 1000 population under 5.
4. Ranking of red^tion clkss places for the under fives in the English local authorities per lOOO pojiuiation under 5.
5. Rankings of local authority day nursery places in the English local authorities per 1000 population under 5.
6. Rankings of private and voluntary playgroup places in the English local authorities per 1000 population urder 5.
7. Rankings of cumber of places provided by registered childminders in the English local authorities per 1000 population under five.
8. Rankings of private nursery places in the English local authorities per 1000 population iinder five.
9. Inter-relationships between types of Pre-School Provision in the English local authorities,
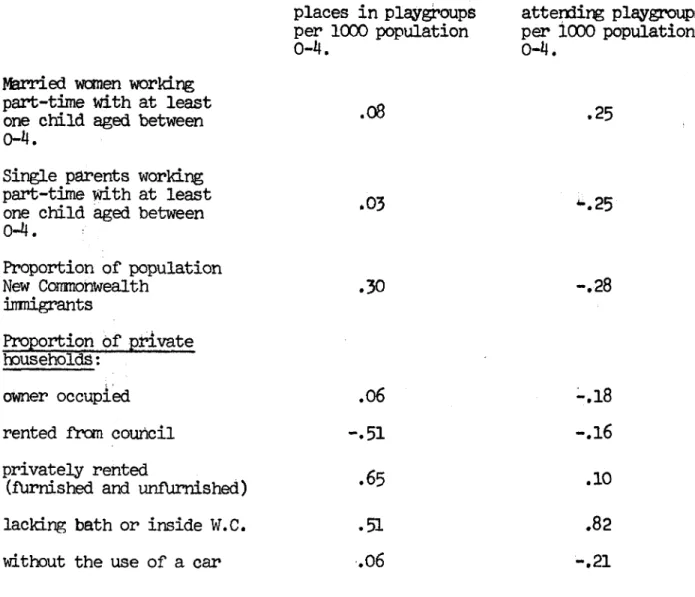
10. Correlatiors between indices of need and provision in the English local authorities.
11. Variations in pre-school provision within Hampshire.
12. Correlations between indices of need and provision for pre-school services in Southampton wards.
U S T OF PIGUBES
1. to English local authorities used in the analysis.
2. Total number of pre-school places in the English local authorities per 1000
population under 5. 'A
3. Number of places in local authority. mrsery schools and nurseiy classes pet*
1000 population under 5.
3. Number of places in local authority day nurseries per 1000 children undfer 5.
5. Itober of married vonen working more than 30 hours with children under five years of age per 1000 working married women with children under five years of
6. Number of single parent families per 1000 of all families with children.
7. The .distribution of day care facilities for tte under-fives in Southanpton.
8. The distribution of local authority day nurseries and childminders in
Southampton.
9. The distribution of educational services for the under-fives in Southanpton.
10. The distribution of voluntary services for the under-fives in Southanpton.
11. Enumeration districts beyoM half
a
mile of a playgroup anJnursery
class •DTITOUCTIQN
In the last decade geographers have examined many areas of public policy
such. a$ housings the elderly, immigrants, education and health care. One
set of services which has been almost totally ignored are those for children
under five. Mar^^ of the fields hitherto studied, such as housirg and health
care, obviously have an important iijpact upon the welfare of young children
but there has been little ^stonatic geographical study of services directly
concerned m t h care of the under fives. These services involve places where
children can spend time outside tteir own hcane with people paid to take care
of them. In Britain today such services are an enormously ccnplex mixture
of day nurseries, nursery schools, chilminders and playgroups. Such
facilities are sonetimes collectively temed 'nurseries' (Hughes, et. al.
1980) or 'pre-school' services (although the latter is something of a
misnomer for nursery classes and reception classes for 'rising fives' are
provided ty local education authorities).
Although there has been some recent controversy over the closure of nurseries
in certain local authorities, the provision of pre-school services is not
a major political issue in the same manner as inflation, unenployment and
housing. Indeed, compared with most fields of economic and social policy,
expenditure on day-care facilities for the under fives is miniscule. In
the financial year 1976 to 1977 net expenditure ty local authority social
services d^artoienfcs on council day nurseries and playgroig)8 amounted to
£55 millions while schooling for the under fives consumed £l35 millions in .
education departments (Hu^es et. al. I98O). This must be set ag&inst
expenditure in the sdme period of 21,540 millions on primary education,
£2,000 millions on secondary education and £1,930 millions on flirt her and
higher education. Purthennore, spendirig on,pre-school services is
currently planned to fall in the goverments programme of expenditure cuts.
It is therefore somewhat ironic that one of tte largest increases in
pre-school services since the Second World War was planned ty Margaret Thatcher
when she was Secretary of State for Education in the VJhite Paper Education:
a Pramework for Expansion (H.M.S.O. 1972). Pbllowing from the recommendations
of the Plowden Report full or part-time rursery education was planned for
50 per cent of three year olds and 90 per cent of all four year olds.
However, the increase in oil prices and subsequent expenditure cuts in the
wake of the recession, meant that these targets were not attained. In 1977
olds and 50 per cent of four year olds. Consequently, pre-school provision
in the U.K. lags far behind most other industrialised nations in both the
capitalist and coimunist blocks (Tizard, Moss and Perry, 1976).
It is therefore hardly surprising that there is evidence of considerable
parental dissatisfaction with both the quality and quantity of existing
pre-school services in Britain. The most ccnprehensive study was that
undertaken by the O.P.C.S. (Bore, 1974). The results are rather ccnplex
for vftiat is desired by parents depends upon the type of day care (if any)
which is currently being used. The hypothetical nature of the questions
also means that the preferences expressed in the study must be treated with
some caution.Given the ccnplexity of existing services for the under-fives
and the fact that the full range of facilities is unlikely to have been
available.in certain of the areas in which the respondents lived, it is
also likely that there was considerable misunderstanding about the nature
of pre-school provision* Nevertheless, the ovferdll pattern of the results
is remarkably clear i Most striking tvas the ehomoUA shftHfall in provision
levels. Provision was wanted for twice as many children as were receiving
it,so that whilst 3 2 per cent of children were using facilities,sane form
of day provision was desired for a further 33 per cent who were not using
services at the time of the survey. At a national level this means that
well over a million of the under-fives are not using pre-school services
contrary to the wishes of their parents .With the exception of chLldminding,
preferences were expressed for more of all types of service tut especially
those of an 'educational' character. Disaggregated fcy age,some fonn of
day care was wanted for 20 per cent of children under 1 year of age, 41
per cent under 2, 72 per cent under 3, 87 per cent under four and 91 per
cent under five. Perhaps more significantly,less than half of the mothers
interviewed wanted part time hours of less than four hours per day. This
also seons to be a classic situation in which supply would create more
datiand ani it seans that many more wonen would seek employment if suitable
pre-school facilities were available. Bone's study also found there were
three times as many unemployed mothers who wanted to start work as employed
mothers who wanted to stop work. These preferences, v M c h are supported
by other studies, contrast sharply with the official view of the two
departments responsible for pre-school services, the D.H.S.S. and the D.E.S.,
vAnch is that children under three should not be separated from their
3
Th^ aim of this paper id to illumirate the^reglected geographical dimensions
of the problons of pre-school provision. A spatial perspective would seen
• ,
to be inpDrtant in this context because, as in the case'of mary other services,.
~therfe'0re enormous variations in the availability of pre-school facilities
between different' areas. Thas, the ease of access to pre-school services
d^ends greatly upon the locality in v M c h the family lj.ves, A widely
dispersed pattern of pre-school facilities would seen to be essential for,
as "ilzard. Moss and Perry (1976) note," in the first of their eight
recomnendations in the pre-schoQl field:
"1. The services should be local. In urban areas at least,
pre-school' services stould normally be within walking distance of the
h c ^ - the sort of walking distance that is feasible with two
small childrm in tow. Ihis means not having to cross roads or
walk vary far. If each pre-school centre served a small catchnent
area most of the children vto came to it would live nearty"
(Tizard, Moss and Perry, 1976, 207).
Three basic issues are therefore examined: first, what is the existing
geographical pattern of pre-school services, second, how does this pattern
match up with the likely needs and danands of families for these services,
and third, what theories can best explain these spatial variations. These
issues are examined at three spatial scales, first at the level of local
author'ities in England, second at the level of districts within Hampshire and
third, at the leva, of local neighbourhoods within Southanpton.
An understanding of the 4-ssues involved in the field of pre-school provision
is immediately impeded by the enormous ccraplexity of existing patterns of
care. As Highes and his associates note:
"... like T o p ^ the services 'just grew' each starting at a
differmt period in response to different needs and follovjing
different lines of development. The result has been a chaotic
mismatch of ancmalies, gaps, overlaps, inequalities and feuds"
(Hughes et. al. 1980).
To put these problans into perspective it is therefore necessary to provide
a brief description of the evolution of these services in Britain. Those
familiar with these issues need turn to page lo.
THE DEVELOPMEWT OP PRE-SCHOOL SERVICES <N BRITAIN
pre-4
scl^l provision in Britain sirce the nineteenth century - the need for women
in the workforce and related attitudes to the desirability of women taking
up orplopient,. Poverty vms ifidespreAd in the cities created by the Industrial
J?evolution ard, as Rowntree observed, vas especially concentrated amongst
families with young children. Mary mothers were therefore forced to seek i?
^loyment in order to increase their household ircome. Day-care facilities
for yourg children were, however, grossly inadequate. In the absence of
relatives or neighbours who were willing to care for their children mothers
were forced,.to rely upon either chlldminders or the notorious 'dame' schools.
Contorporarj^ reports depict a bleak picture of care by mar^r childminders at
this time, while in the dame schools large numbers of children were cranined
into what were frequently urhealthy conditions.
The secon^ half of the nineteenth century saw a progressive decline in the
ixjmbers of workirg married vromen. In I85I (the first date v^en comprehensive
information was available) the proportion of married ivomen in Britain employed
was 24 per cent but by 1911 this figure had declined to between 13 ancJ 14
per cent for England and Wales. Amongst the most inportant reasons for this
decline w ^ e increasirg male earnings and the growing hostility to the idea
of v m e n working in Victorian society. IrxJustrial changes also worked against
women taking up enploymei*. The textile industries in which women were highly
represented were overtake by mechanisation ani the growth of heavy engineerirg
industries from which women were largely excluded. (The relative importance
of these factors - ideological changes and material changes in econordc
structures - and the irter-relationships between these factors has been the
source of enormous controversy (see Scott and Tilley, 1975))*
/
Despite the decline in the proportioh of workirg woineh in the latter part of
the nineteenth omtufy, day care provision for children increased in quantity
if not quality. A number of voluntary organisations began to open day
rurseries and kindergartens but the most important change was the introduction
of ccxipulsory schooling in the l870s. This gave parents the right of
admission for their child if over three but oonpulsory schooling did not
start till five. Between 1855 and I87O the proportion of all children
attending state aided,schools in Britain made up by three and four year olds
doubled fron 7.6 per cent to l4.6 per cent and by 1900 the proportion of
children in this age group in elmentary schools increased to 43.1 per cent.
Thus, at the begimirg of the twentieth century England had begun to provide
an educational service for all children whose parents chose to use it.
5
the "payment by results" systan. As TizaM, Ffoss and Perry (1976) note:
"... the preposterous architecture of class roans, the small
playgrounds in the cranped imer city schools, the huge size of
classes, the foimal teaching,strict discipline and heavy enphasis
• upon religious instruction, and the use of young, unqualified
teachers, supervised by head teachers who were themselves
inadequately qualified and insensitive to the needs of children,
all contributed to the low quality of early education that was
corrnon in the second half of the century." (Tizard, toss and
Perry, 1976, 57).
A number of reports to the Board of Education drew attention to these
undesirable aspects of schoolirg arguing that children between the ages of
three and five did not benefit fron the mechanical methods of instruction.
Some argued at the time that special schools stould be established to cater
for the needs of yourg children but resources were limited and the education
authorities were pre-occupied with extendirg education for older children.
In 1905 education authorities were given discretionary powers to withdraw
the right of admission for the under-fives and after this date their numbers
in schools began to decrease rapidly. This trend was the result of changes
in the policy of the education authorities rather than the wishes of parents
but there was no middle class involvement in the state education syston to
act as a pressure for inprovemenfc at this time. The dominant view was that
for the first five years of life children should ranain permanently at home
with their mothers. This view was reinforced by British experience in the
Boer War when difficulty was encountered in obtaining sufficient healthy and
fit men for the armed forces. High rates of infant mortality and poor health '
amorgst large sections of the vjorking class led to a concern within the
quality of childrearing during a time of increased military and econonic
competition (see Lewis, 198O).
Thus throughout the nineteenth century wonen found their roles increasingly
confined to tousework and childrearing. They were, however, needed in
munitions factories during the First World War and mrseries to look after
children were therefore provided through grants from the Board of Education.
The inter-war period saw little extension of pre-school provision and it was
only again with the Second World War and the urgent need for fenale labour
that mrseries were developed.
Throughout most of the twentieth century the pattern of pre-school services
6
one hand and educationalists. The former expressed an interest in the childs
health and pl^sical needs and dominated day nurseries and grant-aid voluntary
nurseries established by the 1918 Maternity and Child Welfare Act. The
education profession vas concerned with the childs educational and social
developnent and operated within the local authority nursery schools or nursery
classes and voluntary schools established ty the 1918 Education Act. Conflict
between medical and educational groups made it difficult to evolve a national
policy during the Second World War tut the decision was eventually made in
favour of day mrseries.
After tl^ Second World War the distinction between educational and health
needs was maintained. The 1944 Education Act oipowered education authorities
to provide nursery schools or classes for the under fives and the 1946
National Health Act orpowered local authorities to provide day nurseries.
However, the Ministry of Health made it clear that rursery schools and
nursery classes were the preferred f o m of pre-school provision with day
nurseries acting as small supplements for those mothers with particular
needs. Many of the mrseries established in wartime were therefore
transferred to local education authorities to be run as nursery schools, and
the njimbers of day nurseries was reduced.
The 1950s was generally a period of stagnation in the field of pre-school
provision and indeed throughout the 1960s pre-school services did not expand
in a similar manner to other educational sectors (Blackstons, T. 1971). This
policy was justified by the widely held belief that mrseries were harmful to
young children, especially when under three, since it was thought they would
lead to 'maternal deprivation'. This theory was forwarded by Bowlby Who
argued that it was essential that young children should experience intimate
and continuous relationships with their mothers or mother substitutes.
However, throughout the 1960s and 1970s a number of social trends have had an
important inpact in the pre-school sphere. Wanen are marrying younger, having
smaller families and are spreading their childbearing over a much shorter
period. At the same time their life expectancy has increased so that the
proportion of their lives devoted to bring up children is much smaller than
it used to be (Garland and White, 1980). Consequently, an increasing number
of women have taken up paid employment, ma.ry of them with young children.
In 1971 700,000 under-fives had mothers in otployment but ty 1977 this
figure had risen to an estimated 900,000. Dtost of these mothers worked
mothers whose youngest child, was under five worked part-time and 5 per cent
worked f U H time. Coupled with this trend was a rapid increase in the
number of one-parent families. According to the latest estimates there were
in 1980 at least 920,000 one-parent households in Britain with IJ million
children. In recent years the proportion of single mothers with young
children who are working has incr^sed considerably to l4 per cent full-time
and 18 per cant part-time.
Continuing high levels of inflation, the lowest level of child allowances
in Europe (Lister, 1980), and a taxation policy which discriminates against
•children,have all contributed towards the economic pressures upon women to
take up onployment. However, increased workforce participation rates must
also be seen as related to an increased desire amongst wanen to enjoy the
independence, status and conpanionship which work can provide and which
motherhood can frequently undermine.
Ihe corcept of maternal derivation has also been exposed to enormous
criticism in recent years. Bowlbys' theories were derived flxan studies of
children who were totally separated fron their mothers and had grown up in
poor quality residential institutions,and were not derived from experience
of day nurseries and day schools.
These developments have been accompanied ty a decline in the possibilities
of support for mothers from friends or relatives in the immediate neighbourhood.
Increased residential mobility and household formation rates mean that
families and friends are now much more likely to be separated geographically.
Rehousing schemes have also served to increase the dislocation of familial
support and the growth of flats has increased the social isolation of mary
mothers. There has also been growing evidence in recent years that the
experiences of motherhood fall far short of the idealised state portrayed
in advertising. Vfomen with young children suffer from particularly high
rates of d^jression (Brown ard Harris, 1978) and the accident rate amongst
children with depressed mothers is considerably increased.
In the absence of state provision through local authorities these pressures
for pre-schodl provision led to expansion in the voluntary and private
sectors. The voluntary playgroup movement began in 1966 with the initiative
of a single mother, who organised neighbours with other young children into
a group which met regularly in each others homes, sharing the task of child
care. Ey 1970 this te,d developed into the PreSchool Playgroups Association
8
In. the private sector there was also a consid^able expansion of mrseries
but.most important - and most controversial - was the rapid growth of
cMldminding. Since 19^8. childmirders have been obliged' to register with
' their lodal authority social services departrrienb if they mind children for
profit but mary minders are not registered. This is the sector of pre-school
provision where there is least information but is known to be the area where
standards are most variable. The extent of this illegal childminding is
almost inpossible to estimate. Detailed investigations of small inner areas
of British cities (involving following the travels.of young children to
minders at 5.30 in the morning) have indicated that there are far-more
unregistered than registered minders (Jackson and Jackson, 1979). The
Jacksons claimed that the ratio of unregistered to registered minders was
10:1 in certain areas of British cities. Recent estimates have put the
ratio at a much lower level between 2:1 to 6:1 tut no one can be sure of the
precise figure and this is likely to vary considerably between different
areas (Bryant, Harris and Newton, 1980). There has certainly been an '
enormous increase in the number of registered childminders in recent years
and although this coincides with an increased rate of participation by women
in the workforce, it is difficult to assess the extent to which this reflects
a genuine increase in childminding or an increased rate of registration ty
social services departments* There are considerable variations between local
authority areas in the numbers of registered childminders which seem difficult
to relate to the number of vrorkir^ women. The assumption must be therefore
that these figures reflect the extent to which the local authority is prepared
to publicise the need for registration. M n y childminders are ignorant of
the need to register but the registration procedure ife typically cumbersome,
lengthy aria negative in character and of relatively little benefit to the
childminder» An inspection is made before registration with the local authority
to ensure that basic standards of safety, health and space ^ e provided for.
However, these standards may vary between authorities and it is claimed that
some authorities may be reluctant to refbse registration as this may be the
only way to keep a check on the minders (Bryant, Harris and Newton, 1980;
Jackson and Jackson, 1979).
Nevertheless mai^y recent developments including the television programme
Other Peoples Children and tte formation of the National Childminding
Association, would seen to indicate a change of attitude towards minding and
a lessening of the stigna associated with this form of care. The crucial
and schools are, in numerical terms, little more than the 'tip of the iceberg'
The enormous gulf in pre-school care has been filled ty various forms of
minding > especially in working class areas where wanen are under the greatest
financial pressures to return to work vdnile their children are still young.
The Jackson's fieldwork unearthed a conplex self-help network of friends,
relatives and minders (both registered and unregistered) attempting to conbat
the shortfall in official forms of pre-school care.
PROBLEMS WITH PRE-6CH30L SERVICES
The net effect of this historical development is a pattern of provision v M c h
is unsatisfactory for both parents and children. Parents vary enormously in
their needs for pre-school services and ideally a wide range of types of
service should confer flexibility and choice. In reality, however, the
enormous diversity of pre-school services in Britain is bewildering to many
parents and is likely to inpede their access to the most suitable forms of
provision.
More important in preventing parents having any realistic choice in the field
of pre-school provision is the low overall level of places available. In
1977 the estimated total pre-school population of England and Wales was
3.4 million and studies suggest that some form of alternative care is wanted
for tvo thirds of all children (Bone, 1977). However, local authority day
rurseries, playgroups, nursery classes and nursery schools amounted to only
162,000 places. In 1977 for exaiiple, the national waiting list for local
authority day nursery places was some 12,000 and the vast majority of these
children have little or no hope of obtaining a place (Jackson and Jackson,
1979). In an inner-city borough like Lambeth the provision of maintained
d%r nursery places exceeded the D.H.S.S. guidelines by 4 fold yet borough
could still provide for only half of its priority children (Bruner, 198O).
This restricted state provision has led to a proliferation of facilities in
the private and voluntary sectors through private rurseries playgroups and
childminders. In 1977 these amounted to 495,000 places - about three times
the rumber of places provided ty the state - tut there are still only enough
places for just over half the parents who want them.
Mary have argued that it is the fragnentation of the services which impedes
their dwelopment. Local authority social services departments are
responsible for the 'caring' services. These include local day nurseries
vftjich operate on a highly selective basis catering for those children 'who
10
ensuring that all private nurseries, playgroups ani childminders in an area
provide adequate standards of pare). Local education authorities,in contrast,
provide the educational facilities in nursery' schools and classes on a
non-selective basis. The absence of ary single department in charge of pre-school
services leads to a vaccuum of responsibility. Those attenpting to obtain
increased levels of service in an area may therefore be pajssed between the two
d^artmenbs each dei^ring responsibility for further extension of facilities.
It wuld also seon that the structure of the present system is such that those
in greatest need do not obtain the most suitable form of pre-school provision.
Seme council d%r nurseries take priority cases from frequently long waiting
lists, this results in mary disadvantaged children in one type of institution
with all the stigma this entails. Nursery education, in contrast, is
available on a non-selective-basis but is offered only in school term time
and for short sessions. This is of little use to the mother working full-time
and favours the middle class mother v;ho is more likely working part-time than
her working class counterparti The most widely used service playgroups
-are also only available for short sessions and again have a disproportionately
high number of middle class children. The children least likely to obtain
nursery education are those who might benefit fran it nrast - the children of
the low-paid, inmigrants anJ single-parent families whose mothers are more
likely to be in full-time mployment and #10 are therefore more likely to be
cared for by childminders, or local authority day nurseries if they are
priority cases. However, it is attitudes towards the widespread phenomenon
of childminling which are most controversial. The bulk of the available
evidence indicates that parents are largely forced to used childminding and
that the majority who do so would prefer some other conmunal form of pre-school
care, usually in a nursery (Bone, 1974). The D.H.S.S.,in contrast,see
childminding as the inexpensive and practical way in v M c h to meet the enormous
demand for pre-school care and has been concerned at what it sees as parental
prejudice against minders. Others have argued that childminders are cheap and
flexible compared with nurseries and since they are a 'fact of life' local
authorities should become more positive in their attitudes to childminding
providing real benefits at registration by linking minders with playgroups and
offering access to training schenes, toy libraries and free milk (Jackson and
Jackson, 1979). Critics assert that while childminding is cheap compared with
other forms of care, this only appears to be the case because most of the
hidden capital costs are born by the minders themselves (who in mar%y cases
11
low^levels of physical, anotioml ard intellectual care provided ty some
chiidminiers (Tfeyall and Petrie, 1977i Bryant,. Harris and Ne#on, I98O) and
it seans clear that is is the privacy and isolation of this form of care lAich
'mary parents dislike (Hannon^ 1978).
A sunmary of basic information relating to services for the under fives is
presented in Table 1.
INTER AUTHORITY PATOERNS OF PRE-SCHOOL PROVISION
This section examines the inter-authority patterns of pre-school provision in
England. Local authorities are urder no statutory obligation to provide
pre-school services and, as with other discretionary services, corsiderable
variations in provision levels can be expected between different areas. Some
local authorities have attached considerable inportance to the development of
pre-school facilities while others have sought to rely upon the voluntary and
private sectors. A nuniber of writers have drawn attention to the extremes in
provision levels (Blackstone, 1971) but there has been little or no systonatic
examination of inequalities throughout the country in recent years. Pig, 1
shows the key to the areas used in the analysis.
Before examining the results it is important to highlight the limitations
inherent within the data for there can be few fields in which official
statistics are as unreliable as in the realm of pre-schbol services. This is
of course hardly surprisir^ given the enormously f ragiiented and illogical
pattern of pre-school facilities which exists in Britain. There are enormous
differences in the quantity and quality of care (hours of availability, cost,
rmber of facilities etc.) both within and between services,which are not
revealed by official statistics. The data are most reliable in the case of
those services such as the day nurseries and nursery classes that are directly
provided ty the local authority, although these are not without problems of
interpretation. The reliability of data is rather more questionable in the
realm of private and voluntary forms of care since there are inevitably problons
involved in coordinating information from such a wide range of informal
organisations,even with coordinating bodies such as the Pre-School Playgroups
Association. In the field of childminding of course,the data will reflect
the extent of registration rather than the total amount of minding in an area.
It must also be appreciated that, from the consumers viewpoint, many of these
services are not separate. Ifery children, and especially those aged three and
four, are passed between a complex network of nursery classes, playgroups and , .
minders so that an element of 'double-counting' inevitably exists in the / •
Table 1 Provision for the Under Fives Type of Provision Registering Agency Pundi^ and Organisation
Location Number of Children Per Session Ages of Children (Yrs) Staff Ratio Staff Conposition Session Time Cost to Consumer
Day nurseiy Social services State provided and funded Purpose built or adapted premises 20/35/20 Units
0-4 1:3^/4 Nursery nurses and assistants
Up to 6 trs X 2 or 3 sessions per week Means tested fee Registered childminder Social services Privately funded and organised Minders heme
1-3 0-i} 1:3
Includ-ing their own children only 1 child under 8 months No training necessary but attendance at courses encouraged
Up to 8 hrs X 5 sessions per week
Fees vary £12 average for one week
Nursery school
Education State provided and fimded
Purpose built or adapted prsnises
25 3-4 1:10 Nursery
teachers, nursery nurse, nursery assistant
21 hrs X 5 sessions per week
Free
Nursery class/unit
Education State funded and provided Converted hut class roan or purpose built unit attached to 1st school
20/30/40 3-4 1:10 As above 21 hrs X
5 sessions per week
Free
Extended pre entry class
Education State funded and provided Converted hut or classroom on school premises
10-15 4i 1:10 Teacher or
nursery
nurse under
Table 1 (continued) Type of Provision Registering Agency Fundi^ and Organisation
Location Number of Children Per Session Ages of Children (Yrs) Staff Ratio Staff Composition Session •Time Cost to Consumer Handicapped class in school
Education State funded and provided Converted hut or classroom on school pranises According to need
0-5 1:5 Advisory
teacher for deaf 1 qualified teacher for deaf 1 qualified teacher part time 2J hrs
X 1-10
sessions per week
Free
Special schools
Education State provided and funded Purpose built pranises According to need
0-5 1:3 Staff from health and education
21 hrs X
4 to 10
Free
Nursery class in private school
If 5 or more over 5 years D.E.S.
If more under 5 than over 5 D.E.S. & D.K. S.S. Privately funded and organised Purpose built or adapted pranises According to accommodation
2|-5 Teachers 2| X 5-10
sessions per week Fee paying Private day nursery Social services Privately funded and organised Usually adapted house
%) to between 10 and 20 according to acccffnnodation
2&-4 1:6 plus super-visor
May be ex nursery nurse or teacher-Varies according to parents needs Fee paying
Playgroup Social services Volunteers fund and organise Fall hut or house
% to 24 in hall up to 15 in house
3-4 1:8 Supervisors and helpers may attend playgroup courses
Table 1 (continued) Type of Provision Registering Agency Funding and Organisation
Location Number of Children Per Session Ages of Children (Yrs) Staff Ratio Staff Coiposition Session Time Cost to Consumer Opportunity playgroup Social services Volunteers fund and organise Hall or converted school pr anises
Up to 24 in one group Handi-capped children 0-3 yrs Brothers & sisters 0-4 years 1:8 plus super-visor & 1 helper for each handi-capped child Supervisors & helpers m%r attend play-group courses
2 1 x 1 session per week Fee paying as above Hospital playgroup Hospital authority Organised & funded by save the children fund Special play area and within wards Number varies according to hospital inpatients
0-16 No ratio 2 play-leaders funded & trained by save the childron fund
Flexible Free
Mother/ toddler group
Not needed Volunteers fund and organise Clinic, hall or vftiatever is locally available Varies according to demand
England and Wales
0 km
1 55 Bradford
2 Bedfordshire 56 CaMerdale 3 Berkshire 57 Kirkiees 4 Buckinghamshire 58 Leeds 5 Cambridgeshire 59 WakefiekJ 6 Cheshirt 60 Bamstey 7 Clevelend 6 1 Doncaster 8 Cornwall 62 Rotherham 9 Cumbria 63 S h e f W d
10 64 Birmingham
11 Derbyshire 65 Coventry 12 Dorset 6 8 Dudley 13 Durham 67 SandweH 14 East Sussex 68 Solihull 15 Essex 6 9 W W W 16 Gloucestershire 70 Wolverhampton 17 Hampshire 71 Gateshead 18 Hereford and Worcester 72 Newcastle upon Tyne 19 Hertfordshire 73 North Tyneside 2 0 Humberside 74 South Tyrteside 21 IsJe of Wight 75 Sunderland 2 2 Kent 76 Barking 23 Lancashire 77 Bamet 24 Leicestershire 78 Bexley 25 Lincolnshire 79 Brent 26 Norfolk 8 0 Bromley 27 Northamptonshire 8 1 Croydon 28 Northumberland 8 2 Ealing 29 Nortir>ghamshire 83 Enfield 30 Oxfordshire 84 Haringey 31 Salop 85 Harrow 3 2 Somerset 86 Havering 33 Staffordshire 87 Hillingdon 34 Suffolk 88 Hounslow 35 Surrey 89 Kingston upon Thames 36 Warwickshire 90 Merton
37 We*t SuMM 91 Newham 38 Wiltshire 9 2 Redbridge
39 Yorkshire 93 Richmond upon Thames 4 0 Bolton 9 4
41 Bury 95 Waltham Forest 4 2 Manchester 96 Camden 43 Oldham 97 Greenwich 44 Rochdale 9 8 Hackney 45 Salford 9 9 Hammersmith 46 Stockport 100 Islington 47 Tameside 101 Kensington 4 8 Trafford 102 Lambeth 4 9 Wigan 103 Lewi sham 5 0 Knowsley 104 Southwark 51 Liverpool 105 Tower Hamlets 52 St. Helens 106 Wandsworth 53 Sefton 107 Westminster 5 4 Wirral
0 MERSEYSIDE
( 2 ) GREATER MANCHESTER
( 3 ) WEST YORKSHIRE 0 SOUTH YORKSHIRE
Metropolitan Counties
0 km 40
< 70 ( / 69 < 70 ( / 69 7 (
\ ^ 7 64
68 I 65 / WEST MIDLANDS
V ,
73 S
1 \
74 J 71
^
75 (
TYNE AND WEAR I
GREATER LONDON
16
TOTAL PROVISION
Table 2 shows the rankings of total pre-school provision in tte Erglisji local
authorities in 1976 per 1000 of the population under five. The data, include
the number of places in all foms of local authority, nursery schools, nursery
classes, reception classes and day nurseries together with all foms of
registered private and voluntaiy playgroups, nurseries and child^niers. The
range of variation is considerable but the basic pattern is fairly clear.
With a f m exceptions (notably Hertfordshire, Isle of Wight, Northanptonshire,
Warwickshire and Cambridgeshire) the top half of the list of rankings is
doninated by the London boroughs and metropolitan districts, Richnond, Brent,
Redbridge, Kingston, Brcmley and Merton emerge amonigst the highest rarte
together with the cities of I>1anchesfer, Liverpool ahd. Newcastle. Conversely
the bottom half of the rankings, is dominated the non-metropolitan counties,
notable exceptions being Bradford, Wigan,, Barnsley, Traffdrd, Walcefield,
Rbtherham, Wolverhanpton, Kirclees^Krcwsley and. Dudley. AS figure 2 makes •
clear,it is the major conurbations which have the largest amounts of pre-school
services, even when standardised for population size. .
NURSERY SCHOOLS AM) NURSERY CLASSES
This total pre-school provision is of course conposed of the enormous variety
of services described above. These services may each have their own-distinctive
patterns and it is therefore nec^sary to disaggregate the data and examine
the various forms of pre-schDol care separately.
One of the most important local authority services are the nursery' schools
and nursery classes, Blackstone (1971) has provided an excellent historical
review of the evolution of these educational services in the latter half of
the twQitieth century. She points out that, whereas the private forms of care
in nurseries and kindergartens purchased by the middle classes in the late
nineteenth century were influenced by the philosophies of educational pioneers
such as Eroebel and Montessori, the origins of state nursery education were
rather different. The various Factory Acts passed in the Victorian era led
to a greater awareness of the plight of yourg children in poor working class
hones. Education was seen as a way of removing young children from these
harmful envirorments. Eventually the 1908 Report of the Consultative Coimdttee
of the Branch of Education argued that, alt hough the best training for children
was at home v/hen conditions were satisfactory, the state should intervene
wtere this is not the case. It was argued that the amount of mrsery education
17
RANK RANK
1 Richnond 437 48.5 N. Tyneside
2 Brent 385 50 Hanpshire
3 rfenchester 375 51 Wirral
4 Redbridge 367 52.5 Cornwall
5 Kingston 365 52.5 Sunderland
6 Branley 348 54 Bury
8 ILEA 345 55 Cleveland
8 Liverpool 345 56.5 Avon
8 Merton 345 56.5 Bmningham
10 Newcastle 343 58.5 Lancashire
11 HDunslow 342 58.5 N. Yorkshire
12 Calderdale 341 60.5 Sandwell
13 Hillir®don 332 60.5 Tameside
14 Coventry 328 62 Vfelsall
15 Salford 327 63 Gloucestershire
17 Bolton 326 64 Bedfordshire
17 Ealing 326 65.5 Staffordshire
17 Oldham 326 65.5 Sutton
19 Solihull 325 67.5 Dorset
20 Stockport 320 67.5 W. Sussex
21 Earnet 318 69.5 Bradford
22 Iferrow 316 69.5 Buckinghamshire
23 Hertfordshire 314 71 Sheffield
24.5 Cumbria 313 72 Norfolk
24.5 Isle of Wight 313 73 Leicestershire
26 Rochdale 311 74.5 Essex
27 Sefton 310 75.5 Hereford and Wore.
29 Northanptonshire 309 76.5 Devon
29 S. Tyneside 309 76.5 Wigan
29 VJarwickshire 309 78 Derbyshire
31 Croydon 307 79.5 Kent
32 Enfield 305 79.5 Salop
33 Haringey 300 81 Earnsley
34.5 Cambridgeshire 298 82.5 Cheshire
34.5 Vfeltham Forest 298 82.5 Suffolk
36 Barking 297 84 Trafford
37 Northumberland 296 85 Oxfordshire
39.5 Bexley 292 86 1/feikefield
39.5 Havering 292 87 Berkshire
39.5 Leeds 292 88.5 Rotherham
39.5 Lincolnshire 292 88.5 Wolverhampton
42 Gateshead 291 90 Wiltshire
43 Surrey 290 91 Nottinghamshire
44 Durham 289 92 Hanberside
46 Doncaster 288 93 Kirclees
46 Sonerset 288 94 Dudley
46 St, Helens 288 95 Knowsley
48.5 E. Sussex 287 96 Newham
287 285 284 283 283 281 279 278 278 277 277 276 276 275 274 271 269 269 268 268 265 265 262 261 258 249 249 248 248 247 246 246 244 242 242 241 240 239 236 232 232 231 230 229 228 178 166 ?
Table 2 RarMr^s of total rumber of pre-school places in the English
TYNE AND WEAR
Total number of places in local authority, voluntary and private nurseries in 1976 per 1 0 0 0 children under 5
> 4 2 0 3 8 1 - 4 2 0 341-380 3 0 1 - 3 4 0 261-300 221-260 < 2 2 0
England and Wales
0 km
1 I , I 1 I u _
200
Metropolitan Counties
0 km 4 0
1 I I I I I I I
© MERSEYSIDE
@ GREATER MANCHESTER
(5) WEST YORKSHIRE 0 SOUTH YORKSHIRE
WEST MIDLANDS
19
and social conditions of the area, ana the proportion of children under
five years in conditions of whose hemes are unsatisfactory" (Consultative
Ccmnittee page 48 quoted in Plackstone 1971, 31). As Blackstone notes,
this consgjt of local discretion has been of crucial inportance.
"It has dominated policy directives in ths field of pre-school
education from its initial introduction in 1908 to the 1950s
and has been an important factor in the patchy development of
nursery schools, in that it allows those in power at local
levels wide powers of interpretation as to what the needs of
the area involve" (Blackstone, 1971, 31).
Tte Consultative Conmittee stressed that in urban areas the majority of
children aged between 3 and 5 years should be regarded as eligible but the
number of mrsery places provided indicates that his has neven been accepted.
The 1944 Education Act led many to believe that an era of univeral mrsery
education was about to begin for this stated:
"a local education authority shall in particular, have regard ...
to the need for securirg that provision is made for pupils who
have not attained the age of five years by the provision of
nursery schools or, where the authority consider the provision
of such sclnols to be inexpedient, by the provision of nursery
classes in other schx)ls" (Section 8 (2) G).
However, essentially there was a return to the pre-war situation in which the
expansion of mrsery education was slow or halted completely ty fiinistry
circulars.
Blackstone examined the resulting distribution of mrsery education in the old
local goverment systan using data derived for 1965. The basic pattern was
one of high provision in London and the urbanised areas of Yorkshire,
Staffordshire and Lancashire with smaller amounts of provision in the rural
counties.
%ble 3 shorn the rankings of provision a decade later in 1976. Despite the
reform of the local goverrment systan there is considerable continuity in the
patterns although inevitably some of the contrasts between the old county
boroughs and counties has been averaged out in the new non metropolitan
counties (as in the case of Leicestershire). The overall pattern is broadly
similar to that for total provision with the London boroughs and metropolitan
20
RANK RANK
1 Manchester 175 49 Cumbria 37
2 Salford 84 49 Gateshead 37
3 ILEA 79 51.5 Avon 34
i\ Bamsley 78 51.5 Kirclees 34
5.5 Bolton 77 53 Leeds 33
5.5 Newham 77 55 Cheshire 32
7 Rotherham 75 55 Soliholl 32
8 Walsall 74 55 Wirral 32
9 Liverpool 73 57 Lancashire 30
10 Newcastle 72 58.5 N. Yorkshire 29
11 Calderdale 70 58.5 St. Helens 29
12 Wolverhanpton 68 61 Oxfordshire 28
13.5 Birmingham 65 61 Warwickshire 28
13.5 Doncastop 65 61 Wigan 28
15.5 Haringey 64 63.5 Harrow 26
15.5 Wakefield 64 63.5 Stockport 26
17.5 Kingston 63 65.5 Cambridgeshire 25
17.5 Merton 63 65.5 Enfield 25
19 Bradford 61 67.5 Bury 23
20 S. Tyneside 60 67.5 Northumberland 23
a Sandwell 59 70.5 Buckinghamshire 22
22 Cleveland 58 70.5 Knowesley 22
23 Sheffield 56 70.5 Richmond 22
24.5 Hertfordshire 55 70.5 Surrey 22
24.5 Nottinghamshire 55 73 Redbridge 21
27 Leicestershire 54 75 Bexl^ 20
27 N. Tyneside 54 75 Cornwall 20
27 Staffordshire 54 75 Trafford 20
30 Durham 51 77.5 Northamptonshire 18
30 Oldham 51 77.5 Salop 18
30 Rochdale 51 79.5 Croydon 16
33 Barking 50 79.5 Suffolk 16
33 Dudley 50 81 Lincolnshire 14
33 Hillingdon 50 82 Devon 13
35 Hounslow 48 83 E. Sussex 12
36.5 Bedfordshire 46 84.5 Essex 10
36.5 Sefton 46 84.5 Isle of Wight 10
38 Sunderland 44 87 Dorset 9
39.5 Barnet 43 87 Norfolk 9
39.5 Derbyshire 43 87 Havering 9
42 Berkshire 42 89.5 Hampshire 8
42 Brent 42 89.5 Kent 8
42 Sutton 42 92 Hereford and Wbrc. 7
44 Tameside 41 92 Somerset 7
45 W. Forest 40 92 W. Sussex 7
46.5 Ealing 39 94 Bromley 4
46.5 Hmbarside 39 95 Wiltshire I
49 Coventry 37 96 Gloucestershire
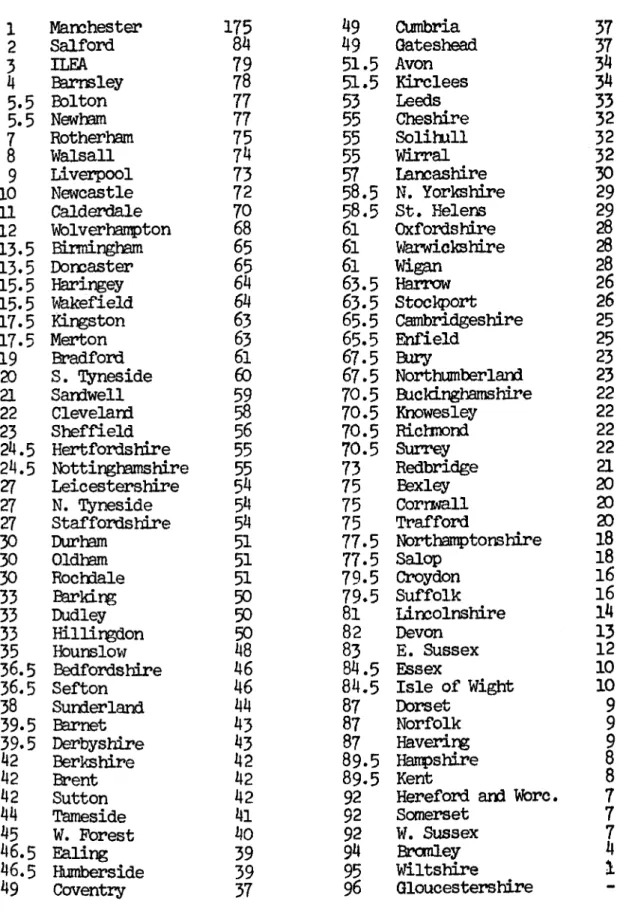
-Table 3 Rankings of mrseiy school and nursery class provision in the
21
counties doninatir^ the below average providers. However, in this instance
the range of provision is much greater than for total provision, raiding
from nothirg in Gloucestershire to 175 in Manchester. Furthermore,the pattern
of ranks and the distinction between metropolitan districts and non-metropolitan
counties is less clear than in the case of total provision. Nevertheless,
groups of local authorities m t h similar characteristics can be discerned.
First, there are the metropolitan districts from the north and midlands which
have the highest rates of provision. These include Manchester, Salford,
Barnsley, Bolton, Rotherham, Walsall, Liverpool and Newcastle. This serves
to eiphasise a major factor affecting patterns of pre-school provision - the
influence of historical factors and past decisions affecting current
distributions.
The demand for pre-school care vjas inevitably greater in the northern textile
towns with large proportions of wonen in the paid workforce. Tte enphasis
placed upon social conditions the Board of Education meant that the early
progress in nursery education was made in these northern industrial cities.
This early progress developed an ethDS favouring provision while other
authorities have sought to do little. Bradford, for example, was one of the
first local authorities to stress the educatioml value of nursery schools
maintaining that they should be a universal experience. The rate of provision
of nursery schools and nursery classes in Manchester is worthy of particular
note for it is over twice the extent of the second highest provider (which
is neighbouring Salford). There is a lorg history of interest in nursery
education in Marchester which may be traced back to the middle of the nineteenth
century. Following the European uprisings of 1848,a relatively large colony
of wealthy German immigrants settled in Manchester and they provided a fertile
seedbed for the new kindergarten movement. This movement in turn influenced
some of the more liberal minded of the upper middle class merchants in the
city (and specially from the Jewish community) to sponsor nursery education
schemes (Blactetone, 1971). Over the years the local authority has done much
to sponsor mrsery education and did much to foster nursery classes in the
1930s v M l e other authorities dragged their feet.
A second set of authorities which may be clearly distinguished are the Lordon
boroughs er^oipassed within the Inner London Education Authority together with
the outer boroughs of Haringey, Kingston, Merton, Barking, Hillingdon,
Hounslow, Ear net. Brent, Waltham Forest and Ealing. These vary considerably
in provision levels (from 79 in the case of LEA to 39 in the case of Ealing)
-22
Harrow, Enfield, Richnond, Bexley, Croydon,Pfaveming and Bromley which have
much lower levels of provision. Like Manchester, London has been a centre
of imovation and development in the field of mrsery education and has
maintained this tradition to the present day. ffost of this provision is
concentrated in the poorer inner areas within the LEA and, with a few exertions,
in the lower status outer suburbs. Those outer London boroughs which provide
relatively low levels of rursery schools and mrsery classes are m t i r d ^
conposed of higher status authorities.
A third set of authorities lAich can be distiriguislied are the relatively high
provision non-metropolitan authorities. These include (in rank order)
Hertfordshire, Nottinghamshire, Leicestershire, Staffordshire, Bedfordshire,
Dertyshire, Berkshire, Hjmberside, Cumbria, Avon, Cheshire, Lancashire,
Oxfordshire, Warwickshire and Northumberland. The high provision in
Hertfordshire wa.s observed by Blackstone and followed up in a case study.
Before the Second World War there vms no rurseiy provision in Hertfordshire
but to cope m t h evacuation forty two wartime nurseries were established.
After the war these were either closed or taken over by the education
d^artmenb and used as nursery schools. Blackstone attributes this shift to
the relative power of officials.
"The powerful chief education officer at the time was convinced
of the vlaue of nursery provision and believed that it belonged
to the province of the education department rather than to that
of the health d^artment. He also presumably believed that his
own department could organise the service more effectively than
tJne existing health dQjartment. The medical officer of health
was considerably less powerful in the hierarchy of chief officers
and consequently his own departmert's bid to take over the
war-time nurseries was quashed early on without a prolonged fight,
although it did succeed in wresting three of them from the
education department's grasp, which subsequently became health
d^artment day nurseries. The sharing out of vtar nurseries
merely shows that the power ivielded by the officials concerned
can affect the nature and extent of provision in a denonstratable
way" (Blackstone, 1971).
The following years saw little expansion of nursery education in the vra.ke of
central pressure to reduce expenditure. In this context officials in
Hertfordshire appear to have shown considerable resourcefulness and ingenuity
23
inadequate accormodation and maintain the existing stock of nursery schools
and classes. Indeed^ only one nursery school was closed in the period
until 1965. The ranainirg high provision non-metropolitan counties are
either in the m r t h or have large urban centres within their boundaries
vriiere nursery education has been concentrated. Indeed, Leicester (in
Leicestershire) Stoke on Trent (in Staffordshire), Oxford (in Oxfordshire),
Reading (in Berkshire) and Bristol (in Avon) all emerge in the top ten of
highest providers of nursery education when they were county boroughs
primarily responsible for tlus service in the pre-197^ local goverrment
system (Blackstone, 1971). The reasons for the relatively high provision in
tlus conbext are essentially the same as for the metropolitan districts.
The patterns are sinply obscured by the new local goverrment boundaries.
Thus relatively high provision in the cities and usually lower levels of
provision in rural areas mean that these non-metropolitan authorities
average out with infcemediate levels of resource provision.
A fourth group of local authorities which may be distinguished within the
rankings are the non-metropolitan counties with relatively low levels of
nursery schools and classes. These are Surrey, Corntvall, Northamptonshire,
Salop, Suffolk, Lincolnshire, Devon, East Sussex, Essex, Isle of Wight,
Doreset, Hampshire, Kent, Hereford and Worcester, Somerset, West Sussex,
Wiltshire and Gloucestershire. These may be easily typified as being
pre-dominantly in the south of the country, of relatively high socio-econanic
status and often ivith dispersed agricultural communities. They are clearly
outside the older high density industrialised centres where nursery education
has developed to the greatest extent.
A fifth group of authorities are the metropolitan districts with relatively
low levels of hursery school and nursery class provision. Since there are no
sudden breaks in the rankings fihding the cut-off point which distinguishes
this group is difficult and it should be appreciated that many provide
considerably greater numbers of places than sane of the low provision
non-metropolitan counties. Nevertheless, these authorities include Trafford,
Knowesley, Eury, Stockport, Wigan, St. Helens, Wirral, Solihull, Leeds and
Kirclees which have smewhat lower levels of provision than the remaining
metropolitan districts. These authorities are sonewhat diverse in character.
Trafford, Stockport and Solihull stand out as districts of above average
socio-economic status m t h small proportions of women ivith young children
worki% f u l l time and below average proportions of sirnle^arent families.
TYNE AND WEAR
Number o f places in local authority nursery schools and nursery classes per 1 0 0 0 children under 5
77: 175
7 6 - 8 5
8 1 - 7 5
4 6 - 6 0
3 1 - 4 5
1 6 - 3 0
5 - 1 5
< 6
England and Wales
0 km 200
Metropolitan Counties
0 km 4 0
0 MERSEYSIDE
2 ) GREATER MANCHESTER y WEST YORKSHIRE 0 SOUTH YORKSHIRE
WEST MIDLANDS
GREATER LONDON
25
RECEPTION CLASSES
The other major aspect of 'pre-school' care for the under-fives provided ty
local education departments are reception classes. These are in fact not
primarily intended for children under-five but an increasing number of such
children have been aiAnitted to these classes in recent years. The extent to
which this is the case varies enormously between areas dependirig upon the
policy of the local education authority. Sane authorities admit relatively
few numbers of the under-fives while others concentrate upon admitting
children in the term before their fifth birthday (the so called 'risirg-fives').
Other authorities attaipt to accommodate as large a number of four year olds
as possible. Nationally some 57 per cent of four year olds in reception
classes were rising fives and the ronaining 43 per cent were younger four year
olds (Hjghes et. al. 1980). Data relating to reception class size should,
however, be treated with caution for the rumber of places available is likely
to fluctuate throughout the year, ftich d^ends upon the availability of
premises in schools and the number of children in local catchment areas.
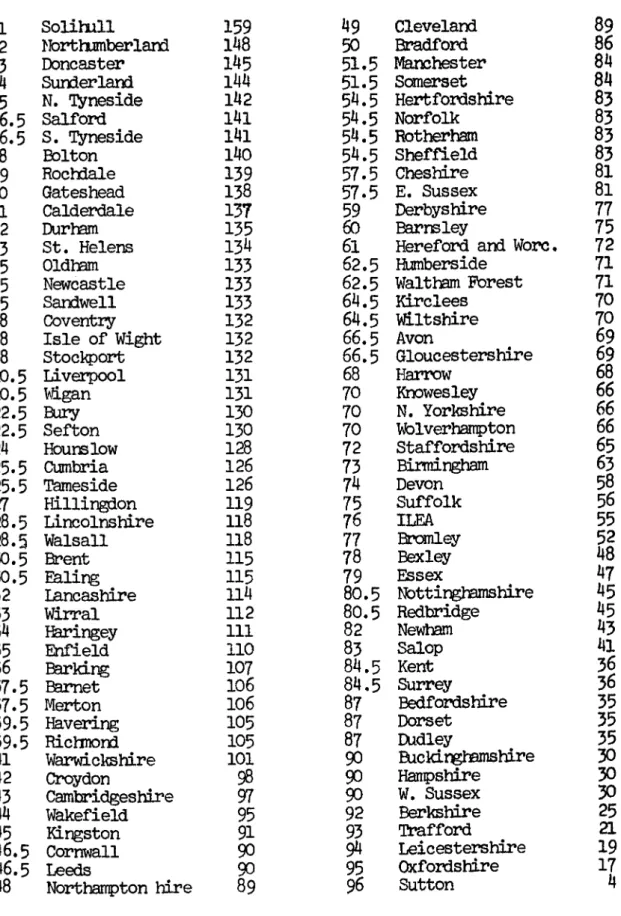
Viewed superficially,the distribution of reception classes shovm in Table 4
has much in conmon with the distribution of local authority nursery schools
and nursery classes. The highest ranking authorities are predominantly the
metropolitan districts while the non-metropolitan counties generally merge
with the smallest levels of provision. However, closer inspection reveals
that the individual rankings of marc/ authorities are very different to those
for nursery schools and nurserj' classes. For example, Manchester, the ILEA,
Birmingham^ Walsall, Barnsley, Rotherham and Wolverhanpton rank high in terms
of nursery school and rursery class provision but lave lower ranks for rec^tion
classes. Conversel,y, Solihull, Nbrt lumber land, Gateshead and St. Helens rank
high in terms of recq)tion classes but make lower levels of nursery school and
rursery class provision. There is clearly a possibility of substitution
between these services in certain instances. Nevertheless, despite these
excgjtiore and numerous ctarges of ranl^ in overall terms^ it would seen that
local authorities which provide high levels of nursery schools and rursery
classes also provide larger numbers of places in recg)tion classes and the
reverse applies in the authorities v M c h make much smaller levels of
provision.
DAY NURSERIES
Table 5 shows tte rahkirgs for the other major aspect of local authority
pre-school provision - the rumber of places in day nurseries provided by
26
RANK RANK
1 Solihull 159 49 Cleveland
2 Iforthumberland 148 50 Bradford
3 Doncaster 145 51.5 Manchester
4 Sunderland 144 51.5 Scxnerset
5 N. TVneside 142 54.5 Hertfordshire
6.5 Salford I4l 54.5 Norfolk
6.5 S. I^neside 141 54.5 Rotherham
8 Bolton 140 54.5 Sheffield
9 Rochdale 139 57.5 Cheshire
10 Gateshead 138 57.5 E. Sussex
11 Calderdale 137 59 Derbyshire
12 Durham 135 60 Barnsley
13 St. Helens 134 61 Hereford and Wore.
15 Oldham 133 62.5 Humberside
15 Newcastle 133 62.5 Waltham Forest
15 Sandwell 133 64.5 KLrclees
18 Coventry 132 64.5 Wiltshire
18 Isle of Wight 132 66.5 Avon
18 Stocl^ort 132 66.5 Gloucestershire
20.5 Liverpool 131 68 Harrow
20.5 Wigan 131 70 Riowesley
22.5 Bury 130 70 N. Yorkshire
22.5 Sefton 130 70 Vfolverharrpton
24 Ifounslow 128 72 Staffordshire
25.5 Cumbria 126 73 Birmingham
25.5 Tameside 126 74 Devon
27 Hillingdon 119 75 Suffolk
28.5 Lincolnshire 118 76 ILEA
28.5 Walsall 118 77 Bronley
30.5 Brent 115 78 Bexl^
30.5 Ealing 115 79 Essex
32 Lancashire 114 80.5 Nottinghamshire
33 Wirral 112 80.5 Redbridge
34 Haringey 111 82 Newham
35 Enfield 110 83 Salop
36 Barkirg 107 84.5 Kent
37.5 Bamet 106 84.5 Surrey
37.5 Merton 106 87 Bedfordshire
39.5 Ifeverlng 105 87 Dorset
39.5 Riclmond 105 87 rudley
41 Warwickshire 101 90 Buckinghamshire
42 Croydon 98 90 Hanpshire
43 Cambridgeshire 71 90 W. Sussex
44 Wakefield 95 92 Berkshire
45 Kingston 91 93 Trafford
46.5 Cornwall 90 94 Leic^tershire
46.5 Leeds 90 95 Oxfordshire
48 Nbrthanpton hire 89 96 Sutton
89
86
84 84 83 83 83 83 81 81 77 75 72 71 71 70 70 69 6968
66
66
66
65 63 58 56 55 52 48 47 45 45 43 41 35 35 35 30 30 30 25 21 19 17 4Table 4 Rankings of reception class places for the under "fives in the
27
inner London boroughs and they easily doninate the ranks of highest providers,
The rest of the data once again confiiro the distinction between the rdatively
high levels of provision in the metrapolitan districts and the lower levels of
provision in the norrtnetropolitan counties. However, the rankings are by no
mewis identical to the ranking of mrsery school and nursery class provision.
As Pig. 4 emphasises the distribution of day mrsery places is highly skewed
in conparison with local authority nursery schools and mrsery classes. The
London boroughs and metropolitan districts in I>1anchester, Liverpool and
Brnningham have verjf high levels of places compared with much lower levels in
the rest of the authorities. Nevertheless^the distinction between the
metropolitan districts and the non-metropolitan counties appears to anerge
with greater clarity in the case of local authority day nurseries. Tte nonr
metropolitan counties with the highest provision of day nurseries include
Lancashire, Leicestershire and Nottinghamshire - all areas with urban centres
and histories of female aiploymenfc in textile factories. The other major
exceptions to the general trend are of course the metropolitan districts with
relatively low provision levels. These include Rotherham, Dudley, Doncaster,
N. I^neside, Bexley, Sutton^ St. Helens, Solihull, Sandwell, Enfield,
Wolverhairpton, Walsall, Gateshead, Redbridge, Croydon, Bury and Wigan.
Blacks tone argued, on the basis of her analysis^ that mrsery schools and
nursery classes and day nurseries were not generally regarded as substitutable
ty local authorities. There would also seen to be little evidence of
substitution effects in this context for although there are numerous changes
of ranks, by and large the authorities which provide relatively high levels
of mrsery education also provide high levels of day nurseries. In contrast,
there are a large number of nonnnetropolitan counties and a smaller number of
metropolitan districts that provide small amounts of either service. However,
the relationship is by no means a sinple one. First, there are a number of
metropolitan districts v M c h rank low in terms of m^rsery education places but
highly in terms of day nursery places. These include Trafford, Knowesl^ and
Richnond. Conversely» there are a group of metropolitan districts including
Rotherham, Dudley an! Doncaster with high levels of mrsery education but low
levels of d%r nurseries.
PLAYGROUPS
A much more irrportant form of substitution may be that between the private and
public sectors, for as with other forms of local service,it may be that some
28
1 Camden 95 54.5 Redbridge 8
2 Islington 62 54.5 Sunderland 8
3 Westminster 60 60 Bedfordshire 7
4 Kensington 54 60 Cheshire 7
5 Hairmersmith 50 60 Derbyshire 7
6 Brent 42 60 Gateshead 7
7 Southwark 41 60 Sheffield 7
8 Tower Hamlets 40 60 Walsall 7
10 Ifeckn^ 37 60 Wolverhampton 7
10 Lambeth 37 6 5 Enfield 6
10 Manchester 37 65 Hertfordshire 6
13.5 Knowesley 29 6 5 Sandwell 6
13.5 Liverpool 29 69 Cambridgeshire 5
13,5 Tameside 29 69 E. Sussex 5
13.5 Wandsworth 29 69 Solihull 5
l6 Trafford 26 69 St. Helens 5
17 S. lyneside 20 69 Sutton 5
20.5 Birmingham 19 75.5 Bexley 4
20.5 Coventry 19 75.5 Cumbria 4
20.5 Harirgey 19 75.5 Durham 4
30.5 Waltham Forest 19 75.5 Hampshire 4
22 Ealing 18 75.5 N. Yorkshire 4
23 Lewisham 17 75.5 Staffordshire 4
25 Lancashire 16 75.5 Surr^ 4
25 Rochdale 1 6 75.5 Wakefield 4
25 Salford 16 8 2 . 5 Eromley 3
28 Barking 15 82.5 Dorset 3
28 Merton 15 82.5 Essex 3
28 Richmond 15 82.5 N. lyneside 3
33 Bradford 14 82.5 Oxfordshire 3
33 Hillingdon 14 82.5 Sonerset 3
33 Hounslow 14 89.5 Berkshire 2
33 Newcastle 14 89.5 Devon 2
33 Newborn 14 89.5 Gloucestershire 2
33 Oldtam 14 89.5 Humberside 2
33 Sefton 14 89.5 Lincolnshire 2
38 & m e t 13 89.5 Northamptonshire 2
38 Bolton 13 89.5 Northumberland 2
38 Greenwhich 13 89.5 Suffolk 2
4l Calderdale 12 95 Buckinghamshire 1
4l Kirgston 12 95 Ifereford and Wore. 1
4l Havering 12 95 Norfolk 1
43.5 Cleveland 10 1 0 2 . 5 Broml^
-43.5 Wirral 10 102.5 Cornwall
-48.5 Avon 9 102.5 Doncaster
-48.5 Harrow 9 102.5 Dudley
-48.5 Kirclees 9 102.5 Isle of Wight
-48.5 Leeds 9
48.5 Leicestershire 9 102.5 Rotherham —
48.5 Nottinghamshire 9 1 0 2 . 5 Salop
-48.5 Stockport 9 102.5 Warwickshire —
48.5 Wigan 9 1 0 2 . 5 W. Sussex —
54.5 Bury 8 102.5 Wiltshire
-54.5 Croydon 8 107 Kent *
T^ble 5 Ranldr^s of local authority nursery places in the English