Comparative Study of Radial and Ring Type Distribution System
Kavya G
1, Dr Ashoka H N
21
PG Student, EEE Dept., UBDT College of Engineering Davangere, Karnataka, India.
2
Associate Professor, EEE Dept., UBDT College of Engineering, Davangere, Karnataka, India.
---***---Abstract - This paper presents a comparative study of radialand ring type electrical power distribution system. Power distribution systems play a significant role, since it is the main link between the power substation and the consumers. Presently power distribution system is done by the radial type system and it has only one path for power flow from distribution substation and to the particular load. The another type of power distribution is ring system and it has one or more paths between the distribution substation and the load. This increases the reliability over the radial distribution system by the quality supply. A five bus distribution system is considered to compare the two different type of systems. The module of distribution system is implemented using the MATLAB/SIMULINK R2018a. The experimental results reveal that the ring type distribution system is more reliable compare to that of the radial distribution system.
Key Words: Radial distribution system, Ring type distribution system, reliability, quality supply
1. INTRODUCTION:
Power distribution systems play a significant role, since it is the main link between distribution substations and the consumers. This system is divided into radial, ring and interconnected system on the scheme of operation. The radial distribution systems (RDS) are commonly used in power distribution. It has only one power flow path between distribution substation and to a particular load. A failure at any point on the radial distribution system cause interruption to most of the loads to ensure continuity of supply, an alternative path for power supply should be provided. This is made possible by converting the radial distribution system into ring type distribution system. It improves the power system conditions in the best possible way by opening and closing the available switches provided at the tie lines. The supply sources to loads connected to load buses are adapted to reduce voltge drop VD, get better bus
voltage profile, and this increases in quality supply of the system.
In recent years, there has been a significant growth in the reconfiguration of radial distribution system that is A. K. Saonerkar et al., [1], discussed optimized distribution loss evaluation in ring main distribution system with Distributed Generation (DG) placement, reconfiguration and capacitor placement using Genetic Algorithm (GA). Compare results obtained with Radial Distribution System (RDS) and Ring Main Distribution System (RMDS) and proves that loss can be minimized just by modifying the type of distribution
Protection Requirements of Active Distribution Networks Using Radial and Ring Operations”. This the impact of distributed generation on the setting of protective devices of distribution networks that originally operated in radial mode and then switched to ring mode and to compare the protection requirements for the two modes of operations.
Aman et al., [11], discussed a very detailed overview of optimum shunt capacitor bank (SCB) placement techniques. Six different approaches of optimum SCB placement based on minimization of power losses, weakest voltage bus approach and maximization of system loadability will be applied on four different radial distribution test systems.
Prakash and Sydulu [8] implemented the particle swarm optimization to determine the optimal allocation of capacitor. In this method a meta heuristic parallel search technique for estimation of required level of shunt capacitive compensation to improve the voltage profile of the system and reduce active power loss(12)Kannana et al., [13]. Proposed optimal sizing of capacitor using Differential Evolution (DE) and Multi Agent Particle Swarm Optimization (MAPSO), whereas optimal location by using fuzzy expert system. Abul’Wafa et al.,[14] proposed a combined fuzzy expert system for capacitor location and real coded GA for capacitor sizing. Amir Alipour et al., [15], discussed a “Study in the Impact of Distributed Generator (DG) Placement and Sizing on a Ring Distribution Network”. Here Analysis of variance (ANOVA) was used to speed up the data gathering and statistical treatment of the study. This gives the penetration of DGs in a system affects the fault currents regardless where the fault occurs. Although, the fault current contribution of the DGs depends greatly on where the fault is located
In view of this, reconfiguration of the radial distribution system[2-5] is done by using various methods like Genetic Algorithm (GA), meta heuristic Harmony Search Algorithm (HSA) and binary particular swarm optimization algorithm (BPSO) by maintain the radial nature of the system. The main drawback of the these methods are radial distribution system are feed at only one point, so fault close to feeding end cause interruption to most of the loads. Hence radial distribution system converting them to ring main distribution system to shrink voltage drop , get better bus voltage profile and increase the reliability of the system like that various phenomenal advantage which will be highlighted through results in this paper.
3. FIVE BUS RING DISTRIBUTION SYSTEM
The distribution system is represented by single line diagram. The basic single line diagram of a 5 Bus ring type distribution system is shown in Figure 1. It has been used for implementation for converting radial type into ring type distribution system to get better voltage profile at all the load buses by adding different number of sources. The network lines are provided with breakers by switching them that are capable of connecting or disconnecting any lines as per the situations prevailing.
Fig.1: Single line diagram of 5 Bus ring distribution system
[image:2.595.314.558.58.200.2]The Fig.1 consists of 5 Bus distribution system in which three supply sources are given at bus 1, 2 and 3. These buses are connected each other by transmission line L1, L2, L3, L4 and L5 and there parameters are represented in Table 2. Each buses consist of load and load parameters are represented in Table 1.This simulink model is developed by using electrical components from the MATLAB SIMSCAPE power system.
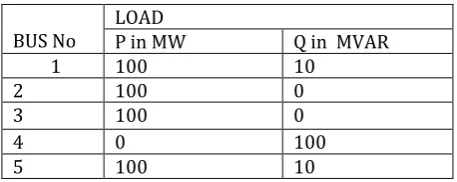
Table 1: Load Parameters of 5 Bus ring distribution systems
BUS No LOAD P in MW Q in MVAR
1 100 10
2 100 0
3 100 0
4 0 100
5 100 10
The above Table 1 gives details of load parameters of 5 Bus ring distribution system. Here each buses contains a load that is resistive inductive load is present at bus 1 and bus 5, resistive load is present at the bus 2 and bus 3, and only inductive load is present at the bus 4.
Table 2: Transmission line parameters for 5 Bus Ring Distribution System
Fro m nod e
To
node Distance in km Resistance in ohm Inductive reactanc e in ohm
Capacitive reactance in ohm
1 2 0.75 0.95475 21.9997 3331.34 2 3 0.50 0.6365 14.665 4997.02 3 4 0.80 1.0184 23.4664 3123.13 4 1 1 1.273 29.3331 2498.5
[image:2.595.320.549.366.457.2]3.1. SIMULATION MODEL:
The simulation model of 5 bus ring distribution system is shown in Fig 2. This simulation is carried out using MATLAB simulink. This model is considered for comparative study of radial and ring distribution system. Further the detailed construction, inputs and output analysis of each block of simulation circuit are described in this section.
Fig.2: 5 bus Ring Distribution System
The above Fig.2 is the simulation model of 5 bus ring distribution system. It consists of components like generating sources, load flow buses, unbalanced three phase loads, asymmetrical distributed lines and breakers. POWERGUI tool box uses discrete type. A three phase programmable voltage source with 50Hz frequency is connected to swing bus 1 through three phase series RL branch with 230kV as a input voltage. The grid is represented by a voltage source with short circuit level of 8500MVA and these three phase series RLC branch use the 'Branch type' parameter to add or remove elements from the branch. Source 2 is connected at bus 2 with base voltage 230kV, phase angle 9.2 degrees, X/R ratio is 8 and short circuit level of 6500MVA and Source 3 is connected at bus 3 with base voltage 230kV, phase angle 9.2 degrees, X/R ratio is 10 and short circuit level of 9000MVA. Each bus are connected through N-phases distributed parameters line and these lines resistance and reactance (in ohm) are represented in Table 2. Transmission line consists of breakers as show in Figure 1 where “switch SW1” is connected between bus 1 and bus 5 which is used to convert the radial system into ring type system. The “switch SW2” is connected at bus 2 and “switch SW3” is connected at bus 3 which used to connect the supply sources to system.. The transmission lines are switched by changing breaker status of both the ends. Each buses contains a load that is resistive inductive load is present at bus 1 and bus 5, resistive load is present at the bus 2 and bus 3, and only inductive load is present at the bus 4. The load parameters are represented in Table1.These all the components selected from simulink library and placed on the model page after all connection are connected to the components go to start the simulation and give stop time as 1.8 min after one minute the simulation results are obtained.
4. SIMULATION RESULTS AND DISCUSSION:
In this section simulation results of comparative study of radial and ring type distribution system is discussed. The 5 Bus radial distribution simulink model is carried out using MATLAB simulink to analysis its results considering number of sources at load buses. Afterwards its converted into ring type distribution by switching them that are capable of connecting or disconnecting any lines as per the situations prevailing. This is has been shown in Fig 2.The improved voltage profile and reduction in voltage drop VD is illustrated
in the following section.
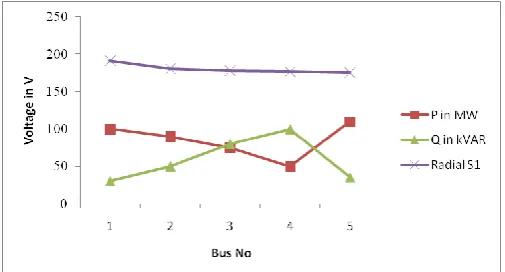
The radial distribution system operation with single is done by opening the “switch S1” and its converted into ring main distribution by closing “switch SW1” from the Fig 2 and is given a single supply by opening the “switch SW2” at bus 2 and “switch SW3” at bus 3. The supply source is connected at the bus 1 this is a swing bus. The bus voltage at each node for radial distribution system is show in Fig.3.
Fig.3: radial distribution model with single source
The Fig.3 shows the graph of voltage versus buses. This figure contains respective active power (P in MW), reactive power(Q in kVAr) and voltage at each node. The voltage at each node 1,2,3,4, and 5 is 191.47V, 180.6V, 178.1V, 176.6V and 175V respectively. From this voltage is gradually decreases from bus 1 to bus 5 that is 191.47V to 175V.
[image:3.595.37.288.201.352.2] [image:3.595.308.561.334.470.2]Fig.4: comparing voltages of radial with 1 source and radial with 2 sources
In Fig.4, Radial S1 means radial system model with single source and Radial S2 means radial system with two sources. In radial with two sources, voltage at each node 1,2,3,4, and 5 is 192.7 V,186.5V,184V,182.5V and 180.8V respectively. From this, radial with two sources has maximum voltages as compared to radial with single source. In this also voltages gradually decreases from bus 1 to bus 5.
The radial distribution system operation is done by opening the “switch SW1” and here given a three supply sources by closing the “switch SW2” and switch SW3” as shown in Fig 2. The radial with 1 source and 2 sources still have very low voltages at each node so hence to increase voltage at all the buses again by adding another supply source at bus 3 with 230kV as a input voltage. The grid is represented by a voltage source with short circuit level of 9000MVA. The comparing voltage of radial distribution system with 1, 2 and 3 sources is shown in Fig.5.
Fig.5: comparing voltage of radial distribution system with 1, 2 and 3 sources
In Fig.5, Radial S3 means radial system model with three source. In radial distribution system with three sources, voltage at each node 1,2,3,4, and 5 is 192.86V,187.46V,187V,185.5V and 183.7V respectively. From this, radial with three sources has maximum voltages at each nodes compared to radial with single source and two sources. The difference between voltage of radial with 1 source and radial with 3 sources is more. This shows that voltage is increases with increase in sources.
In the above radial distribution system model the voltage at all the buses is very low and also more voltage variations at the buses so that to enhance the voltage in radial system compensative devices added and become very complicate. So that in this paper radial distribution model is converted into ring mode operation by closing the “switch SW1”. This is shown in Fig 2 with single source by opening the switch SW2 and SW3. The comparing voltages of radial with 1 sources and ring with 1 sources is shown in Fig.6.
Fig.6: comparing voltages of radial with 1 sources and ring with 1 sources
In Fig.6, Ring S1 means ring system model with single source. In ring distribution system with single sources, voltage at each node 1,2,3,4, and 5 is 181.75V,180.6V,180.7V,181.6V and 181.75V respectively. When compared with radial with single source, voltage at the bus 1 and 2 is similar but at the bus 3, 4 and 5 has maximum voltage in ring distribution system model. The voltage at the bus 5 is 191.47V that is same as the bus 1 in ring distribution system so that voltage fluctuation is less at the last point of the consumers.
The ring distribution system model operation is done by closing the “switch SW1” and given a two supply sources by closing the “switch SW2” and opening the “switch SW3” as shown in Fig 2. When compared with radial distribution model cases 1 ,2, 3 and case 4 still voltage at all the buses is very low hence here another supply source is added at bus 2 so we get maximum voltages when compared with radial distribution system and ring with single source. The comparing voltage of radial with 2 sources and ring system model with 1 & 2 sources is shown in Fig.7.
In Fig.7, Ring S2 means ring system model with two sources. In ring distribution system with two sources, voltage at each node 1,2,3,4, and 5 is 195V,201.3V,200V,198.5V and 195V respectively. The voltages of radial model with 2 sources are decreases from bus 1 to bus 5. In ring distribution model with 1 sources, bus 1 and bus 5 has same voltage which are high compared with other bus voltages and in ring model with 2 sources bus 1 and bus 5 has same voltage which are low compared with other bus voltages of same model but these all voltages are maximum when compared with radial with 2 sources and ring with 1 sources.
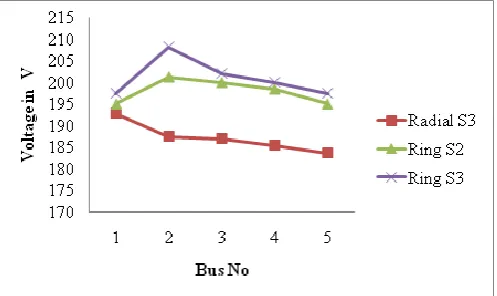
The ring distribution system model operation is done by closing the switch 1 and here given a three supply sources by closing the switch 2 & switch 3 as shown in Fig 2.In all the above discussion, very low voltages that is less than 230V. So that 3 three sources added for the ring distribution model. Hence maximum voltage is obtained when compared with all the above discussion. The comparing voltages of radial system model with 3 sources and ring distribution model with 2 & 3 sources. The comparing voltages of radial system model with 3 sources and ring distribution model with 2 & 3 sources is show in Fig.8.
Fig.8: comparing voltages of radial system model with 3 sources and ring distribution model with 2 & 3 sources
In Fig.8, Ring S3 means ring distribution model with three sources. The ring distribution system with three sources, voltage at each node 1,2,3,4, and 5 is 197.5V, 208.2V, 202V, 200V and 197.5V respectively. From this, voltage fluctuations are less as compared with radial system model. And also voltage is increased and maintained contingency at each node. This shows that voltage is increases with increase in number of sources and also ring distribution system is better than radial distribution system. Comparison of Voltage drop VD at all the buses between radial and ring type
distribution system are listed in table 3.
Table 3: Comparison of Voltage drop VD at all the buses
between radial and ring type distribution system
Cases Total Voltage Drop VD in V
Radial with 1 sources 49.646 Radial with 2 sources 44.7
Radial with 3 sources 42.436 Ring with 1 sources 44.72 Ring with 2 sources 32.04 Ring with 3 sources 28.87
In above Table 3 gives the total voltage drop VD for the
different cases that is radial with source 1, source 2and source 3 and ring with source 1, source 2and source 3. This shows that voltage drop decreases with increased in number of sources but when comparing radial and ring distribution system voltage drop is very low in ring distribution system.
6. CONCLUSION
From the results, voltage at each node is very less in radial distribution system as compared to ring type system. In radial system voltage drop is more compared to ring type. Hence by converting radial into ring type distribution system by switching the breakers. The ring type distribution system gives the better quality of supply, maintained the voltage profile and voltage fluctuation will be less in the last point of the consumers, the voltage drop is also less along the distribution line as compared with radial system.
7. REFERENCES
[1] A. K. Saonerkar, B. Y. Bagde, “Optimized DG Placement in
Ring main Distribution System with Reconfiguration and Capacitor Placement Using GA,” in Proc. ICACCT, IEEE Conf., pp. 1077-1082, May 2014.
[2] R. Srinivasa Rao, K. Ravindra, K. Satish, and S. V. L.
Narasimham, “Power Loss Minimization in Distribution System Using Network Reconfiguration in the Presence of Distributed Generation,” IEEE Trans. Power Sys., vol. 28, no.1, pp. 317-325, Feb 2013.
[3] Mohammad Ali Hormozi, Mohammad Barghi Jahromi,
Gholamreza Nasiri. Optimal Network Reconfiguration and Distributed Generation Placement in Distribution System Using a Hybrid Algorithm. International Journal of Energy and Power Engineering. Vol. 5, No. 5, 2016, pp. 163-170. doi: 10.11648/j.ijepe.20160505.11
[4] M. E. Baran and F. Wu, “Network reconfiguration in
distribution system for loss reduction and load balancing,” IEEE Trans. Power Del., vol. 4, no. 2, pp. 1401–1407, Apr. 1989.
[5] Pyone Lai Swe. Feeder Reconfiguration and Distributed
Generator Placement in Electric Power Distribution Network. American Journal of Electrical and Computer Engineering. Vol. 2, No. 2, 2018, pp. 56-63. doi: 10.11648/j.ajece.20180202.16
[6] J. Z. Zhu, “Optimal reconfiguration of electrical
distribution network using the refined genetic algorithm,” Elect. Power Syst. Res., vol. 62, pp. 37–42, 2002.
[7] Jizhong Zhu, Xiaofu Xiong, Davis Hwang, and Ali
[image:5.595.38.287.372.520.2][8] M.Saradarzadeh, S.Farhangi, J.L.Schanen,P-O.Jeanni and
D.Frey, “The benefits of looping a radial distribution system with a power flow controller” IEEE international conference on power and energy 2010, https://doi.org/10.1109/PECON.2010.5697674
[9] J. Lavaei, S. Low, “Relationship between power loss and
network topology in power sytems,” IEEE Conf. on Decision and Control, pp.4004-4011, December 15-17, 2010.
[10] S.K. Salman and S.F. Tan, “Comparative Study of
Protection Requirements of Active Distribution Networks Using Radial and Ring Operations” IEEE PowerTech 2007
[11] Aman M.M, Jasmon G.B., Bakar A.H.A, Mokhlis H., Karimi
M. ‘Optimum shunt capacitor placement in distribution system-A review and comparative study’. Renewable and Sustainable Energy Reviews 2014;30: pp.429–439
[12] Prakash K., Sydulu M. ‘Particle swarm optimization
based capacitor placementon radial distribution system’. In Proceedings of IEEE power engineering society general meeting; 2007. pp. 1–5.
[13] Kannana S. M., Renugab P., Kalyania S., Muthukumarana
E., ‘Optimal capacitor placement and sizing using Fuzzy-DE and FuzzyMAPSO methods’. Applied Soft Computing 2011;11: pp.4997–5005
[14] Abul’Wafa A., R. ‘Optimal capacitor placement for
enhancing voltage stabilityin distribution systems using analytical algorithm and Fuzzy-RealCoded GA’. International Journal of Electrical Power and Energy System 2014; 55: pp.246–252.
[15] Amir Alipour, Christian Alexander C. Asis, Jefferson