Effect of Different Calcination Process and Gd
2
O
3
as
Impurities on the Different Phases of Bi-Based
Superconductor
Ahmad Amirabadizadeh1*, Sara Memarzadeh1, Naser Tajabor2, Hadi Arabi1
1Department of Physics, Faculty of Science, University of Birjand, Birjand, Iran; 2Department of Physics, Faculty of Science,
Ferdowsi University of Mashhad, Mashhad, Iran. Email: *[email protected]
Received February 18th,2012; revised March 25th, 2012; accepted April 3rd, 2012
ABSTRACT
In this research two samples of a nominal composition Bi1.6Pb0.4Sr2Ca2Cu3Ox were prepared by the solid state reaction
method, using two different routes. Codes A and B are used to refer to the two samples. In preparing sample A, the standard method for calcination was used, while for sample B, the SrCO3 and CaCO3 were calcinated at 1100˚C for 3 h.
Calcination was done separately on SrCO3 and CaCO3 in order to eliminate CO2. Then after mixing and grinding, the
powder mixtures of Bi2O3, CuO, PbO, SrO and CaO were calcinated at 840˚C for 70 h. Also, the samples (samples C)
of nominal compositions Bi1.6Pb0.4Sr2Ca2Cu3Ox + % x Gd2O3 (% x = 0, 3, 5, 7 and 9) have been synthesized by this
method. The XRD and SEM results show that addition of Gd2O3 helps to increase the amount of Bi-2212 phase, while
alternative calcination process improves the formation of the Bi-2223 phase. In addition, the AC susceptibility meas-urements confirm the XRD and SEM results.
Keywords: Bi-Pb-Sr-Ca-Cu-O System; X-Ray Diffraction; Scanning Electron Microscopy; AC Susceptibility
1. Introduction
The Bi-Pb-Sr-Ca-Cu-O system exhibits three different superconducting phases of (Bi-Pb)2Sr2CuOx (Bi-2201),
(Bi-Pb)2Sr2CaCu2Ox (Bi-2212) and (Bi-Pb)2Sr2Ca2Cu3Ox
(Bi-2223), which show critical temperatures (Tc) of about
10, 80 and 110 K, respectively [1-3]. In the BSCCO sys-tem, the Bi-2212 phase is thermodynamically stable over a wide temperature range and among the three members of the BSCCO family the Bi-2212 and Bi-2223 phases have been the most extensively studied to date. In con-trast to the Bi-2212 phase, the Bi-2223 phase is stable only in an extremely narrow temperature range and thus it is difficult to prepare single phase Bi-2223 ceramics [4]. Usually, in polycrystalline Bi-based superconducting preparations, these two phases tend to co-exist. The cal-cination process used in this research for Bi-based mate-rials helps to increase the amount of the Bi-2223 phase relative to the amount of the Bi-2212 phase.
Effect of rare earth and some oxide as impurities or substitution of them for Bi and Sr in polycrystalline Bi- based superconductor’s properties such as Tc and Jc have
been investigated by several researchers [5-15]. Here we have studied the effect of Gd2O3 as impurities on the
general formula of Bi1.6Pb0.4Sr2Ca2Cu3Ox + Gd2O3
com-posites and investigated the addition of these impurities on different phases of Bi-Based superconductor.
2. Experimental
2.1. Different Calcination Process
In the usual solid state reaction method for producing Bi-based superconductors, calcination stage is used to eliminate the carbonates and to produce an oxide with a nominal composition (Bi-Pb)2Sr2Can-1CunOx [7].
Calcina-tion of powder mixtures of Bi2O3, CuO, PbO, SrCO3 and
CaCO3 is performed at temperatures less than or equal to
900˚C. The decomposition temperatures for CaCO3 and
SrCO3 are 900˚C and 1290˚C, respectively [16]. Therefore,
elimination of CO2, at 850˚C, from this mixture, can take
a long time; but if the calcination temperature is increased, the mixture could melt.
In this research, two samples of nominal compositions Bi1.6Pb0.4Sr2Ca2Cu3Ox were prepared by the standard solid-
state reaction method and by using two different routes. Codes A and B are used to refer to the samples. In pre- paring sample A, the oxide powders (Bi2O3, PbO, SrCO3,
CaCO3 and CuO), taken in stoichiometric proportions,
were ground and calcinated at 840˚C for 70 h. The powders
were well mixed and ground in an agate mortar and pes-tle and pressed into pellets (15 mm in diameter and 2 mm in thickness) and sintered at 850˚C for 230 h with four intermediate grinding processes. The chosen rate of tem-perature increase and decrease was 2˚C-min−1. For
sam-ple B, the SrCO3 and CaCO3 were calcinated at 1100˚C for
3 h. The calcination was done in order to eliminate CO2
separately for SrCO3 and CaCO3. Then after mixing and
grinding, the powder mixtures of Bi2O3, CuO, PbO, SrO
and CaO were calcined at 840˚C for 70 h. The conditions for the second stage of calcination and sintering were similar to those for sample A.
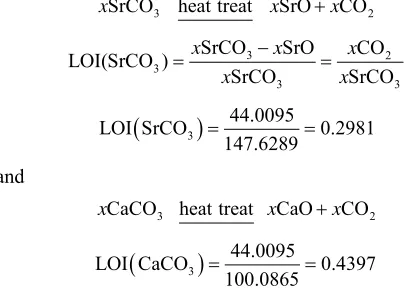
The amount of residual of CO2 can be measured by the
LOI (loss on ignition) coefficient. Loss on ignition is a test used in inorganic analytical chemistry, particularly in the analysis of minerals. It consists of strongly heating (igniting) a sample of the material at a specified tempera-ture, allowing volatile substances to escape until its mass ceases to change. The process may be repeated to show that mass-change is complete. LOI is defined as [17]:
W W LOI W
where W and are the weight of the sample before heat treatment and the weight of the sample after heat treatment, respectively. Hence
W
3
SrCO heat treat SrO CO
x x x 2
3 2
3
3
SrCO SrO CO
LOI(SrCO )
SrCO SrCO
x x x
x x
3
3
44.0095
LOI SrCO 0.2981
147.6289
and
3
CaCO heat treat CaO CO
x x x 2
3
44.0095
LOI CaCO 0.4397
100.0865
where x in the above equations is used to denote the mol
number of the indicated materials and the coefficient LOI is constant for each desired amount of the composition. The samples A and B are compared to determine the ef-fect of further calcination stage in B sample on the for-mation of the Bi-2223 phase.
2.2. Addition of Gd2O3 as Impurities
The Bi1.6Pb0.4Sr2Ca2Cu3Ox + % x Gd2O3 (% x = 0, 3, 5,
7 and 9) composites were papered by two steps. First, the (Bi-Pb)2Sr2Ca2Cu3Ox was synthesized by conven-
tional solid-state reaction method. High purity (99.5%), Bi2O3, PbO, SrCO3, CaCO3 and CuO powders were
mixed in the appropriate stoichiometric ratio and grind-
ing in an agate mortar. The well-mixed powders were calcined at 840˚C for 70 h. Finally, after regrinding the (Bi-Pb)2Sr2Ca2Cu3Ox and Gd2O3 powders, the ap-
propriate amounts of these powders were mixed and a homogenous powders were pressed in pellets and sintered at 850˚C for 230 h. Sample codes (C000, C003,
C005, C007 and C009) are used to refer to the samples. The X-ray diffraction (XRD) studies were preformed
with Cu-Kα radiation. The surface morphology of sam- ples, which is an important surface property and very useful for understanding their defect structure, grain size, voids, etc., was studied by scanning electron mi- croscopy (SEM). Finally, cylindrical specimens were cut from the sintered samples and used for AC sus-ceptibility measurements. The real part of the AC susceptibility was measured with a Lake Shore Model 7000 AC susceptometer. The measurements were per-formed at a frequency of 333.3 Hz as a function of temperature at fixed AC magnetic field amplitude of 500 A/m. The AC field was applied parallel to the cy-lindrical axis.
3. Results and Discussions
3.1. Effect of Different Calcination Process
[image:2.595.59.263.409.553.2]3.1.1. X-Ray Diffraction
Figure 1 shows the indexed X-ray diffraction patterns
for samples A and B. The majority of the diffraction lines correspond mainly to Bi-2223 and Bi-2212 and the unit cells are orthorhombic for both samples. Due to the co-existence of Bi-2212 phase with Bi-2223 phase, a quan-titative analysis is often required to estimate the amount of Bi-2212 and Bi-2223. XRD is the most widely used method for this kind of quantitative phase analysis. The volume fraction of Bi-2223 and Bi-2212 phases can be estimated using various methods. Some workers [18-20] have used (002) and (115) or (0010) and (008) peaks of Bi-2223 and Bi-2212 phases, respectively, and others [21] used all the peaks of the Bi-2223 and Bi-2212 phases for the estimation of the volume fraction. Here the (0010) and (008) peaks of Bi-2223 and Bi-2212 phases are used to estimate the volume fraction of the phases present. The fractional amount of the Bi-2223 phase relative to the Bi-2212 phase could be estimated from the intensities according to:
(0010)
Bi-2223% 0010 (008) I I I
(008)
Bi-2212% 0010 (008) I I I
where I is the intensity of peaks corresponding to the
Figure 1. XRD patterns for samples A and B after the final stage of the heat treatment.
corresponding volume fractions are 21% and 39%, respec-tively. This shows that further calcination favors the for-mation of Bi-2223 phase.
3.1.2. SEM Studies
The scanning electron micrographs of the samples after the final sintering step are shown in Figures2(a) and (b).
It is clear from these figures that the superconducting grains seem to be connected with each other while there are some unfilled spaces among them. The grain size and the dis-tribution of grains on the surface of the samples are quite different. The surface of sample A is smoother and denser, while that of sample B has larger grains and more voids. Khalil [22,23] reported that the decrease of porosity might be related to an increase in (a) grain coupling strength and (b) degree of grain orientation of the BSCCO sam-ples. On the other hand, Tampieri et al. [24] reported that
the Bi-2212 phase has higher crystallographic density and stronger intergranular links than the Bi-2223 phase. Char-acteristic flaky grains of (Bi,Pb)-2212 and plate-like grains which are the typical grain structure of (Bi,Pb)-2223 are visible in both samples. Here the layered structure is only partially maintained with reduction in grain size and tex-ture. In the XRD patterns of the samples, it is seen that sample B contains more Bi-2223 phase than sample A. Therefore, the highest density value would be expected for sample A. Here, the grains become more compressed and closely packed leaving a large number of inter-grain voids. These results agree with those obtained by XRD. The average grain size at different spots of the samples is between 1 and 9 µm. The size of the largest particle in sample B is almost twice as large as in sample A.
3.1.3. AC Susceptibility Studies
Positioning For the superconducting samples, the real part of the AC susceptibility was measured after the final sintering step. The real part of the AC susceptibility
versus temperature for samples A and B is shown in Fig- ure 3. The superconducting transition temperature was
determined from the onset of the diamagnetic signal. The diamagnetic transition in the real part of the AC suscepti-bility occurs sharply at Tc (onset). The onset temperature of
both samples lies between 108 and 110 ± 1 K. Curves A and B show that initially both phases of Bi-2223 and Bi-2212 are present in the samples. The sharper transi-tion observed in sample B suggests that this sample pre-sent a higher superconducting fraction of 2223 than sam-ple A. But the actual estimate of superconducting volume fraction is not possible by this experiment [5,11].
T 3.2. Effect of Gd2O3 as Impurities
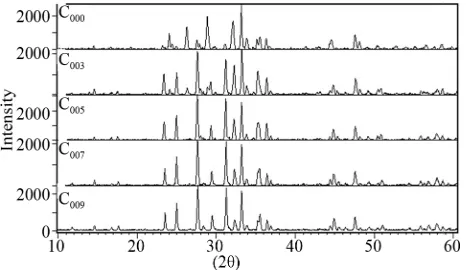
[image:3.595.309.540.387.499.2]3.2.1. X-Ray Diffraction
Figure 4 shows the X-ray diffraction patterns for C000,
C003, C005, C007 and C009 samples. The Bi-2223 and Bi-2212
[image:3.595.309.539.537.706.2]phases co-exist in the composites. The majority of the diffraction lines correspond mainly to Bi-2223 and Bi-2212 and the unit cells are orthorhombic for all samples. The fraction amount of the Bi-2223 phase relative to the Bi-2212 phase were estimated from the intensities as Section 3.1.1:
Figure 2. SEM photograph for (a) A sample; and (b) B sample.
Figure 4. XRD patterns of C000, C003, C005, C007 and C009
sam-ples after the final stage of the heat treatment.
3.2.2. SEM Studies
The scanning electron micrographs of the samples after the final sintering step are shown in Figures 5(a)-(d). It
is clear from the figures that the superconducting grains seem to be connected with each other, while there are some unfilled spaces among them. The grain size and the distribution of grains on the surface of the samples are quite different. Again here characteristic flaky grains of (Bi,Pb)-2212 and plate-like grains which are the typical grain structure of (Bi,Pb)-2223 are visible in these sam- ples. The surface of the C007 sample is smoother and
denser, while C003 and C005 samples have larger grain
sizes and more voids. In the XRD pattern of the samples, it is seen that the superconducting phases Bi-(2212) in- crease as the wt% of Gd2O3 increases. Therefore, the high-
est density value would be expected for the C009 sample.
3.2.3. AC Susceptibility Studies
For the superconducting samples, the real part of the AC susceptibility was measured after the final sin- tering step. The real part of the AC susceptibility versus temperature for samples C000, C003 and C007 is shown in
Figure 6. The onset temperature of samples C000, C003
and C007 are 112, 109, 105 ± 1 K respectively. The C000
and C003 curves show that initially two phases Bi-2223
and Bi-2212 are present in these samples. In the C000
sample, the transition of
T
T for the intragranular component is sharper. In the C007 sample, there is a weak
transition in 105 K that shows phase Bi-2223 approximately has been destroyed. Phase Bi-2223 decreases by increas- ing the wt% of Gd2O3 but the actual estimate of super-
conducting volume fraction is not possible by this ex- periment. For C005 and C009 Samples, the behaviors
are mostly the same of C003 and C007 samples respectively.
T 4. Conclusion
The X-ray diffraction studies in room temperature show that there are two major phases of Bi-2223 and Bi-2212 in the diffraction patterns. The orthorhombic structure
(a) (b)
[image:4.595.309.539.325.494.2](c) (d)
Figure 5. SEM photograph for samples (a) C003; (b) C005; (c)
C007; and (d) C009.
Figure 6. The temperature dependence of the real part of AC susceptibility for the C000, C003 and C007 samples.
was observed for all samples. The XRD and SEM results show that G2O3 admixture helps to increase the amount
of 2212 phase. Also, these results show that an alterna-tive calcination favors the formation of the Bi-2223 phase and the size of the largest particle is increased. The AC susceptibility studies show that the onset temperature of samples A000, A003 and A007 are 112, 109, 105 ± 1 K
respectively and new calcination process improves the formation of the Bi-2223 phase.
REFERENCES
[1] Koyama, U. Endo and T. Kawai, “Preparation of Single 110 K Phase of the Bi-Pb-Sr-Ca-Cu-O Superconductor,”
Japanese Journal of Applied Physics, Vol. 27, No. 27,
Maeda and K. Hoshino, “Sputter Deposition of BiSrCa-CuO Thin Film,” Japanese Journal of Applied Physics, Vol. 27, No. 27, 1998, pp. L632-L633.
doi:10.1143/JJAP.27.L632
[3] M. Onoda, A. Yamamoto, E. Takayama-Muromachi and S. Takekawa, “Assignment of the Power X-Ray Diffrac- tion Pattern of Superconductor Bi2(Sr,Ca)3−xCu2Oy,” Ja-
panese Journal of Applied Physics, Vol. 27, No. 27, 1998,
pp. L833-L836. doi:10.1143/JJAP.27.L833
[4] I. H. Gul, M. A. Rehman, M. Ali and A. Maqsood, “Ef-fect of Vanadium and Barium on the Bi-Based (2223) Superconductors,” Physica C: Superconductivity, Vol. 432, No. 1-2, 2005, pp. 71-80.
doi:10.1016/j.physc.2005.07.013
[5] C. A. M. dos Santos, S. Mochlecke, Y. Kopelevich and A. J. S. Machado, “Inhomogeneous Superconducting in Bi2Sr2Ca1−xPrxCu2O8-z,” Physica C: Superconductivity, Vol. 390, No. 1, 2003, pp. 21-26.
doi:10.1016/S0921-4534(02)02802-2
[6] V. P. S. Awana, S. K. Agarawal, R. Ray, S. Gupta and A. V. Narlikar, “Superconductivity and Resistivity Studies in Bi2Sr2Ca1−xMxCu2O8+y,” Physica C: Superconductivity, Vol. 191, No. 1-2, 1992, pp. 43-51.
doi:10.1016/0921-4534(92)90628-P
[7] H. Fujii, Y. Hishinuma, H. Kitaguchi, H. Kumakura and K. Togano, “Study on the Heat Treatment Condition to Improve Coupling of Grains in Bi2−xPbxSr2CaCu2Oy/Ag Tapes,” Physica C: Superconductivity, Vol. 331, No. 1,
2000, pp. 79-84. doi:10.1016/S0921-4534(99)00621-8 [8] T. Rentschler, S. Kemmler-Sack, M. Hartmann, R. P.
Hubenen, P. Kesselar and H. Lichte, “Influence of Nd Substitution on the Superconducting properties of ceram- ics in the 2212 System Bi2−wPbwSr2−yNdx+yCuxO8+z,”
Physica C: Superconductivity, Vol. 200, No. 3-4, 1992,
pp. 287-295. doi:10.1016/0921-4534(92)90379-Q [9] A. Biju, R. G. Abhilash Kumar, R. P. Aloysius and U.
Syamaprasad, “Structual and Superconducting Properties of Bi1.7Pb0.4Sr2−xGdxCa1.1Cu2Oy,” Physica C: Supercon-
ductivity, Vol. 449, No. 2, 2006, pp. 109-115. doi:10.1016/j.physc.2006.07.006
[10] B. Jayaram, P. C. Lamchester and M. Weller, “Localization and Interaction Effects during Superconductor-Insulator Transition of Bi2Sr2Ca1-x Gdx Cu2O8+d,” Physical Review
B, Vol. 43, No. 47, 1991, pp. 5444-5450. doi:10.1103/PhysRevB.43.5444
[11] Y. Gao, P. Pernambuco-Wise, J. E. Crow, J. O’Reilly, N. Spencer, H. Chen and R. E. Salomon, “Superconducting and Magnetic Phase Boundaries in Bi2Sr2Ca1−xMxCu2O8 with M=Y, Gd, and Pr,” Physical Review B, Vol. 45, No.
13, 1992, pp. 7436-7443. doi:10.1103/PhysRevB.45.7436 [12] P. Mandal, A. Podder, B. Ghosh and P. Choudhary,
“Variation of Tc and Transport Properties with Carrier Concentration in Y- and Pb-Doped Bi-Based Supercon-ductors,” Physical Review B, Vol. 43, No. 16, 1991, pp.
13102-13111. doi:10.1103/PhysRevB.43.13102
[13] V. P. S. Awana, S. K. Agarawal, A. V. Narlikar and M. P. Das, “Superconductivity in Pr- and Ce-Doped Bi2CaSr2 Cu2Oy System,” Physical Review B, Vol. 48, No. 2, 1993, pp. 1211-1216. doi:10.1103/PhysRevB.48.1211
[14] A. Biju, R. P. Aloysius and U. Syamaprasad, “Enhanced Critical Current Density in Gd-Added (Bi-Pb)-2212 Bulk Superconductor,” Superconductor Science and Technol- ogy, Vol. 18, No. 11, 2005, pp. 1454-1459.
doi:10.1088/0953-2048/18/11/007
[15] T. Motohashi, Y. Nakayama, T. Fujita, K. Kitazawa, J. Shimoyama and K. Kishio, “Systematic Decreases of Re-sistivity Anisotropy in Bi2Sr2CaCu2Oy by Pb Doping,”
Physical Review B, Vol. 59, No. 21, 1999, pp. 14080-
14087. doi:10.1103/PhysRevB.59.14080
[16] J. E. Huheey, E. A. Keiter and R. L. Keiter, “Inorganic Chemistry: Principles of Structure and Reactivity,” 3rd Edition, New York, Cambridge, 1983.
[17] http://wikipwdia.org/wiki/loss-on-ignition
[18] P. V. Reddy, K. Ganesh, R. J. Topare, N. K. Sahuji and S. S. Shah, “Elastic Anoumalies in Bi-Pb-2223/Ag Super- conducting Composite Materials,” Physica C: Supercon- ductivity, Vol. 253, No. 1-2, 1995, pp. 89-96.
doi:10.1016/0921-4534(95)00320-7
[19] S. A. Saleh, “Studies on Sintering Effect on the Structural and Transport Properties of (2223) Phase,” Physica C: Superconductivity, Vol. 444, No. 1-2, 2006, pp, 40-44.
[20] G. Ilonca, A. V. Pop, T. R. Yang, I. Gr. Deac, C. Lung, R. Stiufiuc and G. Stiufiuc, “Effects of Rare Earth Ion Sub- stitution for Ca in (Bi, Pb): 2223 Superconductors,” In- ternational Journal of Inorganic Materials, Vol. 3, No. 7,
2001, pp. 769-772. doi:10.1016/S1466-6049(01)00048-4 [21] S. Çelebi, A. I. Malik and S. A. Halim, “Study of Nd
Substitution in Bi-(Pb)-Sr-Ca-Cu-O High-Tc Supercon- ductors,” Journal of Alloys Compounds, Vol. 337, No. 1-2,
2002, pp. 237-242. doi:10.1016/S0925-8388(01)01929-6 [22] S. M. Khalil, “Effect of Optimum Annealing Time on
Superconducting Properties of Bi2−xPbxSr2Ca2Cu3Oy Sys-tem,” Physica Status Solidi (a), Vol. 178, No. 2, 2000, pp.
731-744.
doi:10.1002/1521-396X(200004)178:2<731::AID-PSSA7 31>3.0.CO;2-S
[23] S. M. Khalil, “Enhancement of Superconducting and Mechanical Properties in BSCCO with Pb Additions,”
Journal of Physics and Chemistry of Solids, Vol. 62, No. 3,
2001, pp. 457-466. doi:10.1016/S0022-3697(00)00088-3 [24] A. Tampieri, G. Celotti, S. Guicciardi and C. Melandri,
“Microstructural and Mechanical Characterization of Bulk BSCCO (2223) Superconductor,” Material Chemistry and Physics, Vol. 42, No. 3, 1995, pp. 188-194.