© 2019, IRJET | Impact Factor value: 7.34 | ISO 9001:2008 Certified Journal
| Page 1723
An Approach to Enhance Visual Quality of Rice Grains using Top -Hat
Transform
Jayanthy L
1, Dr. Priya S
2, Mrs. Sheena K V
31
Mtech Student in Image Processing, Model Engineering College, Thrikkakara, Kochi, India
2
Professor, Department of Computer Engineering, Model Engineering College, Thrikkakara, Kochi, India
3
Assistant Professor, Dept. of Computer Engineering, Model Engineering College, Thrikkakara, Kochi, India
---***---
Abstract - The consumption of rice is more in India. Itwill have more importance for human being because it directly impacts human health. The quality of rice is determined by many factors, among which the appearance quality directly afects its competitive ability in the market. Computer Learning has wide range of application in agricultural feld. Analyzing the grain sample manually is more time consuming and complicated process, and having more chances of errors with the subjectivity of human perception. In order to achieve accuracy, combination of machine Learning and image processing methods are used. The Grain quality is characterized into two main factors internal factors, and the external factors. The intrinsic or internal factors of grain includes, color, composition, bulk density, odour, aroma, size and shape. The external or extrinsic factors include: age, broken grain, immature grain, foreign matter, infected grain and moisture content. This method classifies the whole and the broken rice grain and also perform the shape detection.
Key Words: Pre-processing, Feature Extraction, Classification, Canny Edge detection.
1. INTRODUCTION
Grains are the prime crop in India to increase the agricultural income. Also, yield is the most noticeable characteristic to farmers while the crop is in the ground, but when the milled rice reaches the market, quality becomes the key determinant of its salability. The workload is so mass that it will lead to workers fatigue and need them to have sample testing experience. And it also makes the testing more costly and long to be made. By the development of export and import trade this contradiction is more and more outstanding. During the grain handling operations, types of grain and their quality is required at several stages before the next operation can be determined and performed. In the present grain quality handling system, the grain quality and shape are rapidly assessed by visual inspection. This analysis process is, however, tedious and time consuming and also subjected to errors.
There is no convenient method is present to identify these inferior quality grains in the market. Therefore, this has become a serious issue for the consumer. The
farmers are affected by this manual activity. Therefore, it is required to explore the possibility of using technology for a suitable solution.
The advantages of this Manual Method are Simple and low cost, and the disadvantages include Low efficiency and greater subjectivity.
The accuracy of quality checking by using manual method is varied from person to person and it also depends on working stress, persuasion and loyalty for traders and also the knowledge and experience of inspectors are required to accurately perform this evaluation Process.
These grains consists of several impurities like stones, weed seeds, chaff, and damaged seeds etc. The level of automation of testing the quality of grain is low and most work is done by manpower.
The quality of the worlds most important staple food crop can be determined based on the shape size and shape of the grain. In India the population is increasing and so it is difficult in handling and processing and the increased expectation of food products of high quality and safety standards there is a need for the growth of accurate fast and objective quality determination of food grains. Nowadays, the chemical methods are used for the identification of rice grain seed varieties and quality. The chemical method used also destructs the sample used and is also very time consuming method. On the other hand the machine vision or the digital image processing is a non destructive method, it is also very fast and cheap process compared to the chemical method. As the technology is growing wider people are adopting the new technologies.
2. RELATED WORKS
© 2019, IRJET | Impact Factor value: 7.34 | ISO 9001:2008 Certified Journal
| Page 1724
34190x300 pixels in size. The images are stored in JPGformat. The methodology consists of 3 steps where the level of background is set and the image is subtracted after that stretch limit of the image is adjusted and the ratio is set b/w 0&1 for background and grains Kernel. So by this experimentation, it’s found out that grading of rice can be effectively done by image processing and purity of sample is also calculated.
Kaur and Verma “Image Processing Techniques for Grading and Classification of Rice using image processing Techniques Conference on computer and technology [2] .In this Paper computer vision techniques can be used for grading of rice kernels based on their sizes such as full, medium or half. The high pixel resolution images are acquired using a digital camera. The camera is located at a position normal to the object. This algorithm is tested on images placed under different illumination and background color characteristics. The poor illumination effects were removed from the background and the image is converted to binary image, then successive erosion and dilation operations are performed to separate the touching kernels.
By labeling the connected components the grains were counted and area of each connected components is found using region props, the maximum grain length found is used as a structuring element and morphological operations were performed to extract the grains which have length less than the structuring element.
Then finally grading formulae is applied which gives the percentage of full length grains in the given sample. The grading formula and standards were acquired from the analysis procedure for grading rice followed in India.
Naiquin Zhang “Analysis of the functions of TaGW2 homologous in wheat grain and Protein content analysis “[3] presented the grain , a real time image based quality inspection machine that can replace tedious visual inspections for color, purity, and size characteristics of grains. It also has the potential for measuring the virtuousness of durum wheat, Pasta wheat or Macroni Wheat. Also the Model transferability between different inspection machines was tested.
Mandeep Saini et al,”Analysis of seed grain varieties using Image Processing techniques - A review “[4]. In this Paper in terms of total production tonnages used for food, India is currently second to wheat as the main human food crop and instead of maize. Determining the quality of wheat is critical. Determining the quality of wheat manually requires an expert judgment and also its a time consuming Process. Sometimes it becomes very hard to differentiate between the same color and shape of grain. To overcome these problems, the Image processing techniques can be used to classify wheat according to its quality.
S.V. More et al ”Rice grain identification and quality analysis using image processing techniques”[5] .In this paper it describes the Quality of grains is an important requirement to protect consumers from substandard products. The consumer trends are driving the food industry today are Sensory pleasure, healthy eating, value and convenience. Rice delivers on all of these factors. Rice is the primary dietary staple for more than half the world’s population. It is the most popular grain globally, supplying energy, carbohydrates, protein, fiber, essential vitamins and minerals and beneficial antioxidants. In the last 30 years, rice consumption all over the world has more than doubled. In this the proposed system helps to identify the type of rice grain being provided.
Yosuke Yoshioka et al “Chalkiness in rice potential for evaluation with image analysis” [6]. In this the authors proposed a methodology to evaluating the effectiveness of the image scanner for measuring the chalkiness and then categorize the chalkiness of the grain and assessed the method’s viability as an alternative to human visual assessment. The 246 perfect and chalky grains were taken as a sample here.
It is classified into 8 different categories based on the chalkiness. The images were scanned by a scanner or personal computer in JPG format. These high quality images of the grains were converted into grayscale then to a binary image by using the threshold method. Here support vector machine (SVM) is used for the algorithm. To quantify the location and degree of chalkiness a Principal Components Analysis (PCA) in view of the variance-covariance matrix of the 18 mean grayscale esteems gotten by the portioning technique. The accuracy of the classification is 90.2%
Andres M.Tuates Jr et al [7].In this, the proposed a methodology is to analyze the brown rice quality by computer vision based on image processing techniques. The samples were collected by 1000 nos. Of rice, grains placed on the scanner and scanned the images in JPG format for future process. The brown rice samples were classified by a trained classifier into chalky, paddy, yellow fermented, red, immature and sound damaged. Moreover, to extract shape and color features of the brown rice grain image using the analysis software method is known as PhilMech quality analysis. After milling the operation the defective grains of brown rice are different in, especially in red, chalky and sound yellow. To detect the color and predict the weight of the brown rice the computer visions system (CVS) is utilized. When it compared the CVS with the human inspection it is more accurate and efficient.
© 2019, IRJET | Impact Factor value: 7.34 | ISO 9001:2008 Certified Journal
| Page 1725
morphological image processing, the analysis used toperform various operations such as object extraction, image filtering operations, image segmentation etc. Firstly the image is being read from a flee than morphological operation is performed to estimate the background illumination. The morphological operation is erosion followed by a direction. Than surf, the command is used to create a surface display of background. As surf command requires data of class double. So there is a need to convert background using a double command. For creating a more uniform background it needs to subtract image background. Then adjusting and b2w is used to adjust the contrast of an image and then to convene grayscale image to binary image.
3. PRE-PROCESSING OF RICE GRAINS
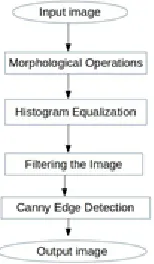
[image:3.596.121.198.344.476.2]Pre-processing of the image is an improvement of the image data that enhances some image features or suppresses unwanted distortions important for further processing.
Fig -1: Flow chart of Pre- Processing of the image
3.1
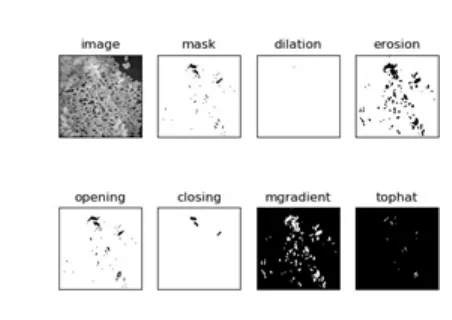
Morphological OperationsThe Morphological operation is a group of non- linear components related to the shape or morphology of features in an image. It uses a structuring element which is positioned in all the possible location which is compare to neighborhood pixel of an image. The basic morphological operations include dilation and erosion. The Morphological Dilation Process adds pixels to the boundaries of objects in an image, while the erosion removes pixels on object boundaries.
The number of pixels that can be added or removed from the objects in the corresponding image depends on the shape and size of the structuring element.
In the state of any given pixel in the output in the erosion and dilation operations image of an image can be determined by applying a rule to the corresponding pixel and its neighbors in the input image.
3.1.1.
Top-hat transformTop hat transform is an operation that extracts small elements and details from the given images. The top hat transform can be classified into two, they are White top-hat transform and Black top-top-hat transform. White transform can be defending as the difference between the input image and its opening by some structuring element. This type of transform returns an image, containing those objects or elements of an input image that are smaller than the structuring element and brighter than their surroundings.
The black top- hat transform is defend as the difference between the closing and the input image. The top- hat operation is used to separate foreground from background. These type of transform returns an image, containing those objects or elements of an input image that are darken than their surroundings.
If X is the original image and B represents the structuring element, then
White Top-hat(X)=X- X º B Black top-hat(X)=X.B - X
where “º” represents Morphological Opening and “.” Represents the Morphological Closing operation.
3.2.
Histogram EqualizationHistogram Equalization is an image processing technique used to improve the contrast in images .This can be achieved effectively by spreading out the most frequent intensity values, i.e. stretching out the intensity range of the image. Here Contrast Limited Adaptive Histogram Equalization (CLAHE) is used for improving the visibility of the image.
The Morphological operations has the effect of removing objects that cannot completely contain the structuring element. For obtaining a good result enhancing the image by using Contrast Limited Adaptive Histogram Equalization (CLAHE).
3.3.
Filtering the imageFiltering is a technique which is used for modifying or enhancing an image. That is filtering an image to emphasize certain features or remove other features. Linear filtering is filtering technique, the value of an output pixel is a linear combination of the values of the pixels in the input pixel's neighborhood.
3.4.
Canny Edge DetectionEdge detection is the process of detecting the boundaries of rice grains. The Canny edge algorithm is used to segment the rice grains from the black background.
© 2019, IRJET | Impact Factor value: 7.34 | ISO 9001:2008 Certified Journal
| Page 1726
1. Low Error rate: The probability of detecting all
edge points should be found, with a minimum of spurious responses.
2. Localization: The detected edges should be as
close as possible to the true edge points.
3. Number of responses: Only one should be
detected for each real edge point.
1. EXPERIMENTAL RESULTS
In this project, the greyscale /binary image of rice seed is (or the RGB image should be converted to greyscale image) given as input image and various pre-processing
methods has been applied such as Morphological
operations, histogram Equalization such as Contrast Limited Adaptive Histogram Equalization(CLAHE) , Median filtering and the canny edge detection.
[image:4.596.325.551.82.191.2]Fig -2: Morphological Operations
Fig -3: Enhancing the Visibility By Contrast Limited Adaptive Histogram Equalization
(CLAHE).
[image:4.596.324.547.222.341.2]Fig -4: Noise Removal Using Median Filtering.
Fig -5: Detecting the edges by Canny edge detection.
2. CONCLUSION
Pre-processing is an important step in any image processing system, which includes extraction of information from the image. According to the
requirement, various different pre-processing
techniques are used and developed. In this proposed project, it can use different pre- processing methods include Morphological Operations, image filtering using the bilateral filter, image smoothening using Contrast Limited Adaptive Histogram Equalization (CLAHE) , filtering the image by using median filtering and detecting the edges using Canny edge detection method. This system provides better performance.
REFERENCES
[1] Jagdeep Singh Aulakh , Dr. V.K. Banga, “Grading
ofrice grains by image processing”, International Journal of Engineering Research and Technology (IJERT), Vol. 1, Issue4, June 2012
[2] Bhupinder Verma, “Image Processing
Techniques for Grading and Classifcation of Naiquin zhang et al, Analysis of the functions of TaGW2 homoeologs in wheat grain weight and protein content traits.
[3] Mandeep Saini,Jagjit Singh,Neelam Roop
Prakash ,”Analysis of Wheat Grain Varieties Using Image Processing-A Review”.
[image:4.596.50.276.317.477.2]© 2019, IRJET | Impact Factor value: 7.34 | ISO 9001:2008 Certified Journal
| Page 1727
Techniques”.[5] Yosuke yoshika,”Chalkiness in Rice: Potential for Evaluation with Image Analysis”.
[6] Andres M. Tuates Jr. *, Aileen R. Ligisan,
“Development of a Computer Vision System for Brown Rice Quality Analysis”.
[7] Bhavesh B. Prajapati, Sachin Patel, “Classifcation
of Indian Basmati Rice Using Digital Image Processing as per Indian Export Rules”, International Research Journal of computer Science Engineering and Applications, Vol. 2 Issue 1, January 2013.
[8] S. Kanchana, S. Lakshmi Bharati, M. Ilamran and
K. Singaravadivel, “Physical Quality of Selected Rice Verities”, World Journal of agriculture Sciences, pp. 468-472, 2012.
[9] Harpreet Kaur, Baljit Singh, “Classifcation and
Grading Rice using Multi-Class SVM”,
International Journal of Scientifc and Research Publications (IJSRP), Vol. 3, Issue 4, April 2013.
[10] Shilpa J. Bhonsle, “Grain Quality Evaluation and
Organoleptic Analysis of Aromatic Rice Varieties of Goa, India”, Journal Agricultural Science, pp. 99-107, Vol. 2, No. 3; September 2012.
[11] 10] J. Paliwal, N. S. Visen, D. S. Jayas, Cereal Grain and Dockage Identifcation using Machine Vision, Biosystems Engineering 85(1):51-57, 2003.
[12] S. Anami1, D. G. Savakar, “Improved Method for
Identifcation and Classifcation of Foreign Bodies Mixed Food Grains Image Samples” ICGST-AIML Journal, ISSN: 1687- 4846, Volume 9, Issue I, February 2009.
[13] Aggarwal, Amit K. and Mohan, Ratan "Aspect Ratio Analysis Using Image Processing for Rice Grain Quality", International Journal of Food Engineering: Vol. 6 (5), 2010.
[14] N. A. Kuchekar "Rice Grain Quality GradingUsing Digital Image Processing Techniques." IOSR Journal of Electronics and Communication Engineering (IOSR-JECE) 13.3 (2018): 84-88.
[15] Siriluk Sansomboonsuk and Nitin
Afzulpurkar, “The Appropriate Algorithms of Image analysis for Rice Kernel Quality Evalution”,20 th Conference of Mechanical Engineering Network of Thailand 18-20 Oct., Nakhon Ratchasima, Thailand, 2006.
[16] Agustin, O.C., Byung-Joo Oh, “Automatic Milled Rice Quality Analysis”, IEEE Computer Society