Comparative Effect of City Finished Compost and NPK
Fertilizer on Growth and Availability of Phosphorus to
Radish (Raphanus sativus L.)
Ashoka Sarker, Md. Abul Kashem*, Khan Towhid Osman
Department of Soil Science, University of Chittagong, Chittagong, Bangladesh. Email: *[email protected]
Received February 23rd, 2012; revised March 20th, 2012; accepted April 7th, 2012
ABSTRACT
A pot experiment was carried out to investigate the comparative effect of city finished compost and NPK fertilizer on the growth and availability of phosphorus to radish (Raphanus sativus L.). An air dried sandy loam soil was mixed with five rates of city finished compost (CFC) equivalent to 0, 5, 10, 20, 40 ton·ha–1 and three rates of NPK fertilizer equivalent to 50% (N-P-K = 69-16-35 kg·ha–1), 100% (N-P-K = 137-32-70 kg·ha–1 K) and 150% (N-P-K = 206-48-105 kg·ha–1). Four plants were harvested at 45 days of growth and remaining one plant was harvested at 90 days of growth and separated into leaves and bulbs. After harvest, soil samples were collected from each pot to measure soil pH and available P extracted by Olsen, Mehlich-3, Kelowna and Bray & Kurtz-1 extractants. The growth parameters (length of leaves and bulbs,fresh and dry weight of leaves and bulbs), relative dry matter yield, plant P concentrations, P uptake by radish, soil pH, and available P increased by the rates of CFC and NPK fertilizer treatments. Among the treatments, growth performance of radish was better with the highest rate of 40 t·ha–1 CFC treatments. The results obtained from the 5 and 10 t·ha–1 CFC treatment were comparable with the results of 50% and 100% NPK fertilizer treatments respec-tively. Similar effects of amendments were obtained in the case of plant P concentration, uptake of P by plant, soil pH and available soil P concentration. Available P and soil pH showed very strong and positive correlation (P < 0.001) with dry matter yield, P uptake by plant. The P extracted by various extractants also showed strong positive correlation (r = 0.973 to 0.994; P < 0.001 ) each other indicating the suitability of any of the extractants to predict available P. Results of the present study indicated that 10 t·ha–1 city finished compost could be used instead of 100% to obtain similar yield and to improve soil conditions.
Keywords: Compost; Soil; Extraction Methods; Growth; Phosphorus; Radish
1. Introduction
With increasing demand of agricultural production and as the peak in global production will occur in the next dec- ades, phosphorus is receiving more attention as a nonre- newable resource [1,2]. Applications of chemical P fer- tilizers to agricultural land have improved soil P fertility and crop production, but caused environmental damage in the past decades. In addition, the use of inorganic fer-tilizers has not been helpful under intensive agriculture because it is often associated with reduced yield, nutrient imbalance, leaching and pollution of groundwater [3,4]. Organic manure can serve as alternative practice to mine- ral fertilizers [5,6] for improving soil structure [7,8] and microbial biomass [9]. Improved yields of various crops have been reported by addition of organic manures [10- 12]. Plants grown with organic manures accumulate
more P than without organic amendments [13]. Organic amendments contain considerable amounts of organic P which are mineralized and provide available P to plant. On decomposition, organic matters liberate P in soil and accumulate organic acids, which interact with soil com-plexes to affect the availability through different mecha-nisms [14].
The application of organic waste or compost on soils used for crop production is of great importance due to the nutritional input and low cost [15]. Additionally, com- posting is one of the best solutions to reduce the huge piles of organic wastes and convert it in to a value added product. It is one of the major recycling processes by which nutrients present in organic materials are returned back to the soil in plant available form [16]. Also, patho- gens are eliminated during composting, and so this pro- cess produces an adequate agricultural product [17,18]. City finished compost (CFC), an important organic source *
of P is effective in increasing the availability of P as compost additions improve the fertility and the physico- chemical properties of soils [18,19]. The availability of city wastes P to crops and its impact on soil P may differ from that of inorganic P fertilizer [21-24]. Some studies have suggested that P in organic amendments may be equally or more available than fertilizer P [22]. These findings emphasize the need for studying the use of city finished compost (CFC) and NPK fertilizer to compare their effects on the growth and availability of nutrient to plants.
Radish (Raphanus sativus L.) one of the important and popular vegetable crops in Bangladesh was used as a test plant in this study. The main objective of this study was to investigate the effect of city finished compost and NPK fertilizer on growth and availability of phosphorus to radish.
2. Materials and Methods
2.1. Plant Growth Experiment
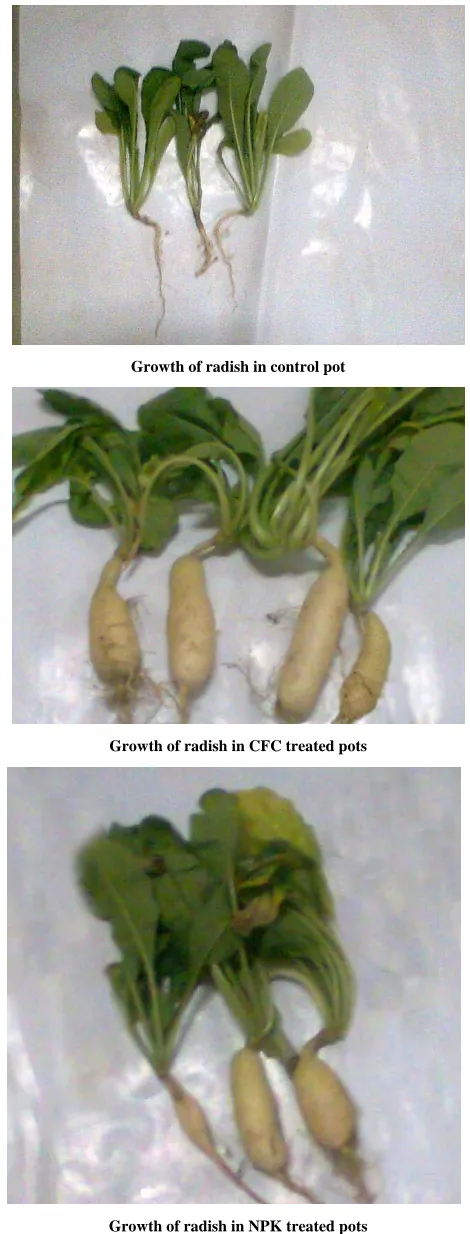
A pot experiment was carried out in the crop field of the Department of Soil Science, University of Chittagong, Bangladesh, using a sandy loam surface soil (0 - 15 cm). Soil sample was air dried and passed through 4-mm sieve for using it in the pots. For laboratory analysis, a sub sample was air dried and passed through a 2-mm sieve and stored. Soil pH was of 5.07 (1:2.5 soil to water ratio), organic carbon [25] was 0.93% and CEC (extraction with 1 M NH4OAc} [26] was of 4.01 cmol·kg–1. The soil con-tained 73% sand, 13% silt and 14% clay measured by hydrometer method [27]. City finished compost (CFC) was collected from the composting plant of Chittagong City Corporation, Halishahar, Chittagong and ground, sieved and analyzed for chemical properties. The pH of CFC was 7.13. Five rates of CFC equivalent to 0 (con-trol), 5, 10, 20, 40 t·ha–1 and three NPK fertilizer rates equivalent to 50% (N-P-K = 69-16-35 kg·ha–1), 100% (N-P-K = 137-32 P-70 kg·ha–1), and 150% (N-P-K = 206 -48-105 kg·ha–1) were applied separately in each pot containing four (4) kg soil. The pots were arranged in a completely randomized design (CRD) with three replica-tions. Eight seeds of radish were sown to each pot and water was applied up to the field capacity. After emer-gence, 5 healthy seedlings were kept in each pot. The plants were harvested two times from the same pot. Out of 5 plants, 4 plants were harvested at 45 days of growth and another 1 plant was harvested at 90 days of growth (Figure 1). After each harvest, the plants were separated into leaves and bulbs. The length of the leaves and bulbs with fresh weight were recorded. The leaves and bulbs were air dried for several days and oven dried at 65˚C for 72 hours and dry mass was recorded. Soil samples were
Growth of radish in control pot
Growth of radish in CFC treated pots
[image:2.595.304.539.93.710.2]Growth of radish in NPK treated pots
collected from each pot after harvest to measure soil pH and extractable P by four extraction methods such as Olsen [28], Mehlich-3 [29], Kelowna [30] and Bray and Kurtz-1 [31].
Total P in the soil, CFC and in the plant tissues were determined colorimetrically by ascorbic acid blue color method [32] after digestion with H2O2-H2SO4 [33] and
the absorbance was measured by spectrophotometer at wave length of 882 nm. Total phosphorus concentration in the experimental soil and CFC were 100 mg·kg–1 and 7100 mg·kg–1, respectively. Extractable P of the soil was determined by the same procedure as mentioned above after extraction with different extractants. The available phosphorous of the soil sample extracted by 0.5 M Na-HCO3 (Olsen), Mehlich-3, Kelowna and Bray and Kurtz-
1 method were 1.37, 4.95, 4.76 and 4.93 mg·kg–1 respec- tively. The P uptake of the plants was calculated by mul- tiplying the P concentration in the tissue and the dry matter (DM) yield.
2.2. Statistical Analysis
Microsoft Excel and MINITAB program [34] were used
for analysis of variance and correlation.
3. Results
3.1. Plant Growth
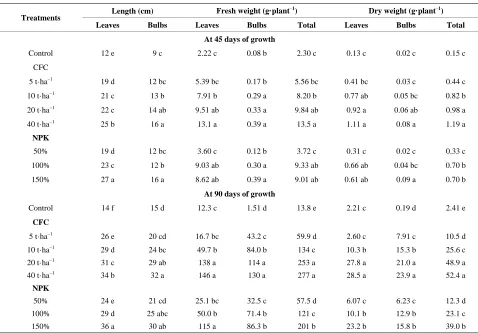
City finished compost and NPK fertilizer application sub- stantially influenced the plant growth. The height of leaves and bulbs of radish both at 45 and 90 days of growth increased significantly (P < 0.001) with the rates of CFC and NPK fertilizer application. At both growth periods, the maximum height was observed at the highest rate of CFC (40 t·ha–1) and NPK (150%) treatments. With the duration of growth, these two parameters in- creased but the treatment effects were found similar at both 45 and 90 days of growth (Table 1).
[image:3.595.58.536.390.723.2]The fresh and dry weights of leaves and bulbs also in- creased with the rates of amendments and the duration of growth. Total fresh weight of radish (leaves plus bulb) increased 6 and 4 folds by the application of 40 t·ha–1 CFC and 150% NPK treatments, respectively over the control, the corresponding values of total dry weight in- creased were of 8 and 5 folds of the control at 45 days of
Table 1. Effect of CFC and NPK fertilizer on growth and yield of radish at 45 and 90 days of growth.
Length (cm) Fresh weight (g·plant–1) Dry weight (g·plant–1)
Treatments
Leaves Bulbs Leaves Bulbs Total Leaves Bulbs Total
At 45 days of growth
Control 12 e 9 c 2.22 c 0.08 b 2.30 c 0.13 c 0.02 c 0.15 c
CFC
5 t·ha–1 19 d 12 bc 5.39 bc 0.17 b 5.56 bc 0.41 bc 0.03 c 0.44 c
10 t·ha–1 21 c 13 b 7.91 b 0.29 a 8.20 b 0.77 ab 0.05 bc 0.82 b
20 t·ha–1 22 c 14 ab 9.51 ab 0.33 a 9.84 ab 0.92 a 0.06 ab 0.98 a
40 t·ha–1 25 b 16 a 13.1 a 0.39 a 13.5 a 1.11 a 0.08 a 1.19 a
NPK
50% 19 d 12 bc 3.60 c 0.12 b 3.72 c 0.31 c 0.02 c 0.33 c
100% 23 c 12 b 9.03 ab 0.30 a 9.33 ab 0.66 ab 0.04 bc 0.70 b
150% 27 a 16 a 8.62 ab 0.39 a 9.01 ab 0.61 ab 0.09 a 0.70 b
At 90 days of growth
Control 14 f 15 d 12.3 c 1.51 d 13.8 e 2.21 c 0.19 d 2.41 e
CFC
5 t·ha–1 26 e 20 cd 16.7 bc 43.2 c 59.9 d 2.60 c 7.91 c 10.5 d
10 t·ha–1 29 d 24 bc 49.7 b 84.0 b 134 c 10.3 b 15.3 b 25.6 c
20 t·ha–1 31 c 29 ab 138 a 114 a 253 a 27.8 a 21.0 a 48.9 a
40 t·ha–1 34 b 32 a 146 a 130 a 277 a 28.5 a 23.9 a 52.4 a
NPK
50% 24 e 21 cd 25.1 bc 32.5 c 57.5 d 6.07 c 6.23 c 12.3 d
100% 29 d 25 abc 50.0 b 71.4 b 121 c 10.1 b 12.9 b 23.1 c
150% 36 a 30 ab 115 a 86.3 b 201 b 23.2 b 15.8 b 39.0 b
growth (Table 1). At 90 days of growth, the magnitude of total dry weight increase was of 21 folds by the 40 t·ha–1 CFC treatment and of 16 folds by the 150% NPK treatments over the control indicating better growth per-formance with the CFC than those with NPK fertilizer treatments.
3.2. Phosphorus Concentration in Plant Parts and Phosphorus Uptake by Plant
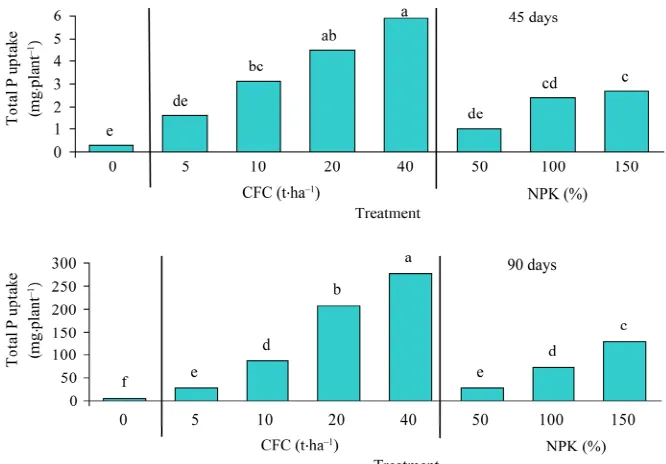
Phosphorus concentration in leaves and bulbs and uptake of P by radish at two stages of growth varied signifi- cantly (P< 0.001) with CFC and NPK fertilizer amend- ments. At 45 days of growth, P concentration in leaves ranged from 1788 mg·kg–1 in control to 5052 mg·kg–1 40 t·ha–1 CFC treated pots with a mean value of 3711 mg·kg–1. Phosphorus concentration in bulbs ranged from 1494 mg·kg–1 to 3666 mg·kg–1 with a mean value of 2640 mg·kg–1. The highest P concentration of 3666 mg·kg–1in bulbs was obtained by the application of 150% NPK fertilizer which showed no significant difference with CFC applied at 40 t·ha–1. At 90 days of growth, P concentration in leaves ranged from 1905 mg·kg–1 in control to 4861 mg·kg–1 40 t·ha–1 CFC treated pots with a mean value of 3145 mg·kg–1. Phosphorus concentration in bulbs ranged from 1701 mg·kg–1 to 5784 mg·kg–1 with a mean value of 3429 mg·kg–1. At both stages of growth, all the treatments significantly increased the P concentra-tion in radish tissues compared to the control (Figure 2). Similarly, P uptake (concentration × DM of plant) by the plant (plant parts) increased linearly with the rates of CFC and NPK fertilizer. Total P uptake (leaves plus
bulbs) ranged from 0.26 to 5.91 mg·plant–1 at 45 days of growth and 4.54 to 277 mg·plant–1 at 90 days of growth. Plant P uptake was 50 times higher at 90 days of growth than at 45 days of growth, however, the trend of treat- ment effect was found similar at both stages of growth. Phosphorus uptake was 2 folds higher with the highest rate of CFC (40 t·ha–1) than the highest rate of NPK (150%) treatment. The results 10 t·ha–1 of CFC was com- parable with the results of 100% NPK fertilizer treatment (Figure 3).
3.3. Available Phosphorus and pH in Soils after Plant Harvest
The amount of available P extracted with 0.5 M NaHCO3
[image:4.595.131.460.490.718.2](Olsen), Mehlich-3, Kelowna and Bray & Kurtz-1 meth-ods ranged from 1.01 to 11.06 mg·kg–1, 4.18 to 42.78 mg·kg–1, 2.57 to 25.03mg·kg–1 and 3.61 to 40.5 mg·kg–1, respectively (Table 2). The amount of available P in- creased with the rates of treatments regardless of amend- ments and methods. Among the treatments, the maxi- mum amount of available P extracted by four methods was observed in 40 t·ha–1 CFC treatment and the mini- mum in control. The amount of available P varied mark- edly, depending on the treatments and extractants used. A paired t-test was performed to compare the mean dif- ferences of P removed by different extractants. Tukey’s multiple range test showed that the means of Olsen P and Kelowna P showed significant difference with Mehlich-3 and Bray and Kurtz-1 P at P < 0.05 level (Table 2) but no significant difference was observed between Olsen - Kelowna P and Mehlich-3 P-Bray and Kurtz-1 P. The
Figure 3. Effect of CFC and NPK fertilizer on total P uptake by plant at 45 and 90 days of growth.
Table 2. Effect of CFC and NPK fertilizer on extractable P of soils extracted by different methods and soil pH after harvest.
Treatment Olsen P Mehlich-3 P Kelowna P Bray & Kurtz-1 P Soil pH
Control 1.01 c 4.18 g 2.57 g 3.61 e 4.92 f
CFC
5 t·ha–1 2.24 c 9.53 e 5.38 ef 9.13 d 5.01 de
10 t·ha–1 5.59 b 22.50 c 11.23 c 22.87 c 5.14 c
20 t·ha–1 6.60 b 28.26 b 16.97 b 27.55 b 5.28 b
40 t·ha–1 11.06 a 42.78 a 25.03 a 40.52a 5.82 a
NPK
50% 1.99 c 6.42 f 4.03f g 7.19 de 4.94 ef
100% 2.62 c 9.97 e 6.38 e 10.68 d 5.02 d
150% 5.11 b 23.95 d 12.28 c 21.21 c 5.16 c
Mean 4.53 b 18.45 a 10.48 b 17.85 a
Means followed by the same letter(s) in column(s) are not significantly different at P< 0.05.
mean values of P extracted by different extractants were in the order: Mehlich-3 P > Bray and Kurtz-1 P > Kelowna P > Olsen P (Table 2). Soil pH increased with the rates of CFC application but not with NPK applica- tion. The amount of soil pH increase was about 1 unit in 40 t·ha–1 CFC treatments (Table 2). Soil pH showed sig- nificant positive correlations with soil P extracted by di- fferent extractants and DM yield.
3.4. Correlation among Extractable P, Dry Matter Yield and P Uptake by Plant
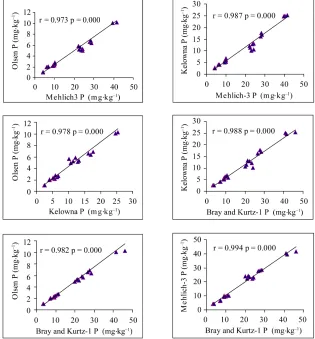
The P values extracted with different methods were sig- nificantly and positively correlated (r = 0.973 to 0.994, P
< 0.001) with each other. The best correlation was found between Mehlich-3 P and Bray and Kurtz-1 P (r = 0.994). Level of significance was fitted to the graph as given in Figure 4. Regardless of extractants, extractable P showed very strong positive correlation with DM yield and plant P uptake at both stages of plant growth (Figure 5), indi- cating that any of these extractants can be used to esti- mate plant available P.
4. Discussion
Figure 4. Correlations of available P extracted by four methods.
the cation exchange capacity, improving soil aggregation, water retention and also supporting soil biological activi-ties. The rise in productivity observed after addition of compost is attributed to the increase in the nutrient availability to the plants [19,20,35]. Metal phytotoxicity issues associated with an acid soil would also be reduced with compost addition [19].
Increased microbial activity and resulted biochemical transformations in soil, because of added organic ma-nures may cause mineralization of more recalcitrant P fraction [36]. Compost reduces the P adsorption capacity. One possibility is that the iron, aluminum or calcium combines with humic or organic acids released by the decomposition of organic matter, thereby reducing P adsorption [37]. The differences among the P extractabil-ity of different methods probably arose from the fact that plant available P in the soil is not from a discreet fraction but from a continuum of fractions; extracting agents preferentially extract from different fractions depending on their reaction with soil components involved in P sorption [38]. In addition, each extracting solution has a different ability to extract varying portions of soil P be-
cause they were targeted at different pool of soil P [39]. In the present study, Mehlich-3 extractable P is approxi-mately same as that determined by the Bray and Kurtz-1 method [40]. The Bray and Kurtz-1 extractant extracts mineral phosphates of Al and to a lesser extent that of Fe. It is suitable for a wide range of soils, than excluding calcareous soils [41]. Fluoride forms strong complexes with aluminium (Al3+) ions, thus releasing P from Al-P [41]. Strong positive correlations among extractable P indicates that, although the ability of P extraction was different for different extractants, their trends of P dis-placement from soil into solution were similar [42].
5. Conclusion
Figure 5. Correlations of available P with P uptake by radish at 45 and 90 days of growth.
with P uptake indicated that any of the extractants could be used to measure the status of available P in soil. Re-sults of the present study, also suggest the need to inves-tigate the effect of CFC and NPK in more detail using different soils and crops in field condition.
REFERENCES
[1] D. Cordell, J. O. Drangert and S. White, “The Story of Phosphorus: Global Food Security and Food for Thought,”
Glob Environ Change, Vol. 19, No. 2, 2009, pp. 292-305. doi:10.1016/j.gloenvcha.2008.10.009
[2] N. Gilbert, “Environment: The Disappearing Nutrient,” Nature, Vol. 461, 2009, pp. 716-718.
doi:10.1038/461716a
[3] M. K. C. Sridhar and G. O. Adeoye, “Organo-Mineral Fertilizer from Urban Wastes,” The Field, Vol. 68, 2003, pp. 91-111.
Cropping Systems in South West Nigeria,” African Jour-nal of Biotechnology, Vol. 5, No. 15, 2006, pp. 1386- 1392.
[5] J. W. C. Wong, K. K. Ma, K. M. Fang and C. Cheung, “Utilization of Manure Compost for Organic Farming in Hong Kong,” Bio-Resource Technology, Vol. 67, No. 1, 1999, pp. 43-46. doi:10.1016/S0960-8524(99)00066-8 [6] M. Naeem, J. Iqbal and M. A. A. Bakhsh, “Comparative
Study of Inorganic Fertilizers and Organic Manures on Yield and Yield Components of Mungbean (Vigna radiat L.),” Journal of Agriculture & Social Sciences, Vol. 2, No. 4, 2006, pp. 227-229.
[7] J. Bin, “Utilization of Green Manure for Raising Soil Fertility in China,” Soil Science, Vol. 135, 1983, pp. 65- 69. doi:10.1097/00010694-198301000-00013
[8] S. N. Dauda, F. A. Ajayi and E. Ndor, “Growth and Yield of Water Melon (Citrullus lanatus) as Affected by Poul-try Manure Application,” Journal of Agriculture & Social Sciences, Vol. 4, 2008, pp. 121-124.
[9] K. D. Suresh, G. Sneh, K. K. Krishn and C. M. Mool, “Microbial Biomass Carbon and Microbial Activities of Soils Receiving Chemical Fertilizers and Organic Amend- ments,” Archives of Agronomy and Soil Science, Vol. 50, No. 6, 2004, pp. 641-647.
doi:10.1080/08927010400011294
[10] M. Usman, E. Ullah, E. A. Warriach, M. Farooq and A. Liaqat, “Effect of Organic and Inorganic Manures on Growth and Yield of Rice Variety Basmati 2000,” Inter-national Journal of Agriculture and Biology, Vol. 5, 2003, pp. 481-483.
[11] I. Khaliq, N. Parveen and M. A. Chowdhry, “Correlation and Path Coefficient Analyses in Bread Wheat,” Interna-tional Journal of Agriculture and Biology, Vol. 6, No. 4, 2004, pp. 633-635.
[12] D. Muhammad and R. A. Khattak, “Growth and Nutrient Concentration of Maize in Pressmud Treated Saline-Sodic Soils,” Soil Environment, Vol. 28, No. 2, 2009, pp. 145- 155.
[13] F. Mujeeb, M. A. Rahmatullah, A. Hannan and M. A. Maqsood, “Response of Maize to Di-Ammonium Phos-phate and Farmyard Manure Application on Three Dif-ferent Soils,” Pakistan Journal of Agricultural Science, Vol. 45, 2008, pp. 13-18.
[14] S. K. Singh, M. C. Prasad, S. Nem and C. Ramakrishna, “Clino-Biochemical Studies on Induced Pregnancy Tox-aemia in Sheep,” Indian Journal of Veterinary Pathology, Vol. 16, No. 2, 1992, pp. 85-90.
[15] P. Mantovi, G. Baldoni and G. Toderi, “Reuse of Liquid, Dewatered, and Composted Sewage Sludge on Agricul-tural Land: Effects of Long-Term Application on Soil and Crop,” Water Research, Vol. 39, No. 2-3, 2005, pp. 289- 296.
[16] M. P. de Smet Inckel, T. Tersmette and T. Veldkamp, “The Preparation and Use of Compost,” Fourth Edition, Wagenningen, the Netherlands, 1996, p. 28.
[17] M. P. Bernal, F. A. Navarro, A. M. Sánchez-Monedero, A. Roig and J. Cegarra, “Influence of Sewage Sludge
Com-post Stability and Maturity on Carbon and Nitrogen Min-eralization in Soil,” Soil Biology and Biochemistry, Vol. 30, No. 3, 1998, pp. 305-313.
doi:10.1016/S0038-0717(97)00129-6
[18] J. Casado-Vela, S. Selles, C. Díaz-Crespo, J. Navarro- Pedreño, J. Mataix-Beneyto and I. Gómez, “Effect of Composted Sewage Sludge Application to Soil on Sweet Pepper Crop (Capsicum annuum var. annuum) Grown under Two Explotation Regimes,” Waste Manage, Vol. 27, No. 11, 2007, pp. 1509-1518.
doi:10.1016/j.wasman.2006.07.016
[19] M. A. Kashem and B. R. Singh, “Solid phase speciation of Cd, Ni and Zn in Some Contaminated and Non-Con-taminated Tropical Soils,” In: I. K. Iskandar and M. B. Krikham, Eds., Trace Elements in Soil, Bioavailability, Flux and Transfer, Lewis Publishers, CRS Press, Boca Raton, 2001, pp. 213-227.
doi:10.1201/9781420032734.ch11
[20] V. D. Zheljazkov and P. R. Warman, “Application of High Cu Compost to Swiss Chard and Basil,” Science of Total Environment, Vol. 302, No. 1-3, 2003, pp. 13-26. doi:10.1016/S0048-9697(02)00390-X
[21] J. L. McCoy, L. J. Sikora and R. R. Weil, “Plant Avail-ability of Phosphorus in Sewage Sludge Compost,” Jour-nal of Environmental Quality, Vol. 15, No. 4, 1986, pp. 403-409. doi:10.2134/jeq1986.00472425001500040016x [22] P. M. Gale, M. D. Mullen, C. Cieslik, D .D. Tyle, B. N.
Duck, M. Kirchner and J. McClure, “Phosphorus Distri-bution and Availability in Response to Dairy Manure Ap-plications,” Communications in Soil Science and Plant Analysis, Vol. 31, No. 5-6, 2000, pp. 553-565.
doi:10.1080/00103620009370459
[23] M. A. Kashem, O. O. Akinremi and G. J. Rez, “Phos-phorus Fraction in Soil Amended with Organic and Inor-ganic P Sources,” Canadian Journal of Soil Science, Vol. 84, No. 1, 2004, pp. 83-90. doi:10.4141/S03-018
[24] M. A. Kashem, O. O. Akinremi and G. J. Rez, “Extract-able Phosphorus in Alkaline Soils Amended with High Rates of Organic Amendments,” Canadian Journal of Soil Science, Vol. 84, No. 4, 2004, pp. 459-467.
doi:10.4141/S03-085
[25] A. Walkley and I. A. Black, “An Examination of Degtja-reff Method for Determining Soil Organic Matter and a Proposed Modification of the Chromic Acid Titration Method,” Soil Science, Vol. 37, No. 1, 1934, pp. 29-38. doi:10.1097/00010694-193401000-00003
[26] Soil Survey Laboratory Staff, “Soil Survey Laboratory Methods Manual,” Soil Survey Investigation Report, 42, USDA-SCS, Washington DC, 1992.
[27] G. J. Bouyoucos, “Hydrometer Method Improved for Making Particle Size Analysis of Soils,” Agronomy Jour-nal, Vol. 54, No. 5, 1962, pp. 464-465.
doi:10.2134/agronj1962.00021962005400050028x [28] S. R. Olsen, C. V. Cole, F. S. Watanabe and Dean,
“Es-timation of Available Phosphorus in Soils by Extraction with Sodium Bicarbonate,” USDA Circular No. 939, U.S. Government Printing Office, Washington DC, 1954.
Modifi-cation of Mehlich 2 Extractant,” Communications in Soil Science and Plant Analysis, Vol. 15, No. 12, 1984, pp. 1409-1415. doi:10.1080/00103628409367568
[30] W. Ven Lierop, “Determination of Available Phosphorus in Acid and Calcareous Soils with Kelowna Multiple- Element Extractant,” Soil Science, Vol. 146, 1988, pp. 284-291. doi:10.1097/00010694-198810000-00009 [31] R. H. Bray and L. T. Kurtz, “Determination of Total
Or-ganic and Available Forms of Phosphorus in Soils,” Soil Science, Vol. 59, No. 1, 1945, pp. 39-45.
doi:10.1097/00010694-194501000-00006
[32] J. Murphy and J. P. Riley, “A Modified Single Solution Methods for the Determination of Available Phosphate in Natural Water,” Analytica Chimica Acta, Vol. 27, 1962, pp. 31-36. doi:10.1016/S0003-2670(00)88444-5
[33] O. O. Akinremi, N. Amisen, M. A. Kashem and H. H. Janzen, “Evaluation of Analytical Methods for Total P in Organic Amendments,” Communications in Soil Science and Plant Analysis, Vol. 34, No. 19-20, 2003, pp. 2981- 2991. doi:10.1081/CSS-120025220
[34] Minitab Inc., “Minitab User Guide Release 11,” Minitab, State College, 1996.
[35] M. A. Kashem and P. R. Warman, “Effect of Application of Chromium Feedstock Compost on the Growth and Bioavailability of Some Trace Elements in Lettuce,” Communications in Soil Science and Plant Analysis, Vol. 40, No. 15-16, 2009, pp. 2426-2439.
doi:10.1080/00103620903111327
[36] G. Nziguheba, C. A. Palm, R. J. Buresh and P. C. Smith-son, “Soil Phosphorus Fractions and Adsorption as Af-fected by Organic and Inorganic Sources,” Plant and Soil,
Vol. 198, No. 2, 1998, pp. 159-168. doi:10.1023/A:1004389704235
[37] N. J. Barrow, “Testing a Mechanistic Model. IX. Com-parison between Anions for Sorption by Soil,” Journal of Soil Science, Vol. 40, 1989, pp. 415-425.
doi:10.1111/j.1365-2389.1989.tb01284.x
[38] CAST, “Relevance of Soil Testing to Agriculture and the Environment,” Council for Agricultural Science and Technology, Issue Paper Number 15, 2000.
[39] M. Zhang, R. Wright, D. Heaney and D. Vanderwel, “Comparison of Different Phosphorus Extraction and Determination Methods Using Manure Soils,” Canadian Journal of Soil Science, Vol. 84, No. 4, 2004, pp. 469-475. doi:10.4141/S02-023
[40] D. D. Tran, A. B. Groeneveld, J. V. Meulen, J. J. Nauta, R. J. S. Schijndel and L. G. Thijs, “Age, Chronic Disease, Sepsis, Organ System Failure and Mortality in a Medical Intensive Care Unit,” Critical Care Medicine, Vol. 18, No. 5, 1990, pp. 474-479.
doi:10.1097/00003246-199005000-00002
[41] E. J. Kamprath and M. E. Watson, “Conventional Soil and Tissue Tests for Assessing the Phosphorus Status of Soils,” In: F. E. Khasawneh, et al., Eds., The Role of Phosphorus in Agriculture, ASA, CSSA, and SSSA, Madison, 1980.