ISSN Online: 1945-3124 ISSN Print: 1945-3116
A Case Study on Design Patterns and Software
Defects in Open Source Software
Mubin Ozan Onarcan, Yongjian Fu
Department of Electrical Engineering and Computer Science, Cleveland State University, Cleveland, OH, USA
Abstract
Design patterns are object oriented software design practices for solving common design problems and they affect software quality. In this study, we investigate the relationship of design patterns and software defects in a num-ber of open source software projects. Design pattern instances are extracted from the source code repository of these open source software projects. Soft-ware defect metrics are extracted from the bug tracking systems of these projects. Using correlation and regression analysis on extracted data, we ex-amine the relationship between design patterns and software defects. Our findings indicate that there is little correlation between the total number of design pattern instances and the number of defects. However, our regression analysis reveals that individual design pattern instances as a group have strong influences on the number of defects. Furthermore, we find that the number of design pattern instances is positively correlated to defect priority. Individual design pattern instances may have positive or negative impacts on defect priority.
Keywords
Design Pattern, Software Defect, Defect Priority, Software Quality, Software Repository Mining
1. Introduction
Design patterns are object oriented software design practices for solving com-mon design problems. Design patterns provide the reuse of proven designs and architectures rather than the reuse of code. The most well-known design pattern literature in software engineering is the book published by Gang of Four (GoF) in 1995 [1]. They cataloged 23 design patterns with their specific solutions to common design problems, benefits and disadvantages.
How to cite this paper: Onarcan, M.O. and Fu, Y. (2018) A Case Study on Design Patterns and Software Defects in Open Source Software. Journal of Software Engi-neering and Applications, 11, 249-273.
https://doi.org/10.4236/jsea.2018.115016
Received: February 19, 2018 Accepted: May 28, 2018 Published: May 31, 2018 Copyright © 2018 by authors and Scientific Research Publishing Inc. This work is licensed under the Creative Commons Attribution International License (CC BY 4.0).
http://creativecommons.org/licenses/by/4.0/
Open Access
Design patterns have many benefits like improving software quality, unders-tandability, flexibility, reusability, extensibility, maintainability, and reducing development time [1]. Design patterns are widely accepted in software engi-neering world and their benefits to software quality studied by many researchers. Riehle [2] and Beck [3] pointed out the benefits of using design patterns. They improved the documentation of software designs and made implementing designs and comprehending source code easier. Prechelt et al. [4] and Vokáč et al. [5] performed experiments related to software maintenance by comparing design pattern to simpler alternative solutions. They found positive effects of employing design patterns, either maintenance time reduced compare to alternative solu-tion or addisolu-tional flexibility achieved without requiring more maintenance time. Design patterns have many benefits to software quality, but they also have disadvantages as mentioned by GoF, so they should be applied with care. They bring expert knowledge but the incorrect integration and use of the chosen pat-tern can overcomplicate the design and make maintenance harder. Bieman et al. [6] examined several different programs, with and without patterns, and con-cluded that in contrast with common knowledge, the use of design patterns can lead to more change-prone classes during evolution. The evolution process of a pattern may require changes in some parts of the pattern and may lead to miss-ing parts of the design pattern. The changes of system parts should not break the constraints and properties of design patterns [7].
Some empirical studies also found that the use of design patterns may corre-late with higher defect rate and more extensive changes. The previous studies by Vokáč [8] and Aversano et al. [9] have both shown that some of the design pat-terns have higher defect rates than non-pattern classes. Another study done by Gatrell et al. [10] found that pattern based classes have large number of LOC added for the correction of the faults. Aversano et al. [9] studied the design pat-tern defects and scattered crosscutting concerns. They found that if the patpat-terns included crosscutting concerns, their defects rates could increase since the im-plementation of the concern is involved in more than one design patterns.
In this research, we study the impact of design patterns on software defects by mining the repositories of open source software projects. Mining software repo-sitories have recently emerged as a promising means to understand software en-gineering practices [11]. Many researchers have proposed mining software repo-sitory as an effective way of learning about software development.
In our study, we first select 26 open source Java software projects. We then extracted metrics of these projects from their repositories including source code repositories and bug tracking systems. The metrics include data about design patterns and defects. The metrics are then put into a metric database for analysis using correlation and regression.
Our study extends previous studies by including many more software projects and using more comprehensive metrics. Previous studies [8] [9] on design pat-terns and software defects used only a small number of software projects, from
one to three. Our metrics include more defect data than previous studies. The rest of the paper is organized as follows. Section 2 discusses related work. Section 3 introduces research problems and our proposed approach, along with its implementation including the system components and the process. Section 4 presents our study’s results with its design and analysis. Section 5 discusses threats to the validity of our study. Section 6 concludes our study along with discussion on future work.
2. Related Work
In this section, we first mention design pattern related surveys and mapping stu-dies. Second, we discuss related work on design patterns and software quality in general. We then describe previous studies on design patterns and software de-fects.
2.1. Design Pattern Mapping
The following surveys and mapping studies examine the use of design patterns. Ampatzoglou et al. [12] performed a mapping study on GoF design patterns. The aim of their study is to present researchers with research areas in the design pattern field and categorize design pattern related work in to subtopics. The most active research subtopic areas are pattern detection and impact of GoF de-sign patterns on software quality.
Zhang and Budgen [13] performed a mapping study on design patterns. They concluded that design patterns improve maintainability, but that their effects on software quality are not always positive.
In another study, Zhang and Budgen [14] performed a survey study to identi-fy valuable GoF design patterns for experienced users. They conclude that only three design patterns Observer, Composite and Abstract Factory were identified by experiences users as valuable.
Bafandeh Mayvan et al. [15] performed a mapping study on design patterns to aid researchers in active research topics in design patterns. They classified design patterns related publications into six research topic areas. Most publications are in the areas of Pattern Development, Pattern Mining, and Pattern Usage.
2.2. Design Pattern and Software Quality
In these studies, the effect of design patterns on software quality, such as main-tainability, reusability, testability, extendibility, and so on, are examined. The software quality is measured by code metrics which include many metrics for object-oriented software, such as the number of classes, the depth of inheritance tree, average number of method in a class, and so on.
Ampatzoglou et al. [16] [17] studied effects of design patterns on quality and maintainability of the software systems. In one study [16], they examined two open source game software, one developed in JAVA other one developed in C++. They looked at two different versions of the games, one without design
pattern and one with design pattern. They found that using design patterns lo-wered the coupling and complexity at the same time increased cohesion and the number of classes. Design patterns also produced easily understandable, testable and maintainable code. In another study [17], they looked at Bridge, Abstract Factory, and Visitor patterns. They observe that in three cases the pattern solu-tion provides a more maintainable design, but there are cases, where the pattern is not the optimal solution. The use of a pattern in general produces more ex-tensible design too.
Ampatzoglou et al. [18] investigated the effect of design patterns on stability. In their study, they included 537 open source software projects and about 65,000 classes. They found that classes participate in one design pattern are often more stable than classes that do not use a design pattern. In addition, classes partici-pating on more than one design pattern are less stable than classes participate in one or classes don’t participate in any design pattern. Some of the design parents (Singleton, Facade, Mediator, Observer, Composite and Decorator) are more re-sistant to propagation of changes than others.
Elish [19] studied the impact of four structural design patterns (Adapter, Bridge, Composite and Facade) on stability. Results showed that Adapter, Bridge, Composite, and Facade design patterns all have a positive impact on sta-bility.
Di Penta et al. [20] investigated the change proneness of classes that are par-ticipating in design motifs on three open source software projects (JHotDraw, Eclipse-JDT, and Xerces). They selected 12 design patterns (Abstract Factory, Adapter, Command, Composite, Decorator, Factory Method, Observer, Proto-type, Singleton, State/Strategy, Template Method, and Visitor). They studied class role change proneness and kinds of changes happen over the different snapshots and releases of the software products. They found that in all three software products, Abstract Factory classes in Concrete Factory role change more often than the classes in Abstract Factory role and for Factory Method classes in Concrete Creator role are more change prone than Creator roles.
Huston [21] in his study selected Mediator, Bridge, and Visitor patterns and compared them with their non-pattern forms. He observed that the use of design patterns did not produce lower quality metrics.
Hsueh et al. [22] developed an object-oriented quality model, to validate if a design pattern is well-applied, for example, if the intended structural model re-ally resolves the quality problems.
Posnett et al. [23] examined the effect of pattern role on change-proneness. They collected data from 3 open source software projects (JHotDraw, Xerces and Eclipse JDT) and identified the pattern and meta-pattern instances. Most classes playing implementation roles are less change-prone when the size is not taking into consideration, but they are more change-prone after compensated for size.
Feitosa et al. [24] investigated pattern grime on 5 industrial projects. Their findings suggest that pattern grime depends on the pattern type and developer.
They observed that the Factory Method is more grime-prone and the Singleton is least grime-prone in comparison to other patterns. They also point out that developers who perform more changes on the software are less likely to accu-mulate grime.
Izurieta and Bieman [25] studied the accumulation of grime on the testability of design patterns. They selected Visitor, State and Singleton design patterns on an open source software project called JRefactory. They found that Singleton and Visitor patterns required more test cases in order to test new grime buildup. In the case of State pattern no significant grime buildup or decay was shown.
In another study, Izurieta and Bieman [26] investigated design pattern decay, grime and rot during the evolution of 3 open source software projects (JRefacto-ry, ArgoUML, eXist). Their results showed that there is little evidence for design pattern rot, but significant evidence of modular grime. Grime buildup has a negative impact on testability and adaptability of design patterns. Most grime build up occurred when the coupling of the classes increased.
Ampatzoglou et al. [27] investigated the reusability of design patterns, classes, and software packages. They compared the reusability of identified classes with the reusability of the patterns and the packages that these classes belong to. Based on results from 100 open source projects, they found that pattern-based approach provides statistically more reusable groups of classes. The results also suggested that in most of reusing the design pattern offers the best option.
Ampatzoglou et al. [28] built a repository to aid software developers and re-searchers. The repository helps user to easily search design patterns, projects and reusable components on game development. They perform experiments with researcher and developers with different levels of experience. Their results show that developers using the repository perform given programming assignments with fewer defects. They also measure the time required to perform the task, re-searchers and developers perform the task in shorter time compared to develop-ers using conventional methods. They point out that inexperienced usdevelop-ers are more likely to benefit from using the repository.
Aversano et al. [29] analyzed three open-source systems in their study. The study aimed to learn how frequent the object-oriented design patterns were modified and what kind of changes they underwent. They discovered that the patterns which played more important role in the software systems changed more frequently. They also found that large systems exhibited more changes in pattern implementation and fewer changes in method interfaces.
Some studies used controlled experiments to evaluate the quality of software solutions using design patterns.
Prechelt et al. [30] performed an experiment related to software maintenance by comparing design pattern to simpler alternative solutions. They found posi-tive effects of employing design patterns in shorter maintenance and additional flexibility compared with alternative solutions. In their replicated study [4], the results showed that the simpler versions of programs required shorter time to extend than their design pattern counterparts, especially for Abstract Factory
and Composite. However, in Krein et al.’s replication [31] of the original expe-riment of Prechelt et al. [30], they found that there were some contradictions when they compared the results to the original experiment. They concluded that they couldn’t find any helpful impact of employing design patterns.
Vokáč et al. [5] also performed an experiment to investigate design patterns use in maintenance. They found that Observer and Decorator required some training, but were easy to understand and shortened the maintenance time. Ab-stract Factory had minor positive effect on time required for the maintenance task and slightly improve quality. In case of Visitor, experiment shows that the programmers didn’t use the Visitor pattern to perform changes.
Ng et al. [32] [33] perform controlled studies on design patterns and
main-tenance. In their study [32], they investigated whether maintainers utilized dep-loyed design patterns, and what kind of tasks they performed when they used design patterns. They performed the study on 215 human subjects requiring 6 changes in 3 programs. Their results revealed that design patterns were used by most of the subjects to complete the anticipated changes. In another study [33], they investigated the potential effects of design patterns on the productivity of maintainers. They perform the study on 118 human subjects requiring 3 change tasks on a program. They found that previous exposure to the program and the presence of pattern-unaware solutions were strongly correlated with correctly completed maintenance tasks and time. They also concluded that neither prior exposure to design patterns nor prior exposure to the programming language was a significant factor.
Feitosa et al. [34] investigate the energy consumption on State/Strategy and Template Method on two open source software projects and compared their re-sults to alternative solutions. Their rere-sults showed that alternative solutions use less energy in many cases. They found that design patterns provide slightly bet-ter energy efficient solution only when they are implementing complex beha-viors like larger in method sizes and multiple calls to external classes.
Sahin et al. [35] performed an empirical study to explore the effect of the 15 GoF design patterns on energy usage. Their result showed that Factory Method, Prototype, Bridge, and Strategy patterns have moderate impact while Decorator pattern has substantial impact on energy usage.
Bunse and Stiemer [36] studied the impact of energy consumption of seven GoF design patterns (Facade, Abstract Factory, Observer, Decorator, Prototype, and Template Method) on Mobile Java applications. They concluded that Deco-rator and Prototype have a negative impact on energy consumption while Fa-cade, Observer or Template Method showed no impact difference.
Litke et al. [37] analyzed the impact of 6 design parents on energy consump-tion and performance. They concluded that there is no significant evidence that design patterns consume more energy.
2.3. Design Pattern and Software Defects
In the following studies, the use of design patterns and their effects on software
defects is investigated.
In an early paper, Vokáč [8] investigated the defects of the classes participated in selected design pattern on a large commercial software product. Five (Ob-server, Decorator, Singleton, Factory Method, and Template Method) out of 23 GoF’s [1] design patterns were included in the study. The finding from the quantitative results showed that Factory Method was correlated with lower fect rate. Template Method mostly used in simple context and slightly lower de-fect rate. Observer was correlated with higher dede-fect rates. When Singleton and Observer were both present in the same class, they were correlated with higher defect rate. No significant correlation was detected for Decorator. The author concluded that in the case of Observer and Singleton patterns, their uses were often complex that even the correct usage and implementation of these patterns might not be enough to reduce defect rate to average.
Aversano et al. [9] investigated whether the presence of defects in design pat-terns’ code was correlated with their induced crosscutting concerns. This study was a follow-up on their earlier study and the same three open-source systems were used [29]. They concluded that if a pattern included crosscutting concerns, defect rates of its classes could increase.
Gatrell et al. [10] investigated whether design pattern classes had more faults than non-design pattern classes in a commercial C# software product. They se-lected 13 design patterns for the study (Adaptor, Builder, Command, Creator, Factory, Method, Filter, Iterator, Proxy, Singleton, State, Strategy and Visitor). They found that Adaptor, Method, and Singleton patterns were more fault-prone than others. They found that pattern related classes had larger num-ber of lines of code added for the correction of the faults.
Elish and Mohammed [38] performed an empirical study on fault density of classes participate on design motifs. They didn’t find any clear tendency for the impact on fault density between participant and non-participant classes in de-sign motifs. They found that creational and behavioral dede-sign motifs are more fault dense than structural design motifs. Especially Factory Method, Adapter, Composite and Decorator show negative association while Builder shows posi-tive association with fault density.
Ampatzoglou et al. [39] performed a study on the impact of design patterns on software defects. They included 97 open source Java games and 11 GoF de-sign patterns to investigate the correlation between dede-sign patterns and software defects. They concluded that there is no correlation between the overall number of design pattern instances and defect frequency. There is also no correlation between the overall numbers of design pattern instances and debugging effec-tiveness. They reported that Adapter and Template Method are positively corre-lated to defect frequency while Abstract Factory, Singleton, Composite, Observ-er, State, Strategy, Prototype and Proxy patterns negatively correlated to defect frequency. They also reported that when the number of Observer and Singleton pattern instances increase number of bug fixing activities decrease.
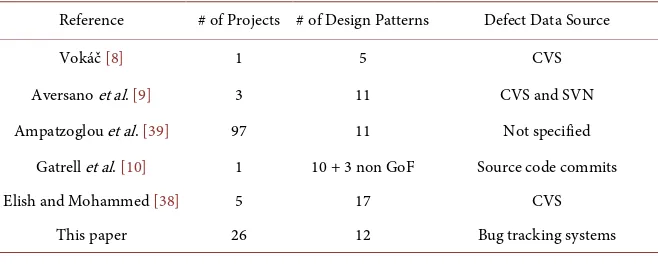
In summary, there have been many studies on effect of design pattern on software quality. Some of these previous studies investigated the relationship between design patterns and software defects. They focused on defect rate re-lated to design pattern classes. In their studies, software repositories were ex-amined to identify defects related design pattern classes. Like previous studies on design pattern and software defects, we also extract metrics from software repo-sitories. Unlike previous studies, we use a lot more open source software projects except [39] which they are only limited to open source game projects, and we extract metrics about defects, in addition to data about design patterns. This al-lows us to do more robust and comprehensive analysis. We also investigate the relationship between DPIs and defect priority by analyzing DPI metrics which is not studies previous studies. Table 1 shows the differences of our paper and previous works that have investigate the relationship between design patterns and defects.
3. Research Problems and Our Approach
The goal of this study is to understand the effect of design patterns on software quality. As software quality is directly related to software defects, we use metrics related to software defects as measurements of software quality. In this study, we investigate the relationship between design patterns and software defects.
The specific research problems we try to tackle are explained in Section 3.1. Section 3.2 describes our research approach to answer these research questions. The software metrics used in our research are summarized in Section 3.3.
3.1. Research Problems
To limit the scope of this study, we examine two categories of defect metrics: the first related to the number of defects and the second related to the priority of defects. As a consequence, we design two groups of investigations. In the first group, we investigate if design pattern instances are related to the number of de-fects. In the second group, we investigate if design pattern instances are related to the priority of defects.
[image:8.595.208.537.598.730.2]In the first group of investigations, we examine the relationship between de-sign pattern instance metrics and defect number metrics. We first examine if the
Table 1. Comparison with previous work.
Reference # of Projects # of Design Patterns Defect Data Source Vokáč [8] 1 5 CVS Aversano et al. [9] 3 11 CVS and SVN Ampatzoglou et al. [39] 97 11 Not specified
Gatrell et al. [10] 1 10 + 3 non GoF Source code commits Elish and Mohammed [38] 5 17 CVS
This paper 26 12 Bug tracking systems
number of design pattern instances in a project is correlated with the number of software defects in the project. In other words, does a software project with more design patterns instances have more defects? We perform various correlation analyses of design pattern metrics and defect number metrics. The design pat-terns metrics include individual design pattern instances as well as all design pattern instances together. The defect number metrics include the number of defects and defect rates (number of defects divided by line of code, number of defects divided by number of classes).
Next, we use regression to further examine how much design patterns in-stance metrics affect the defect number and defect rates. We investigate the ef-fect of individual design pattern instances on the deef-fect number and deef-fect rates. We perform regression analysis on design pattern metrics and defect number metrics to see how much variations in defect number and defect rates are ex-plained by the design pattern instance metrics.
In the second group of investigations, we examine design pattern instance metrics and defect priority metrics. We first investigate if the number of design pattern instances in a project is correlated to the priority of software defects in the project. In other words, does a software project with more design patterns have defects of higher priority? We also examine the individual design pattern instances and their correlation with defect priority. Also, we use defect rates where the number of defects is divided by line of code and by number of classes, respectively.
As in the first group, we use regression analysis to further examine how much design pattern instances affect the defect priority. We perform regression analy-sis on design pattern instance metrics and defect priority metrics to see how in-dividual design pattern instances affect the defect priority. Again, the analysis is repeated using defect rates where the number of defects is divided by line of code and by number of classes, respectively.
3.2. Our Approach
To answer the research questions listed in the previous section, we collect data from two kinds of software repositories: bug tracking system and source code repository. The metrics are then calculated from the data and are analyzed to understand the relationships between design patterns and defects.
In this section, the system we build to extract and analyze metrics data is plained. We first introduce the system architecture and the process. We then ex-plain each component of the system and the tools that are used in the compo-nents.
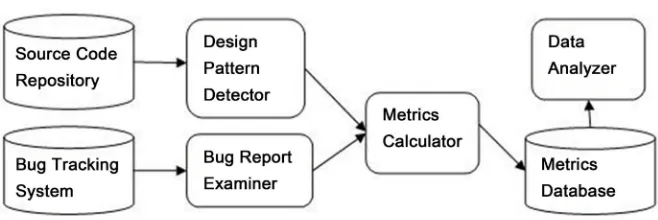
Figure 1 shows the overall system architecture. The system consists of four components: design pattern detector, bug report examiner, metric calculator, and data analyzer. The design pattern detector extracts design patterns data from the source code repository. The bug report examiner extracts defect data from the bug tracking system. The metric calculator computes design pattern metrics
Figure 1. System architecture and process.
and defect metrics from the data extracted by the design pattern detector and the bug report examiner and store them into a database. The metrics database is used by the metrics analyzer for various analyses.
Our study is carried out in four steps. In the first step, we select open source software projects and collected source codes and bug reports from the software repositories of these projects. In the second step, design pattern data and defect data are extracted from the codes and the reports by the design pattern detector and the bug report examiner, respectively. In step three, metrics are calculated from the data collected in the previous step and are compiled into a database, to be analyzed by the data analyzer in step four.
The components of the system in Figure 1 are described below. • Design Pattern Detector
The design pattern detector identifies design pattern instances in source codes. In our approach, we use the design pattern detector developed by Tsanta-lis [40]. It uses a graph matching based approach to detect design patterns in Ja-va bytecode. The tool is able to detect the following 12 design patterns: Factory Method, Singleton, Prototype, Adapter, Composite, Decorator, Proxy, Observer, State, Strategy, Template Method, and Visitor.
• Bug Report Examiner
A bug report contains information related to a software defect, such as severi-ty, prioriseveri-ty, type, status, comment, and so on. The bug report examiner scans the bug reports in the bug track systems and collects defect data from these reports. The bug report examiner is implemented using a tool called Bicho [41]. The tool retrieves the bug/issue related data from bug tracking system. It is able to retrieve data from various bug tracking systems, including SourceForge, Bugzil-la, Launchpad, and JIRA.
• Metrics Calculator
The metrics calculator computes various metrics related to design patterns and defects from the data extracted by the design pattern detector and the bug report examiner. The metrics are described in Section 3.3.
• Data Analyzer
The data analyzer examines the metrics extracted by the other three compo-nents. We use correlation analysis and regression analysis in examining the me-tric data. The data analyzer is implemented using IBM’s SPSS software package.
3.3. Metrics
The metrics we calculate from the software repositories include design pattern instance metrics and defect metrics.
3.3.1. Design Pattern Instance Metrics
[image:11.595.206.530.397.466.2]Design pattern instance metrics are software metrics related to design pattern instances and software size. There are two groups of metrics, the first related to the total number of design pattern instances in a software project, and the second related to the number of individual design pattern instances in a project.
[image:11.595.208.540.496.722.2]Table 2 summarizes the metrics related to the total number of instances of design patterns.
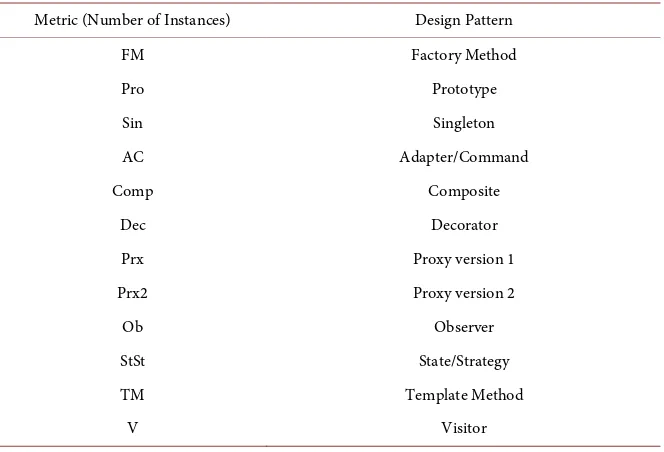
Table 3 summarizes the metrics related to the individual design pattern in-stances.
There are two versions of implementation for the Proxy design pattern. They are denoted as Prx and Prx2. Instances of Adapter and Command design pat-terns have the same structure so they are hard to distinguish. Their instances are combined as AC. Similarly, the State and Strategy design patterns are similar in implementation and their instances are combined into StSt.
The metrics in Table 3 represents the number of instance of individual design patterns. They can be divided by LOC and NOC to derive other metrics.
Table 2. Metrics for Total Number of Design Pattern Instances
Metric Description
NDPI Number of design pattern instances
NDPI/LOC Number of design pattern instances divided by line of code NDPI/NOC Number of design pattern instances divided by number of classes
Table 3. Metrics for Instances of Individual Design Patterns.
Metric (Number of Instances) Design Pattern FM Factory Method Pro Prototype Sin Singleton AC Adapter/Command Comp Composite
Dec Decorator Prx Proxy version 1 Prx2 Proxy version 2
Ob Observer StSt State/Strategy TM Template Method
V Visitor
For example, FM/LOC and FM/NOC represents the number of Factory Me-thod instances divided by line of code and by number of classes, respectively.
3.3.2. Defect Metrics
Bug tracking systems usually include information about defects, such as priority, type, severity, status, resolution, comments, description, submitter, and assigned to someone or not, etc. In our study, we use the number of defects and defect priority. Table 4 lists the defects metrics that are related to the number of defects and their priority in a software project, which are described below.
• Number of Defects, Defect Rate by LOC, and Defect Rate by NOC: the total number of defects detected in a software project (Nbugs), Nbugs divided by the lines of code, and Nbug divided by the number of classes.
• Defect priority: a categorization of software defect to signify the degree of urgency to be fixed. A lower number indicates a higher priority to fix a de-fect.
4. Results and Analyses
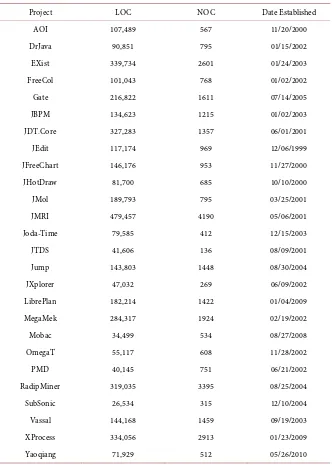
We selected 26 open sources software projects for our study. The projects are all written in Java. Moreover, to ensure we have enough data for a project, all se-lected project must have been around for more than 3 years.
They should be active which means they have been updated in the last 3 months. Bug tracking system of the projects should be available to public and they should provide bug related information like priority, description, and comments. Also the tool (Bicho) [41] we used in our study should be able to collect the information from bug tracking system without any error.
The projects are summarized in Table 5 below, with their name, line of code (LOC), number of classes (NOC), and starting date.
4.1. Design Pattern Instances and Number of Defects
In this section, we investigate the relationship between the number of design pattern instances (DPIs) and the number of defects in a project. We first look at total DPIs and the number of defects, followed by individual DPIs and the number of defects.
We first compute the correlation between the total number of DPIs and the total number of defects. The Pearson correlation shows that at project level, the total number of DPIs in a project is not correlated to the number of defects in
Table 4. Defect metrics.
Metric Description Nbugs Number of defects
Nbugs/LOC Number of defects divided by line of code Nbugs/NOC Number of defects divided by number of classes
AP Average priority of defects
Table 5. Software projects used in our study.
Project LOC NOC Date Established AOI 107,489 567 11/20/2000 DrJava 90,851 795 01/15/2002 EXist 339,734 2601 01/24/2003 FreeCol 101,043 768 01/02/2002 Gate 216,822 1611 07/14/2005 JBPM 134,623 1215 01/02/2003 JDT.Core 327,283 1357 06/01/2001 JEdit 117,174 969 12/06/1999 JFreeChart 146,176 953 11/27/2000 JHotDraw 81,700 685 10/10/2000 JMol 189,793 795 03/25/2001 JMRI 479,457 4190 05/06/2001 Joda-Time 79,585 412 12/15/2003 JTDS 41,606 136 08/09/2001 Jump 143,803 1448 08/30/2004 JXplorer 47,032 269 06/09/2002 LibrePlan 182,214 1422 01/04/2009 MegaMek 284,317 1924 02/19/2002 Mobac 34,499 534 08/27/2008 OmegaT 55,117 608 11/28/2002 PMD 40,145 751 06/21/2002 RadipMiner 319,035 3395 08/25/2004 SubSonic 26,534 315 12/10/2004 Vassal 144,168 1459 09/19/2003 XProcess 334,056 2913 01/23/2009 Yaoqiang 71,929 512 05/26/2010
that project, with a correlation coefficient of 0.103 and a p-value of 0.618. Since the number of DPIs and the number of defects may be related to project size, we then normalize the number of DPIs and the number of defects by line of code (LOC) and number of classes (NOC). The number of DPIs and the number of defects are divided by LOC, respectively, and their correlation is calculated. The analysis is repeated using NOC as the divisor. The results are similar to these without normalization. Using LOC as the divisor, the correlation coeffi-cient is −0.138 and the p-value is 0.501. Using NOC as the divisor, the correla-tion coefficient is −0.115 and the p-value is 0.574.
Table 6 summarizes the correlation analysis between total number of DPIs and the number of defects.
It is obvious that there is no correlation between the total number of DPIs and the number of defects. Normalized number of DPIs and normalized number of defects does not correlation either. The correlation analysis results show that, as a total, there are no correlation between the number of DPIs and the number of defects.
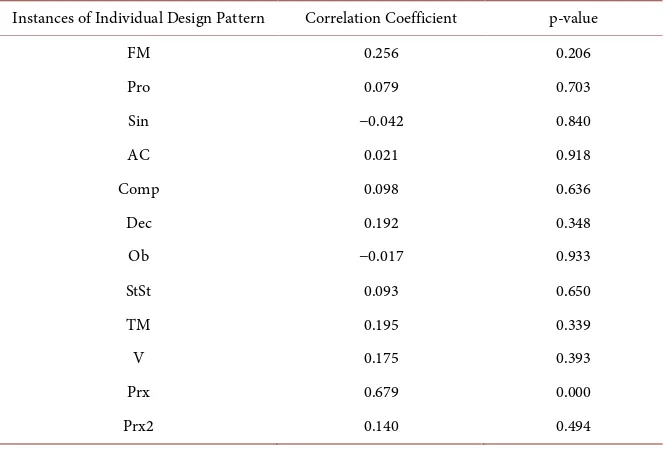
To further investigate the correlation between the number of DPIs and the number of defects, we look at the number of instances of individual design pat-terns. We perform correlation analysis between the number of defects and the number of instances of individual design patterns, as listed in Table 3. The re-sults are shown in Table 7. Other than the Proxy pattern, we do not find any significant correlation between the number of defects and the number of in-stances of individual design patterns.
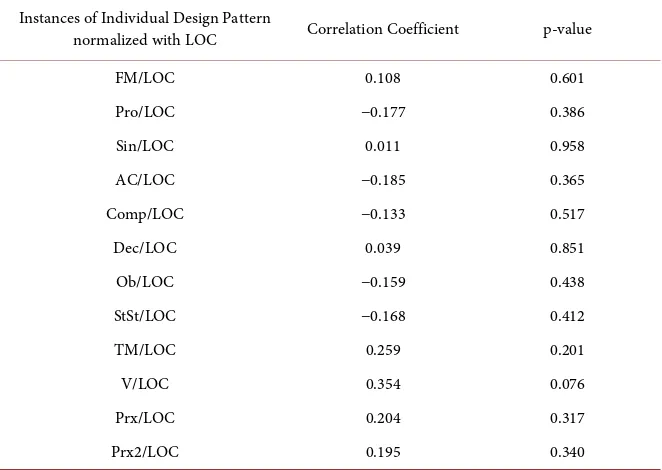
We repeat the correlation analysis with normalized number of defects and normalized number of instances of individual design patterns, i.e., they are both divided by LOC and NOC, respectively.
[image:14.595.204.541.387.455.2]As shown in Table 8, when the number of defects and the number of in-stances of individual design patterns are normalized by LOC, we do not find any design pattern whose normalized number of instances is significantly correlated with the normalized number of defects.
Table 6. Correlation between total number of dpis and number of defects.
Defect Metrics DPI Metric Correlation Coefficient p-value NBugs NDPI 0.103 0.618 Nbugs/LOC NDPI/LOC −0.138 0.501 Nbugs/NOC NDPI/NOC −0.115 0.574
Table 7. Correlation between number of instances of individual design patterns and number of defects.
Instances of Individual Design Pattern Correlation Coefficient p-value FM 0.256 0.206 Pro 0.079 0.703 Sin −0.042 0.840 AC 0.021 0.918 Comp 0.098 0.636 Dec 0.192 0.348 Ob −0.017 0.933 StSt 0.093 0.650 TM 0.195 0.339 V 0.175 0.393 Prx 0.679 0.000 Prx2 0.140 0.494
[image:14.595.207.539.497.722.2]Table 8. Correlation between number of instances of individual design patterns norma-lized with LOC and number of defects normanorma-lized with LOC.
Instances of Individual Design Pattern
[image:15.595.207.539.382.622.2]normalized with LOC Correlation Coefficient p-value FM/LOC 0.108 0.601 Pro/LOC −0.177 0.386 Sin/LOC 0.011 0.958 AC/LOC −0.185 0.365 Comp/LOC −0.133 0.517 Dec/LOC 0.039 0.851 Ob/LOC −0.159 0.438 StSt/LOC −0.168 0.412 TM/LOC 0.259 0.201 V/LOC 0.354 0.076 Prx/LOC 0.204 0.317 Prx2/LOC 0.195 0.340
Table 9. Correlation between number of instances of individual design patterns norma-lized with NOC and number of defects normanorma-lized with NOC.
Instances of Individual Design Pattern
normalized with NOC Pearson Correlation p-value FM/NOC 0.071 0.730 Pro/NOC −0.051 0.803 Sin/NOC −0.134 0.513 AC/NOC −0.158 0.442 Comp/NOC −0.102 0.620 Dec/NOC −0.026 0.898 Ob/NOC −0.188 0.357 StSt/NOC −0.109 0.595 TM/NOC 0.220 0.279 V/NOC 0.192 0.348 Prx/NOC 0.444 0.023 Prx2/NOC 0.001 0.996
Table 9 shows the correlation results when the number of defects and the number of instances of individual design patterns are normalized by NOC.
The results are similar to original numbers presented in Table 7. Proxy is the only design pattern whose normalized number of instances is significantly cor-related with the normalized number of defects.
However, even though there is little correlation between the number of
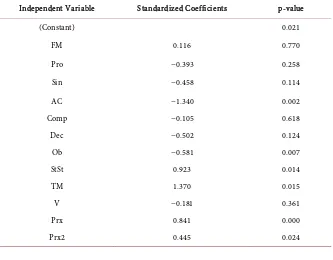
stances of individual design patterns and the number of defects, it is possible that a combination of them may affect significantly the number of defects. We perform linear regression analysis using the number of defect as dependent va-riable and the number of instances of individual design pattern as independent variables. The results show a strong relationship with R2 value of 0.846 and
[image:16.595.207.540.474.734.2]p-value of 0.002.
Table 10 summarizes the standardized coefficients and p-value of the linear regression.
It shows that six design patterns have a p-value below 0.05, AC (Adap-ter/Command), Ob (Observer), StSt (State/Strategy), TM (Template Method), Proxy, and Proxy 2. The number of instances of these six design patterns signif-icantly influences the number of defects. Especially, Adapter/Command and Observer instances have a negative impact the number of defects. This means that as the number of Adapter/Command and Observer instances increases, the number of defects decreases.
One possible explanation is that the use of Adapter/Command and Observer design patterns improves design and code such that there are fewer defects. Our finding on Observer pattern similar to [39] since Observer pattern has complex use more experienced users should implement. Studies in [8] and [29] contradict our findings on Observer pattern. Comparison to Gatrell et al. [10] our result show that Adapter/ Command design pattern has negative impact on number of defects while their study points out Adapter pattern more fault-prone. Our findings on Template Method similar with Vokáč [8] result it tends to lower de-fect rate.
Table 10. Linear regression of number of defects with number of instances of individual design patterns.
Independent Variable Standardized Coefficients p-value (Constant) 0.021
FM 0.116 0.770 Pro −0.393 0.258 Sin −0.458 0.114 AC −1.340 0.002 Comp −0.105 0.618 Dec −0.502 0.124 Ob −0.581 0.007 StSt 0.923 0.014 TM 1.370 0.015 V −0.181 0.361 Prx 0.841 0.000 Prx2 0.445 0.024
4.2. Design Pattern Instances and Defect Priority
In this section, we investigate the relationship between DPIs and defect priority by analyzing DPI metrics and defect priority metric. Of the 26 projects listed in Table 5, project JBPM does not have priority data in its bug tracking repository so it is excluded for this part of our study. We use data of the other 25 projects in Table 5 for analysis in this section.
The projects use two different scales for their priority value. Some use a 1 to 5 scale for their priority value. Others use a 1 to 9 scale. We first use the min-max normalization to linearly convert those projects using the 1 to 9 scale in to a scale of 1 to 5. For example, a priority of 4 in a 1 to 9 scale is converted into (4 − 1)/(9 − 1) * (5 − 1) + 1 = 2.5. The average priority of defects in every project is then calculated.
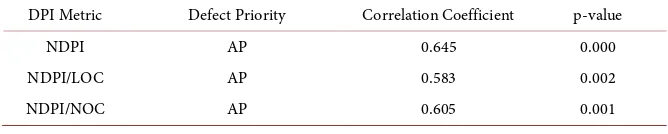
We use average priority, denoted as AP, in the reminder of this section. First, we perform correlation analysis between the number of total DPIs and AP. The Pearson correlation between the number of total DPIs and AP is 0.645 with a p-value of 0.000. It is obvious that there is at least moderate positive cor-relation between the number of total DPIs and AP. In other words, as the num-ber of total DPIs in a project increases, its defects tend to have larger priority values, which mean low priority of the defects.
We also calculated correlation between AP and normalized number of total DPIs, using LOC and NOC, respectively. The results are similar to these without normalization. The results are summarized in Table 11.
Next, we perform correlation analysis between the number of instances of in-dividual design patterns and AP. Table 12 summarizes the correlation analysis results.
From Table 12, we observe that four design patterns, AC (Adapter/Command), Prototype, State/Strategy, and Template Method, have a Pearson correlation coefficient above 0.5 and p-value below 0.05. These four design patterns show moderate positive correlation with the average priority. As the number of in-stances of these four design patterns increases, the average priority also increas-es, which means the defects have a lower priority on the average. The analysis is repeated for normalized number of instances of individual design patterns using both LOC and NOC. The results are similar so they are not presented.
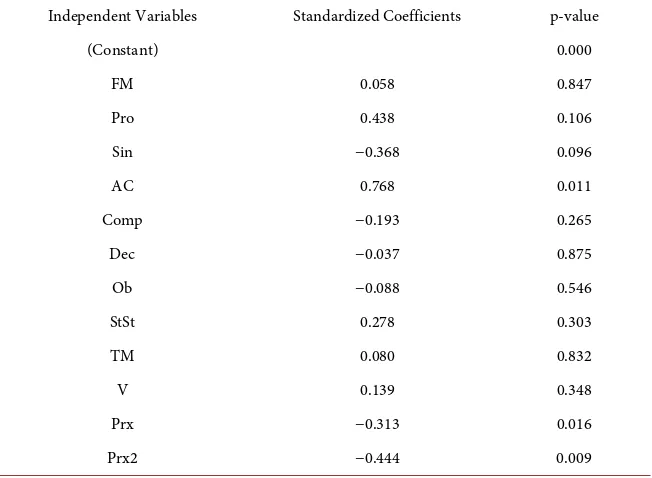
We then perform linear regression with average priority as dependent variable and the number of instances of individual design pattern as independent va-riables. Table 13 shows the results of the linear regression. It has an R2 value of
[image:17.595.205.539.660.727.2]0.922 and a significance value of 0.000. It is reasonable to conclude that the
Table 11. Correlation between number of total DPIs and average priority.
DPI Metric Defect Priority Correlation Coefficient p-value NDPI AP 0.645 0.000 NDPI/LOC AP 0.583 0.002 NDPI/NOC AP 0.605 0.001
Table 12. Correlation between number of instances of individual design patterns and av-erage priority.
Instances of Individual Design Pattern Correlation Coefficient p-value FM 0.430 0.032 Pro 0.545 0.005 Sin 0.298 0.149 AC 0.572 0.003 Comp 0.033 0.874 Dec 0.160 0.445 Ob 0.315 0.124 StSt 0.593 0.002 TM 0.635 0.001 V −0.022 0.915 Prx −0.155 0.459 Prx2 −0.241 0.245
Table 13. Linear regression of average priority using number of instances of individual design patterns.
Independent Variables Standardized Coefficients p-value (Constant) 0.000
FM 0.058 0.847 Pro 0.438 0.106 Sin −0.368 0.096 AC 0.768 0.011 Comp −0.193 0.265 Dec −0.037 0.875 Ob −0.088 0.546 StSt 0.278 0.303 TM 0.080 0.832 V 0.139 0.348 Prx −0.313 0.016 Prx2 −0.444 0.009
number of instances of individual design patterns affect average priority.
Form Table 13, it is apparent only instances of three design patterns, AC (Adapter/Command), Proxy, and Proxy 2 have a p-value below 0.05. Other design pattern instances do not seem to influence average priority. Adapter/Command has positive impact on average priority. The more Adapter/Command instances are in a project, the larger its average defect priority value is. Proxy and Proxy 2 both have negative impact on average priority. The more Proxy and Proxy 2
[image:18.595.213.539.367.606.2]stances in a project, the lower its average priority value is, i.e., the higher priority of defects.
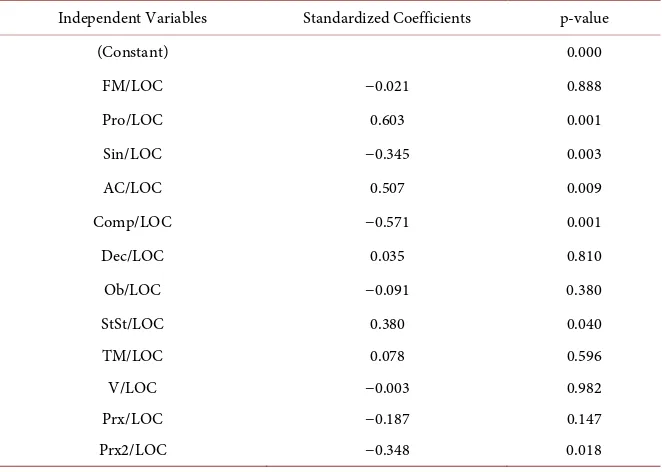
We also perform linear regression using number of design pattern instances normalized by LOC and NOC, respectively. Table 14 summarizes the linear re-gression results using the number of instances of individual design patterns di-vided by LOC. The regression has an R2 value of 0.929 and a p-value of 0.000.
Form Table 14, we found instances of six design patterns, Prototype, Single-ton, Adapter/Command, Composite, State/Strategy, and Proxy 2 have a p-value below 0.05. Of these six design patterns, instances of Prototype, Adap-ter/Command, and State/Strategy have positive impact on average priority, while instances of Singleton, Composite, and Proxy 2 have negative impact on average priority.
Table 15 summarizes the linear regression results using the number of in-stances of individual design patterns divided by NOC.
The regression has an R2 value of 0.906 and a p-value of 0.000. It is obvious
from Table 15 that instances of five design patterns, Prototype, Adapter/Command, Composite, Proxy, and Proxy 2 have a p-value below 0.05. Instances of Proto-type and Adapter/Command have positive impact on average priority, i.e., more instances per class correlated with higher priority values. Instances of Compo-site, Proxy, and Proxy 2 have negative impact on average priority.
[image:19.595.208.539.488.724.2]For the three cases of linear regression analysis on instances of individual de-sign patterns, using number of instances, number of instances divided by LOC, and number of instances divided by NOC, respectively, we see some similarities and some differences. All three shows that instances of Adapter/Command have positive effect on average priority and instances of Proxy 2 have negative effect
Table 14. Linear regression using number of instances of individual design patterns normalized with LOC.
Independent Variables Standardized Coefficients p-value (Constant) 0.000
FM/LOC −0.021 0.888 Pro/LOC 0.603 0.001 Sin/LOC −0.345 0.003 AC/LOC 0.507 0.009 Comp/LOC −0.571 0.001 Dec/LOC 0.035 0.810 Ob/LOC −0.091 0.380 StSt/LOC 0.380 0.040 TM/LOC 0.078 0.596 V/LOC −0.003 0.982 Prx/LOC −0.187 0.147 Prx2/LOC −0.348 0.018
Table 15. Linear regression using number of instances of individual design pattern nor-malized with NOC.
Independent Variables Standardized Coefficients p-value (Constant) 0.000
FM/NOC 0.011 0.953 Pro/NOC 0.670 0.000 Sin/NOC −0.167 0.259 AC/NOC 0.628 0.004 Comp/NOC −0.556 0.001 Dec/NOC 0.048 0.743 Ob/NOC 0.003 0.978 StSt/NOC 0.241 0.198 TM/NOC 0.081 0.577 V/NOC 0.103 0.376 Prx/NOC −0.374 0.013 Prx2/NOC −0.311 0.022
on average priority. Also, instances of Prototype show positive impact on aver-age priority when using normalized number of instances. Similarly, instances of Composite show negative impact on average priority when using normalized number of instances.
Based on above investigations, we conclude that the number of instances of several design patterns has significant effect on the number of defects and their priority.
5. Threats to Validity
There are several threats to the validity of our study. We discuss the serious threats in the following.
1) Not all design patterns are detected.
The design pattern detector used in our study [40] finds only 12 design pat-terns. Though it has been shown to be effective in that it recognizes all instances of these 12 design patterns with a low false positive rate, it does not detect other design patterns. There are many more other design patterns. For example, the Gang of Four (GoF) book [1] cataloged 23 design patterns, and many more de-sign patterns have been cataloged after the book’s publication. It is almost cer-tain that there are other design pattern instances in these projects that we stu-died. If these 12 design patterns are typical of all design patterns, i.e., they are good representatives of all design patterns, our results would apply to all design patterns. Otherwise, our results should be interpreted only in terms of these 12 design patterns.
One way to solve the problem is to improve the design pattern detector so that it can find more design patterns. We are actively looking for a more powerful
design pattern detector.
2) Defects are accumulated over time.
The defect data are extracted from the projects’ bug tracking repositories. A project’s bug tracking repository contains all defects reported since the initiation of the project. Since the projects have different initiation date as presented in Table 5, older projects would normally have more defects than newer projects. This is somewhat alleviated that all projects are at least 3 years old. As observed by Kan [42], at least half of a software system’s field defects are revealed in their first year of operation. It is reasonable to expect majority of a project’s defects are detected in the first 3 years.
3) Priority values may not be consistent among the projects.
As we described in Section 4.2, the projects in our study uses two different scales for defect priority. Some use a scale of 1 to 5 and others use a scale of 1 to 9. We use min-max normalization to transform 1 to 9 scale to 1 to 5 scale. This would introduce some inaccuracy since priority values are not necessarily as-signed linearly, e.g., a priority value of 4 does not necessarily mean twice more urgent compared to a priority value of 8. Even for the projects using the 1 to 5 scale, they may not assign priority values consistently, e.g., a priority value 5 in a project may be assigned a priority value 4 in another project. A universal guide-line for assigning priority values would help to eliminate this kind of discrepancy.
There are some other threats such as incomplete data in repositories, different application domains of projects, and different skill levels and capabilities of de-velopers. We think these threats are minor and we do not discuss them in detail.
6. Conclusions and Future Work
In this study, we investigate the relationship of design patterns and software de-fects in a number of open source software projects. In particular, we analyze re-lationships between design pattern metrics and software defect metrics using correlation and regression analysis. In our first group of investigations, we find there is little correlation between the total number of design pattern instances and the number of defects. The number of instances of individual design pattern also does not correlate with the number of defects, except for the Proxy pattern. However, the number of instances of individual design patterns as a group has strong influences on the number of defects. Especially, the number of instances of Adapter/Command, Observer, State/Strategy, Template Method, and Proxy patterns has significant impact on the number of defects.
In our second group of investigations, we found moderate positive correlation between the number of design pattern instances and average defect priority. Moreover, the number of instances of Prototype, Adapter/Command, State/Strategy, and Template Method, is positively correlated with average prior-ity. When considered as a group, the number of instances of Adapter/Command and Proxy 2 has been found to have significant effect on average priority. Proto-type and Composite instances, when divided by LOC or NOC, also show
icant effect on average priority.
Design patterns have been widely used in software development. Our research extends previous studies on design pattern and software defects by using soft-ware defect metrics from bug tracking repositories, in particular, defect priority. There are many ways to extend our research in the future. We discuss some possible future work below.
In the future studies, we can focus finer level of granularity, i.e., role level of design pattern instances and classes.
It is obvious that our study can be extended to use other defect metrics, such as defect fixing time. It will be interesting to investigate how the number of de-sign pattern instances affects other defect metrics.
The design pattern detector used in our study can only find 12 design pat-terns. One worthwhile research direction is to develop more powerful pattern detectors that can find more design patterns accurately and efficiently.
Since defects are related to complexity, another interesting research topic is to investigate the impacts of design pattern instances on software complexity. We are investigating design pattern instances and their impacts on software com-plexity metrics.
References
[1] Gamma, E., Helm, R., Johnson, R. and Vlissides, J. (1995) Design Patterns: Ele-ments of Reusable Object-Oriented Software. Addison-Wesley, Boston.
[2] Riehle, D. (2011) Lessons Learned from Using Design Patterns in Industry Projects. Transactions on Pattern Languages of Programming II: Special Issue on Applying Patterns, Springer-Verlag, Berlin, Heidelberg.
[3] Beck, K., Coplien, J.O., Crocker, R., Dominick, L., Meszaros, G., Paunlisch, F. and Vlissides, J. (1996) Industrial Experience with Design Patterns. In: 18th Intl. Conf.
on Software Engineering, IEEE CS Press, Berlin, 103-114. https://doi.org/10.1109/ICSE.1996.493406
[4] Prechelt, L. and Liesenberg, M. (2011) Design Patterns in Software Maintenance: An Experiment Replication at Freie Universität Berlin. In: Proceedings of the 2011
Second International Workshop on Replication in Empirical Software Engineering Research, IEEE Computer Society, Washington DC, 1-6.
https://doi.org/10.1109/RESER.2011.12
[5] Vokáč, M., Tichy, W., Sjøberg, D.I.K., Arisholm, E. and Aldrin, M. (2004) A Con-trolled Experiment Comparing the Maintainability of Programs Designed with and without Design Patterns—A Replication in a Real Programming Environment. Em-pirical Software Engineering, 9, 149-195.
[6] Bieman, J.M., Straw, G., Wang, H., Munger, P.W. and Alexander, R.T. (2003) De-sign Patterns and Change Proneness: An Examination of Five Evolving Systems. In:
Proceedings of the 9th International Symposium on Software Metrics, IEEE Com-puter Society, Washington DC, 40.
[7] Prechelt, L., Unger, B., Philippsen, M. and Tichy, W.F. (2002) Two Controlled Ex-periments Assessing the Usefulness of Design Pattern Documentation in Program Maintenance. IEEE Transactions on Software Engineering, 28, 595-606.
https://doi.org/10.1109/TSE.2002.1010061
[8] Vokáč, M. (2004) Defect Frequency and Design Patterns: An Empirical Study of Industrial Code. IEEE Transactions on Software Engineering, 30, 904-917. https://doi.org/10.1109/TSE.2004.99
[9] Aversano, L., Cerulo, L. and Di Penta, M. (2009) The Relationship between Design Patterns Defects and Crosscutting Concern Scattering Degree: An Empirical Study.
IET Software, 3, 395-409. https://doi.org/10.1049/iet-sen.2008.0105
[10] Gatrell, M. and Counsell, S. (2011) Design Patterns and Fault-Proneness a Study of Commercial C# Software. Research Challenges in Information Science—RCIS, Gosier, 1-8. https://doi.org/10.1109/RCIS.2011.6006827
[11] Xie, T., Thummalapenta, S., Lo, D. and Liu, C. (2009) Data Mining for Software En-gineering. Computer, 42, 55-62. https://doi.org/10.1109/MC.2009.256
[12] Ampatzoglou, A., Charalampidou, S. and Stamelos, I. (2013) Research State of the Art on GoF Design Patterns: A Mapping Study. Journal of Systems and Software, 86, 1945-1964.https://doi.org/10.1016/j.jss.2013.03.063
[13] Zhang, C. and Budgen, D. (2012) What Do We Know about the Effectiveness of Software Design Patterns? IEEE Transactions on Software Engineering, 38, 1213-1231.
[14] Zhang, C. and Budgen, D. (2013) A Survey of Experienced User Perceptions about Software Design Patterns. Information and Software Technology, 55, 822-835. [15] Bafandeh Mayvan, B., Rasoolzadegan, A. and Ghavidel Yazdi, Z. (2017) The State of
the Art on Design Patterns: A Systematic Mapping of the Literature. Journal of Sys-tems and Software, 125, 93-118.https://doi.org/10.1016/j.jss.2016.11.030
[16] Ampatzoglou, A. and Chatzigeorgiou, A. (2007) Evaluation of Object-Oriented De-sign Patterns in Game Development. Information and Software Technology, 49, 445-454.https://doi.org/10.1016/j.infsof.2006.07.003
[17] Ampatzoglou, A., Frantzeskou, G. and Stamelos, I. (2012) A Methodology to Assess the Impact of Design Patterns on Software Quality. Information and Software Technology, 54, 331-346.https://doi.org/10.1016/j.infsof.2011.10.006
[18] Ampatzoglou, A., Chatzigeorgiou, A., Charalampidou, S. and Avgeriou, P. (2015) The Effect of GoF Design Patterns on Stability: A Case Study. IEEE Transactions on Software Engineering, 41, 781-802.
[19] Elish, M. (2006) Do Structural Design Patterns Promote Design Stability? 30th An-nual International Computer Software and Applications Conference, Chicago, Sep-tember 2006, 215-220.https://doi.org/10.1109/COMPSAC.2006.39
[20] Di Penta, M., Cerulo, L., Gueheneuc, Y.G. and Antoniol, G. (2008) An Empirical Study of the Relationships between Design Pattern Roles and Class Change Prone-ness. IEEE International Conference on Software Maintenance, Beijing, 217-226.
https://doi.org/10.1109/ICSM.2008.4658070
[21] Huston, B. (2001) The Effects of Design Pattern Application on Metric Scores.
Journal of Systems and Software, 58, 261-269.
[22] Hsueh, N.-L., Chu, P.-H. and Chu, W. (2008) A Quantitative Approach for Eva-luating the Quality of Design Patterns. Journal of Systems and Software, 81, 1430-1439.
[23] Posnett, D., Bird, C. and Dévanbu, P. (2011) An Empirical Study on the Influence of Pattern Roles on Change-Proneness. Empirical Software Engineering, 16, 396-423. [24] Feitosa, D., Avgeriou, P., Ampatzoglou, A. and Nakagawa, E. (2017) The Evolution
of Design Pattern Grime: An Industrial Case Study.
https://doi.org/10.1007/978-3-319-69926-4_13
[25] Izurieta, C. and Bieman, J.M. (2008) Testing Consequences of Grime Buildup in Object Oriented Design Patterns, 1st International Conference on Software Testing,
Verification, and Validation, Lillehammer, 171-179.
[26] Izurieta, C. and Bieman, J.M. (2013) A Multiple Case Study of Design Pattern De-cay, Grime, and Rot in Evolving Software Systems. Software Quality Journal, 21, 289-323.
[27] Ampatzoglou, A., Kritikos, A., Kakarontzas, G. and Stamelos, I. (2011) An Empiri-cal Investigation on the Reusability of Design Patterns and Software Packages.
Journal of Systems and Software, 84, 2265-2283. https://doi.org/10.1016/j.jss.2011.06.047
[28] Ampatzoglou, A., Michou, O. and Stamelos, I. (2013) Building and Mining a Repo-sitory of Design Pattern Instances: Practical and Research Benefits. Entertainment Computing, 4, 131-142.
[29] Aversano, L., Canfora, G., Cerulo, L., Del Grosso, C. and Di Penta, M. (2007) An Empirical Study on the Evolution of Design Patterns. In: Proceedings of the 6th Joint Meeting of the European Software Engineering Conference and the ACM SIGSOFT Symposium on The Foundations of Software Engineering, ACM Press, New York, 385-394.https://doi.org/10.1145/1287624.1287680
[30] Prechelt, L., Unger, B., Tichy, W.F., Brössler, P. and Votta, L.G. (2001) A Controlled Experiment in Maintenance Comparing Design Patterns to Simpler Solutions. IEEE Transactions on Software Engineering, 27, 1134-1144.
[31] Krein, J.L., Pratt, L.J., Swenson, A.B., MacLean, A.C., Knutson, C.D. and Eggett, D.L. (2011) Design Patterns in Software Maintenance: An Experiment Replication at Brigham Young University. In: Proceedings of the 2011 Second International Workshop on Replication in Empirical Software Engineering Research, IEEE Computer Society, Washington DC, 25-34.https://doi.org/10.1109/RESER.2011.10
[32] Ng, T.H., Cheung, S.C., Chan, W.K. and Yu, Y.T. (2007) Do Maintainers Utilize Deployed Design Patterns Effectively? In: Proceedings of the 29th International Conference on Software Engineering, IEEE Computer Society, Washington DC, 168-177.https://doi.org/10.1109/ICSE.2007.33
[33] Ng, T.H., Yuen, T.Y., Cheung, S.C. and Chan, W.K. (2012) Human and Program Factors Affecting the Maintenance of Programs with Deployed Design Patterns. In-formation and Software Technology, 54, 99-118.
[34] Feitosa, D., Alders, R., Ampatzoglou, A., Avgeriou, P. and Nakagawa, E.Y. (2017) Investigating the Effect of Design Patterns on Energy Consumption. Journal of Software: Evolution and Process, 29, e1851.https://doi.org/10.1002/smr.1851
[35] Sahin, C., Cayci, F., Lizeth, I., et al. (2012) Initial Explorations on Design Pattern Energy Usage. 2012 First International Workshop on Green and Sustainable Soft-ware, Zurich, 55-61.https://doi.org/10.1109/GREENS.2012.6224257
[36] Bunse, C. and Stiemer, S. (2013) On the Energy Consumption of Design Patterns. 2nd Workshop Energy Aware Software Engineering and Development.
https://doi.org/10.1007/s40568-013-0020-6
[37] Litke, A., Zotos, K., Chatzigeorgiou, A. and Stephanides, G. (2005) Energy Con-sumption Analysis of Design Patterns. World Academy of Science, Engineering and Technology, 86-90.
[38] Elish, M.O. and Mohammed, M.A. (2015) Quantitative Analysis of Fault Density in Design Patterns: An Empirical Study. Information and Software Technology, 66, 58-72.https://doi.org/10.1016/j.infsof.2015.05.006
[39] Ampatzoglou, A., Kritikos, A., Arvanitou, E.M., Gortzis, A., Chatziasimidis, F. and Stamelos, I. (2011) An Empirical Investigation on the Impact of Design Pattern Ap-plication on Computer Game Defects. In: Proceedings of the 15th International Academic MindTrek Conference: Envisioning Future Media Environments, ACM, New York, 214-221.https://doi.org/10.1145/2181037.2181074
[40] Tsantalis, N., Chatzigeorgiou, A., Stephanides, G. and Halkidis, S.T. (2006) Design Pattern Detection using Similarity Scoring. IEEE Transactions on Software Engi-neering, 32, 896-909. https://doi.org/10.1109/TSE.2006.112
[41] Bicho Homepage. http://metricsgrimoire.github.io/
[42] Kan, S. (2002) Metrics and Models for Software Reliability Engineering. 2nd Edi-tion, Addison-Wesley, Boston.