Development of Large-Scale Land Information
System (LIS) by Using Geographic Information
System (GIS) and Field Surveying
Asma Th. Ibraheem
Department of Civil Engineering, College of Engineering, Nahrain University, Baghdad, Iraq Email: [email protected]
Received October 14, 2011; revised January 12, 2012, accepted January 20, 2012
ABSTRACT
Cadastral maps are an important component of land administration in most countries. In virtually all developed coun- tries, the needs of computerized land and geographic information systems (LIS/GIS) has given urgent impetus to com- puterizing cadastral maps and creating digital cadastral data bases (DCDB). This process is creating many institutional, legal, technical and administrative problems. This desire to establish DCDBs is being given increased impetus due to a new range of enabling technologies such as satellite position fixing (GPS), improved spatial data collection techniques such as digital theodolites and “soft copy” photogrammetry, as well as a vast range of new information and communi- cations technological tools, thus contributing to the advancement and keeping up with the great countries. This paper presents the problem of cadastral maps. The hitherto existing cadastre, consisting of paper maps and land registers, is now becoming insufficient. Its shortcomings force developments leading to its improvement. One of the ways is the creation of a Land Information System. A digital cadastral map is the main component of this system. The structure and information content of the map is presented, its differences from analogue maps are shown, and the process of map creation is described. A digital cadastral map can be the basis for additional thematic layers, successively converting it into a complex system for management of administrative units.
Keywords: Cadastral Map; Geographic Information System (GIS); Land Information System (LIS); Mapping; Surveying
1. Introduction
A cadastre is normally a parcel based, and up-to-date land information system containing a record of interests in land (e.g. rights, restrictions and responsibilities). It usually includes a geometric description of land parcels linked to other records describing the nature of the interests, the ownership or control of those interests, and often the value of the parcel and its improvements.
Graphical indices of these parcels, known as cadastral maps, show the relative location of all parcels in a given region. Cadastral maps commonly range from scales of 1:500 to 1:10,000. Large scale diagrams or maps showing more precise parcel dimensions and features (e.g. build- ings, irrigation units, etc.) are often prepared by cadastral surveys for each parcel based on ground surveys and aerial photography. Information in the textual or attribute files of the cadastre, such as land value, ownership, or use, can be accessed by these unique parcel codes shown on the cadastral map, thus creating a complete cadastre [1].
The principal responsibility of the assessor is to locate,
systems. Such sharing is becoming increasingly sophis- ticated, ranging from allowing users to download data or prepared maps, allowing users to make sophisticated que- ries that may draw on the power of the host GIS’s software and hardware [3]. Computerized mapping systems may be referred to by several names. They include [4]:
Geographic information system (GIS). Land information system (LIS). Digital multipurpose cadastre.
Multipurpose land information system (MPLIS). Land parcel database.
2. The Views of a GIS
A GIS is most often associated with a map. A map, however, is only one way that can work with geographic data in a GIS, and only one type of product generated by a GIS. A GIS can provide a great deal more problem- solving capabilities than using a simple mapping pro- gram or adding data to an online mapping tool (creating a “mash-up”). A GIS can be viewed in three ways [5]:
1) The Database View. 2) The Map View. 3) The Model View.
Together, these three views are critical parts of an intelligent GIS and are used at varying levels in all GIS applications. Data needed for GIS can be obtained in various ways and are stored in a digital form, they are known as digital data in GIS today. Digital data are ob- tained primarily by the following means (Ibraheem, 2008):
1) Incorporating remotely sensed data into GIS. 2) Digitizing existing maps and plans.
3) Digitizing Ariel photographs (mono or stereo).
3. Components of a Digital Cadastral
Mapping System
A digital cadastral mapping system should have the fol- lowing components [3]:
Reference to a geodetic control network.
Current base map layer (ideally, photogrammetrically derived).
A cadastral layer delineating all real property parcels. Vertical aerial photographs and/or images (ideally,
ortho-rectified).
A unique parcel identifier assigned to each parcel. A means to tie spatial data to attribute data (owner-
ship and parcel characteristic files).
Additional layers of interest to the assessor, such as municipal boundaries, zoning, soil types, and flood plains.
4. Computerisation of Cadastral Maps
The justification for computerizing cadastral maps in-
cludes the following:
The reduction of duplication in maintaining a cadas- tral base for many users.
As a result of converting maps from one scale to an-other.
To bring the cadastral map onto the same coordinate and mapping system as large scale topographic maps, thereby facilitating LIS/GIS applications.
An important issue in establishing a digital cadastral data bases (DCDB) is that computerization of the cadas- tral maps in general cannot be justified for land registra- tion or land market reasons. Therefore computerization of the map requires the support of other users both finan- cially and institutionally, [6].
At the institutional level, there is an issue of who is responsible for maintaining the DCDB and distributing the updates. Obviously it is necessary for one organiza- tion to administer the DCDB although there are various models using both government and the private sector to maintain the system [6].
5. Large-Scale Land Information Systems
Large-scale geographic and land information systems (GIS and LIS) are developing rapidly in local and state governments and other organizations across the country. These systems handle critical information related to land parcels, transportation, utilities, and other infrastructure and facilities. They are changing the way organizations operate and make decisions, and therefore, they affect the daily activities and lives of the citizens and customers of these organizations.
The attributes of different types of geospatial data— such as land ownership, roads and bridges, buildings, lakes and rivers, counties, or congressional districts—can each constitute a layer or theme in GIS. (See Figure 1 for a schematic representation of data layers in GIS.)
6. Case Study
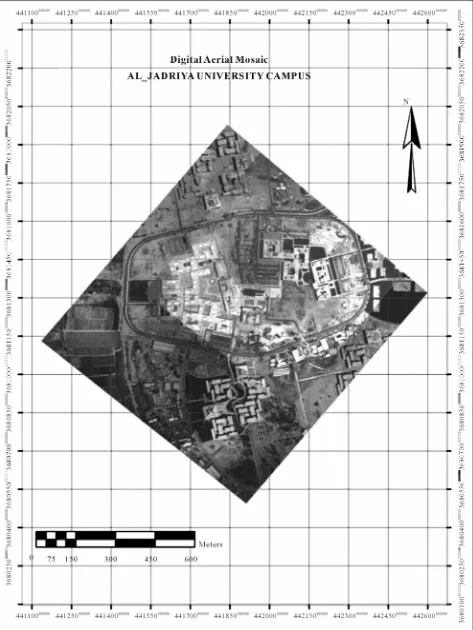
1) A digital base map for Baghdad University site. 2) Eight digital Arial photos provided by surveying department as shown in Figure 2.
3) Historical data, photographs, reproduction and sur- veying details.
4) Additional descriptive information was also col- lected.
[image:3.595.59.289.83.291.2]A mosaic is an assembly of series of overlapping aerial photographs to form one continuous picture of the terrain. It may consist of a single strip of photographs, termed a strip mosaic, or it may be contain many overlapping strips. The images used in this study captured from space by the military in (July 1985) with focal length (152.16 mm), flying height (456.48 m) and scale the image (1/ 3000) which is illustrated in Figure 2. The completion of this work needing to several enough aerial photos of the area. The mosaics have been found that the University of Baghdad covered pace aviation are flight (110, 111). All the airline has four images so that there is a common area shows each image of the photo that followed in the line of flight, one is called the forward overlap or overlap the front and the amount (60%). And also there is an overlap (side lap) or (End Lap) hereunder (30%) were converted this image to a digital format (Digital form) using (Scan- ner). Tthen saved on CD in the Department of Surveying Engineering, which is used to transfer this image to a calculator to work with them.
Figure 1. Example of GIS data layers or themes [7].
formation. However there is still a need for an improved flow line of the process as more dataset type and volume covering other survey datasets held in a survey organiza- tion would be used. The testing of the design and flow line has clearly shown the possibility to disseminate, re- trieve and combine those data for visualization and query over the web from multiple different data sources. Ar- cGIS functionality is proved offering capabilities for geospatial data interchange, manipulation and manage- ment as well. The ArcGIS application has clearly shown the successes of the concept of data integration on-the-fly from multiple heterogeneous geospatial data servers.
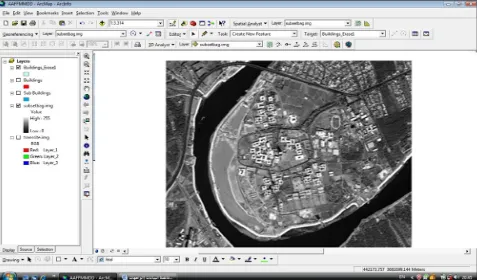
Matching the mosaic images usually implies that the radiometric intensity data from one image representing a particular feature must be matched to the intensity data from the second image, representing the same feature. This implies more than just matching image intensity data correlation, because the same piece feature may look considerably different radio metrically from different point of view, or at different time. Figure 3 shows the matching the mosaic of eight digital Arial photos of
6.1. Data Collection and Conversion
Both analogue and digital data are gathered for the study area including:
[image:3.595.98.499.530.720.2]that the points were inaccurately measured or poorly Baghdad University site by using ERDAS LPS (V 9.2)
software. identified. But in this study the resulted accuracy Root
Mean Square Error (RMSE) was (0.0775) which was very acceptable.
6.2. Lis Structure and Analysis
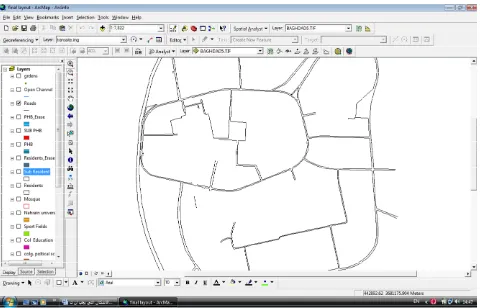
The ArcGIS software was used to provide a digital map with multi layers for that study area. The layers which were formed were eight layers are: layer of col- leges, layer of departments, layer of roads way, layer of mosque, layer of parking, layer of sport fields, layer of gardens, layer of open channel, layer of sub roads and layer of status. Figures (6)-(8) illustrate the drawings of The LIS’s structure is performed into the ArcGIS envi-
ronment, which provides easy and efficient data man- agement and analysis. The specific application includes the integration of the above mentioned coverage into ArcGIS as themes and the implementation of the data- base, and organized according to the following thematic data types (Figure 4):
1) Colleges; 2) Departments; 3) Roadways; 4) Parks; 5) Green spots; 6) Channels; 7) Mosque; 8) Sport Fields; 9) Residents.
[image:5.595.60.537.437.717.2]Zooming in the map, a more detailed display of the area is obtained, facilitating the investigation process. Through the use of the menu, the desired entity type is displayed, further divided into sub-types, according to specific characteristics. The Start-up screen of the system displays a map of the whole area included in the ArcGIS software (Figure 5). An error of less than 1.0000 pixels is acceptable. An error of greater than 1.0000 indicates
Figure 4. The zoom in the entity of College of Engineering in Baghdad University site by using ArcGIS environment.
Figure 6. Layer of road way.
Figure 8. Layer of open channels.
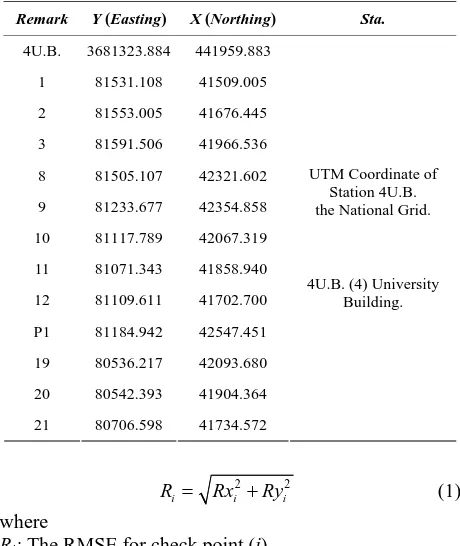
Table 1. Ground control points (GCPs) in UTM system. some of these layers (roads way, gardens and open chan-
nel).
Remark Y (Easting) X (Northing) Sta.
4U.B. 3681323.884 441959.883
1 81531.108 41509.005
2 81553.005 41676.445
3 81591.506 41966.536
8 81505.107 42321.602
9 81233.677 42354.858
10 81117.789 42067.319
11 81071.343 41858.940
12 81109.611 41702.700
P1 81184.942 42547.451
19 80536.217 42093.680
20 80542.393 41904.364
21 80706.598 41734.572
UTM Coordinate of Station 4U.B. the National Grid.
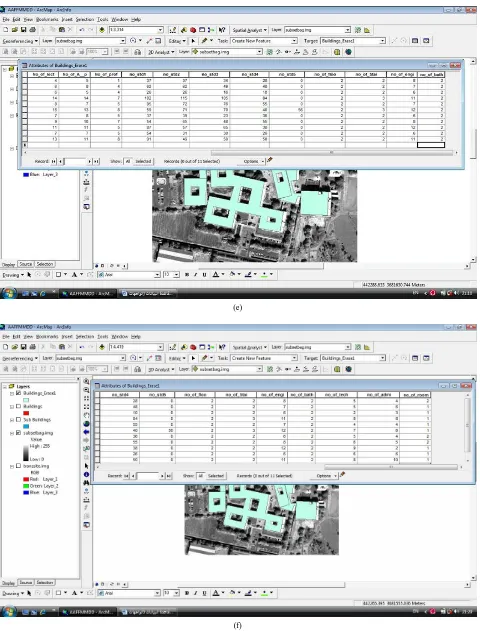
4U.B. (4) University Building. Clicking on the area of the interest a second dialog
window is presented to the user including all the entity types of the area (Figures 9(a)-(f)). A button linked to an Arial photo of the area is also available.
The application results in digital dynamic map of 1/ 10,000 scale, as shown in Figure 10, associated to de- scriptive and multimedia information about the site of Baghdad University.
6.3. Accuracy of Digital Mapping
In this study, after the production of mosaic for that study area stereo pair of the final form the ArcGIS software was used to prepare a digital map with multi layers. The layers include roads layer, colleges layer, residential sec- tors layer, sport fields layer, parking layer, sub roads layer, gardens layer and urban places layer. After the completion of the drawing layers, the digital map was produced in its final form with scale of 1:10,000. This scale is appropri-ated to the scale of digital aerial photographs that were used in the production, which in turn was to be used to produce the digital map; thirteen points were selected as check points as shown in Table 1 to compute the resulted accuracy Root Mean Square Error (RMSE) by using the following equations:
2
i i
R Rx Ry2
i (1)
where
Ri: The RMSE for check point (i).
Rxi: The X residual for check point (i), (the distance
[image:7.595.308.538.433.706.2](a)
(c)
(e)
[image:10.595.60.540.79.710.2](f)
direction).
Ryi: The Y residual for check point (i), (the distance
between the source and the transformed coordinates in y direction).
Depending upon the residuals, the RMSE in X coordi- nate, the RMSE in Y coordinate, and the total RMSE can be computed from the following equations:
2 1 1 n x xi i R n
R (2)2 1 1 n y yi i R n
R (3)2
T x
R R R2y (4)
where:
RT: total Root Mean Square Error (RMSE).
n: number of check points.
Thirteen point were selected for the checking the ac- curacy in digital map, the resulted accuracy ((Root Mean Square Error (RMSE)) computed by using a special Equation (4) as described above was 55 cm, which was suitable for the production of large scale mapping. The selected scale map is suitable and appropriate for the scale of aerial photographs that have been used in the production of the map, and the possible use of the map produced and used at any time possible and updates its data using Geographic Information System (GIS) soft- ware.
7. Conclusions
It is well known that GIS has already become a standard tool for handling spatial data. GIS are now more com- monplace in Iraq. Adding multimedia material and orga- nizing friendly entries and alternative search techniques, the system then becomes an efficient tool for different users. Until only a few years ago the map was perceived as a static, plain view of preselected areas, available at fixed scales and, due to the development of the landscape, often out of date. Now, it is evolving into a dynamic, continually updated network of interrelated databases
with volumes of geographically referenced information linked to a comprehensive digital cadastral database. As shown above, our study results in efficient Land Infor- mation System for the study area. This system may be improved, by adding the following steps:
1) Promote and ensure the reliability and integrity of large-scale land information systems and Facilitate col- laboration between GIS and surveying professionals at the local, regional, and national levels.
2) Promote the use of sound surveying and mapping principles in the development and the use of land infor- mation systems.
3) Foster the development and adoption of useful stan- dards, specifications, and procedures for the development, operations, and the use of land information systems.
4) The LIS’s structure conducts the user’s navigation through alternative searching paths, created by the appli- cation.
REFERENCES
[1] J. L. G. Henssen, “Cadastre, Indispensable for Develop- ment,” International Institute for Aerospace Survey and Earth Sciences (ITC), Enschede, 1990.
[2] G. Larsson, “Land Registration and Cadastral Systems,” Longman Scientific and Technical, New York, 1991. [3] W. Y. Wan and I. P. Williamson, “A Review of the Digi-
tal Cadastral Databases in Australia and New Zealand,”
The Australian Surveyor, Vol. 40, No. 1, 1995, pp. 41-52. [4] ASCE Editorial, “Basic of Geographic Information Sys-
tem,” Journal of Computing in Civil Engineering, ASCE, January 1998, pp. 1-4.
[5] A. Th. Ibraheem, “The Application of Geographical Infor- mation System in Civil Engineering,” Integrating Teach- ing and Research with Community Service, Book No. 87, University of Sharjah, Sharjah, 2008, pp. 436- 455. [6] I. Williamson and S. Enemark, “Cadastre and Land Man-
agement,”The University of Melbourne, Melbourne, 1994.
![Figure 1. Example of GIS data layers or themes [7].](https://thumb-us.123doks.com/thumbv2/123dok_us/9257908.414987/3.595.98.499.530.720/figure-example-of-gis-data-layers-or-themes.webp)