PATTERN OF CHANGES IN THE LEVELS OF SERUM UREA AND CREATININE IN NORMAL
PREGNANCY AND AT DIFFERENT PERIODS OF GESTATION
WITH AGE, PARITY AND HEMOGLOBIN STATUS
1
Liji, K.,
1,*Rebecca Abraham,
1
Departments of Biochemistry and Malabar Medical College Hospital and Research Centre
2Department of Obstetrics and Gynecology, Malabar Medical College Hospital and Research Centre
ARTICLE INFO ABSTRACT
The levels of serum urea and creatinine were determined in 134 pregnant women and 44 non pregnant controls. There was a significant (p=0.0094) decrease in urea levels between the
(15.4± 4.3 mg/dl) and the nonpregnant group (17.3±3.2mg/dl) and a highly significant (p<0.0001) decrease in creatinine levels between the pregnant (0.66±0.11mg/dl) and nonpregnant controls (0.76±0.09mg/dl). The pregnant women were categorized into
36w)and (37
groups were analyzed. There was no significant change in urea levels at 0 the controls .At 13
decrease from 25
different periods of gestation.(p<0.0001). There were 56 uniparous and 78 multiparous women was no significant decrease in urea and creatinine levels with increasing parity or age or with decreasing hemoglobin levels. The progressive decrease in creatinine levels across the different periods of gestation can be attributed to increased glo
clearance. However the changes in urea cannot be explained by increased GFR alone. Other factors like higher salvage of urea or increased N
This study ha
Copyright © 2015 Liji et al. This is an open access article distributed under the Creative Commons Att distribution, and reproduction in any medium, provided the original work is properly cited.
INTRODUCTION
Pregnancy is a normal physiological phenomenon associated with dramatic changes in the maternal environment. Adaptation to pregnancy involves anatomic, physiologic and metabolic changes in the mother which assists the nurturing and survival of the foetus. Although all maternal physiological systems undergo adjustment as a result of pregnancy the greatest upheaval is to the renal system (Isra
2006). The plasma volume increases by as much as 50%. These changes are accompanied by alteration in the concentration of many plasma constituents
2013).
*Corresponding author: Rebecca Abraham,
Departments of Biochemistry and Malabar Medical College Hospital and Research Centre Kozhikode, Kerala India.
ISSN: 0975-833X
Vol.
Article History:
Received 27th August, 2015 Received in revised form 22nd September, 2015 Accepted 17th October, 2015 Published online 30th November,2015
Key words:
Urea, Creatinine,
Pregnancy, Weeks of gestation, Parity, Age, Hemoglobin, Reference range.
Citation:Liji, K., Rebecca Abraham, Beena Kumari
normal pregnancy and at different periods of gestation
Current Research, 7, (11), 23268-23272.
RESEARCH ARTICLE
PATTERN OF CHANGES IN THE LEVELS OF SERUM UREA AND CREATININE IN NORMAL
PREGNANCY AND AT DIFFERENT PERIODS OF GESTATION – ITS ASSOCIATION
WITH AGE, PARITY AND HEMOGLOBIN STATUS
Rebecca Abraham,
1Beena Kumari, and
2Prajisha
of Biochemistry and Malabar Medical College Hospital and Research Centre
Kerala, India
Obstetrics and Gynecology, Malabar Medical College Hospital and Research Centre
Kerala, India
ABSTRACT
The levels of serum urea and creatinine were determined in 134 pregnant women and 44 non pregnant controls. There was a significant (p=0.0094) decrease in urea levels between the
(15.4± 4.3 mg/dl) and the nonpregnant group (17.3±3.2mg/dl) and a highly significant (p<0.0001) decrease in creatinine levels between the pregnant (0.66±0.11mg/dl) and nonpregnant controls (0.76±0.09mg/dl). The pregnant women were categorized into
36w)and (37-40w) as per their weeks of gestation and the levels of urea and creatinine in these groups were analyzed. There was no significant change in urea levels at 0
the controls .At 13-24 weeks there was a significant increase(p<0.0001) followed by a significant decrease from 25-40 weeks(p<0.0001). The serum creatinine levels decreased significantly across different periods of gestation.(p<0.0001). There were 56 uniparous and 78 multiparous women was no significant decrease in urea and creatinine levels with increasing parity or age or with decreasing hemoglobin levels. The progressive decrease in creatinine levels across the different periods of gestation can be attributed to increased glomerular filtration rate (GFR) and reduced clearance. However the changes in urea cannot be explained by increased GFR alone. Other factors like higher salvage of urea or increased N2 accretion by the mother may contribute to these variations. This study has also enabled us to establish a reference range for urea and creatinine in pregnancy.
is an open access article distributed under the Creative Commons Attribution License, which distribution, and reproduction in any medium, provided the original work is properly cited.
Pregnancy is a normal physiological phenomenon associated with dramatic changes in the maternal environment. Adaptation to pregnancy involves anatomic, physiologic and metabolic changes in the mother which assists the nurturing Although all maternal physiological systems undergo adjustment as a result of pregnancy the
Isra and Hamdani,
The plasma volume increases by as much as 50%. These changes are accompanied by alteration in the concentration of many plasma constituents (Patricia et al.,
Departments of Biochemistry and Malabar Medical College Hospital
Biochemical parameters reflect
are clearly distinct from the non pregnant state (
Renal function during pregnancy can be adequately assessed by the levels of serum urea and creatinine. The lowering of the normal range of values of urea and creati
pregnancy has clinical significance as a normal urea and creatinine level in a pregnant female may indicate an underlying renal disease (Patricia
This study was therefore initiated to establish a reference interval for urea and creatinine at different weeks of gestation for pregnant women of this region. The pattern of changes if any in the levels of serum urea and creatinine at different periods of gestation would be analysed. In addition, the association between these levels w
haemoglobin status of mother would be analysed.
International Journal of Current Research
Vol. 7, Issue, 11, pp.23268-23272, November, 2015
INTERNATIONAL
, Rebecca Abraham, Beena Kumari, and Prajisha, B. 2015.“Pattern of changes in the levels of serum urea and creatinine in normal pregnancy and at different periods of gestation – its association with age, parity and hemoglobin
PATTERN OF CHANGES IN THE LEVELS OF SERUM UREA AND CREATININE IN NORMAL
ITS ASSOCIATION
Prajisha, B.
of Biochemistry and Malabar Medical College Hospital and Research Centre Kozhikode,
Obstetrics and Gynecology, Malabar Medical College Hospital and Research Centre Kozhikode,
The levels of serum urea and creatinine were determined in 134 pregnant women and 44 non pregnant controls. There was a significant (p=0.0094) decrease in urea levels between the pregnant (15.4± 4.3 mg/dl) and the nonpregnant group (17.3±3.2mg/dl) and a highly significant (p<0.0001) decrease in creatinine levels between the pregnant (0.66±0.11mg/dl) and nonpregnant controls 4 groups (0-12w), (13-24w), (25-40w) as per their weeks of gestation and the levels of urea and creatinine in these groups were analyzed. There was no significant change in urea levels at 0-12 weeks as compared to there was a significant increase(p<0.0001) followed by a significant 40 weeks(p<0.0001). The serum creatinine levels decreased significantly across different periods of gestation.(p<0.0001). There were 56 uniparous and 78 multiparous women. There was no significant decrease in urea and creatinine levels with increasing parity or age or with decreasing hemoglobin levels. The progressive decrease in creatinine levels across the different merular filtration rate (GFR) and reduced clearance. However the changes in urea cannot be explained by increased GFR alone. Other factors accretion by the mother may contribute to these variations. s also enabled us to establish a reference range for urea and creatinine in pregnancy.
ribution License, which permits unrestricted use,
Biochemical parameters reflect these adaptive changes which are clearly distinct from the non pregnant state (Tran, 2005). Renal function during pregnancy can be adequately assessed by the levels of serum urea and creatinine. The lowering of the normal range of values of urea and creatinine during pregnancy has clinical significance as a normal urea and creatinine level in a pregnant female may indicate an
Patricia et al., 2013).
This study was therefore initiated to establish a reference creatinine at different weeks of gestation for pregnant women of this region. The pattern of changes if any in the levels of serum urea and creatinine at different periods of gestation would be analysed. In addition, the association between these levels with age, parity, and haemoglobin status of mother would be analysed.
INTERNATIONAL JOURNAL OF CURRENT RESEARCH
MATERIAL AND METHODS
The subjects involved in the study included 134 healthy pregnant women attending the ante-natal clinic of Malabar Medical College and Research Centre, Calicut. They were in the age group 20-40 years. 44 age matched non –pregnant women were selected as controls for this study. This study was approved by the Ethical Committee of Malabar Medical College Hospital and Research centre. Written informed consent was taken from all subjects include in the study.
The 134 pregnant subjects were further divided into 4 groups.
0-12 weeks of gestation (31 subjects) 13-24 weeks of gestation (10 subjects) 25-36 weeks of gestation (68 subjects) 37-40 weeks of gestation (25 subjects)
A complete history of every pregnant woman was obtained including age, parity, family history, drug intake. Patients suffering from hypertension, hypertensive disorders of pregnancy, cardiac failure, diabetes mellitus, nephropathy, infectious diseases or those on any medication which would influence the results were excluded from the study. The gestational age was determined by calculation from the date of the last menstrual period and confirmed by ultrasonography. Blood samples were collected by anterior cubital fossa venepuncture during routine visits. Specimens were analyzed within 2-3 hours of sampling.
Estimation of serum Urea and Creatinine:
Was carried out on the Fully Automated Analyzer EM 360 (TRANSASIA BIOMEDICAL LTD, ERBA MANHEIM, GERMANY). Serum urea was estimated by the GLDH method (CORAL CLINICAL SYSTEMS) (Chaney, A.L., 1962). Creatinine was estimated by the modified Jaffe’s kinetic method (CORAL CLINICAL SYSTEMS) (Bowers, L.D., 1980). Hemoglobin was analyzed on the Hematology 5- parts Analyzer (MINDRAY, CHINA).
Statistical analysis
The data was analyzed using one way Analysis of Variance (ANOVA) followed by the Student’s T test. The results were expressed as mean ± standard deviation and p< 0.05 was considered as statistically significant (Steel and Torrie, 1980).
RESULTS
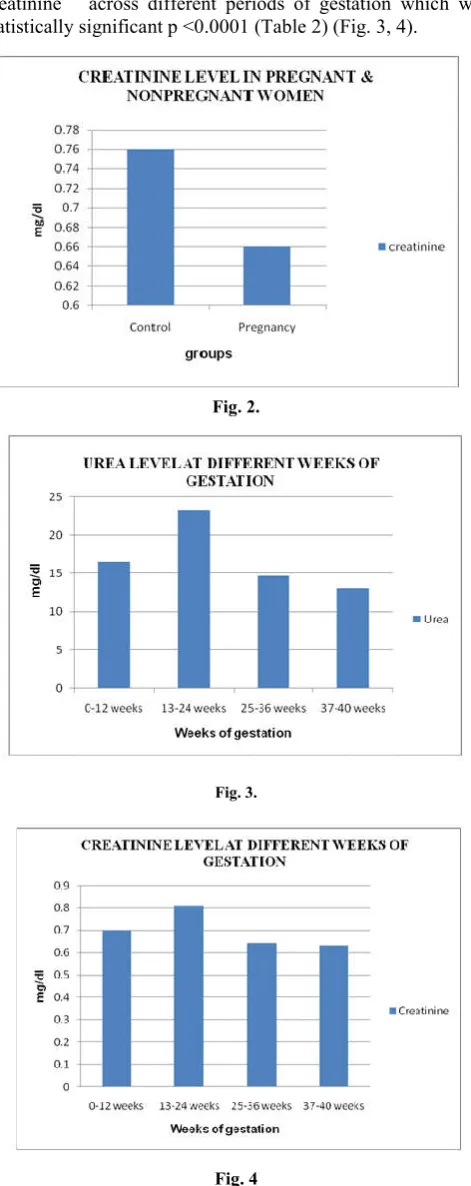
[image:2.595.312.552.252.425.2]There were 44 control subjects and 134 pregnant women. The mean levels of urea and creatinine were respectively 15.4 ± 4.3 mg/dl and 0.66 ±0.11mg/dl in pregnant women and 17.3±3.2 and 0.76±0.09 in nonpregnant controls. (Table1).There was a significant decrease (p=0.0094) in urea levels and a highly significant decrease (P<0.0001) in creatinine levels in pregnant women as compared to the controls. (Table 1, Figs 1, 2).
Fig. 1.
[image:2.595.166.436.555.607.2]The levels of urea and creatinine were further analyzed at different periods of gestation. The pattern of change in levels of urea was typical.
Table 1. Levels of urea & creatinine in normal pregnant Vs control group
Parameter Control group (mean ± SD) (n = 44)
Pregnancy (mean ± SD) (n = 134)
t Value p Value
Urea (mg/dl) 17.3 ± 3.2 15.4 ± 4.3 2.63 0.0094* Creatinine (mg/dl) 0.76 ±0.09 0.66 ± 0.11 4.98 < 0.0001** Level of significance using unpaired t-Test (p Value< 0.05 = significant) ** Extremely significant * Significant
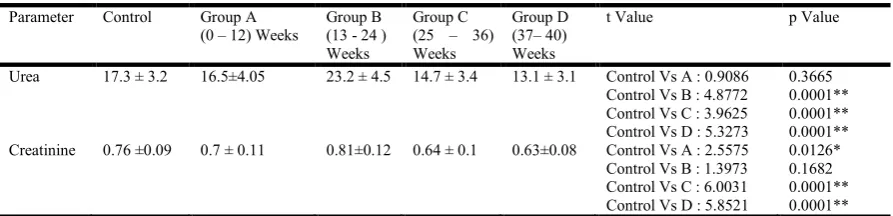
Table 2. t -Test for urea & creatinine level in control group Vs pregnant group at different weeks of gestation
Parameter Control Group A (0 – 12) Weeks
Group B (13 - 24 ) Weeks
Group C (25 – 36) Weeks
Group D (37– 40) Weeks
t Value p Value
Urea 17.3 ± 3.2 16.5±4.05 23.2 ± 4.5 14.7 ± 3.4 13.1 ± 3.1 Control Vs A : 0.9086 Control Vs B : 4.8772 Control Vs C : 3.9625 Control Vs D : 5.3273
0.3665 0.0001** 0.0001** 0.0001** Creatinine 0.76 ±0.09 0.7 ± 0.11 0.81±0.12 0.64 ± 0.1 0.63±0.08 Control Vs A : 2.5575
Control Vs B : 1.3973 Control Vs C : 6.0031 Control Vs D : 5.8521
0.0126* 0.1682 0.0001** 0.0001** Level of significance using unpaired t-Test (p Value< 0.05 = significant) Extremely Significant ** * Significant
[image:2.595.79.526.652.760.2]The results showed that there was no significant change in urea levels at 0-12 weeks of gestation as compared to the controls. At 13- 24 weeks there was a significant increase (p<0 .0001) followed by a progressive decrease from 25- 40 weeks of gestation which was significant (p<0 .0001). On the other hand there was a progressive decrease in the levels of serum creatinine across different periods of gestation which was statistically significant p <0.0001 (Table 2) (Fig. 3, 4).
Fig. 2.
Fig. 3.
Fig. 4
There were 56 uniparous women and 78 multiparous women. There were no significant changes in urea and creatinine levels between women of these 2 groups (Table 3).
There was no significant decrease in urea and creatinine levels with increasing parity (Table 4). The average age of the control group was 30.5±5.1 and that of the pregnant group was 26.6±4.1. Table 5 shows the age wise distribution of pregnant women and controls with the corresponding urea and creatinine levels. There was no significant change in urea and creatinine levels with increasing age (Table 5). It is interesting to note that the lowest level of urea and creatinine in pregnant women is seen in the age group 36- 40 years whereas higher levels of urea and creatinine are seen in non pregnant women at 36-40 years. This data was not statistically significant. The hemoglobin levels of pregnant women were significantly lower as compared to the control group (p=0.0001) (Table 6). There was no significant (p>0.05) change in urea and creatinine at different levels of Hb. (Table 7).
DISCUSSION
During pregnancy a woman undergoes several physiological changes predominantly hematological, cardiovascular, hormonal and renal. The hemodynamic profile of pregnancy is
Table 3. Levels of urea & creatinine in uniparous Vs multiparous group
Parameter Uniparous (mean ± SD)
(n = 56)
Multiparous (mean ± SD) (n = 78)
t Value p Value
Urea (mg/dl) 15.8 +/- 4.5 15.4 +/- 4.2 0.4359 0.6637 Creatinine (mg/dl) 0.6 +/- 0.1 0.67 +/- 0.12 0.6049 0.5464 Level of significance using unpaired t-Test (p Value< 0.05 = significant) ** Extremely significant * Significant
Table 4. Parity Vs Urea & Creatinine
Parity n Urea Creatinine 1 56 15.8 ± 4.5 0.66 ± 0.1 2 47 14.5 ± 3.7 0.67 ± 0.12 3 16 17.4 ± 4.8 0.7 ± 0.12 4 15 12.9 ± 2.4 0.59 ± 0.08
Table 5. Age Vs urea & creatinine
Age Pregnancy Control
n Urea Creatinine n Urea Creatinine 20-25 56 13.8 ± 3.8 0.64 ± 0.09 10 16.8 ± 1.03 0.75 ± 0.05 26-30 55 17.6 ± 4.7 0.68 ± 0.12 10 18.6 ± 4.5 0.7 ± 0.11 31-35 18 14.5 ± 3.1 0.67 ± 0.1 13 16.7 ± 3.1 0.7 ± 0.11 36-40 5 12 ± 2.2 0.6 ± 0.14 11 17.3 ± 3.2 0.8 ± 0.04
Table 6. Hemoglobin levels in pregnant Vs control group
Parameter Control group (mean ± SD)
N=44
Pregnancy (mean ± SD)
N=134
t Value p Value
Hb (g %) 12.3 ± 0.8 11.5 ± 1.1 3.92 0.0001* Level of significance using unpaired t-Test (p Value< 0.05 = significant) * Significant
Table 7. Levels of urea & creatinine at different levels of Hb
Hb Urea Creatinine 13.1 - 15 14.0 ± 2.9 0.65 ± 0.05 10.1 - 13 16.3 ± 4.6 0.67 ± 0.1
[image:3.595.44.280.127.721.2]characterized by an increase in intravascular volume, cardiac output and heart rate (Isra, and Hamdani, 2006).
In association with this is an increase in renal plasma flow and glomerular filtration rate. Also seen is a decrease in serum albumin levels and raised progesterone and aldosterone levels. With the increase in glomerular filtration rate the clearance of urea and creatinine increases and their plasma levels are lowered in pregnancy (Patricia et al., 2013; Tran, 2005). In our study there was a significant decrease in urea levels and a highly significant decrease in creatinine levels between the control group and the pregnant group (Table 1). A similar decrease has been noted in other studies (Tran, 2005;
Heidemann and McClure, 2003).
A few studies have reported changes in urea and creatinine levels at different trimesters of pregnancy. Hamdani reported a highly significant decrease (p<0.01) in the urea and creatinine levels between the 1st trimester (6-13weeks) and control group and a non significant decrease in these parameters between the 3rd trimester and control group (Isra and Hamdani, 2006). He also noted a significant increase in creatinine levels during 3rd trimester as compared to the 1st trimester. A significant decrease in the levels of serum creatinine from the 1st to the 3rd trimester was noted by Patricia and co-workers. However the decrease in urea levels was not significant (Patricia et al., 2013). We have looked at the pattern of change in levels of serum urea and creatinine at different periods of gestation (Table 2). On comparing with the control urea levels showed no significant change at 0-12 weeks with a significant increase at 13-24 weeks followed by a progressive decrease from 25-40 weeks (Table 2).
Our results are in agreement with reports of other workers Egwuatu (Egwuatu, 1983), Flamingh and Merwe (De Flamingh and van der Merwe, 1984), Moniz et al., (Moniz
et al., 1985), Janet (King, 2000). Ahaneku and co-workers in
2009 reported an increase in urea levels in pregnant women(8mmoles/L) between 18-28 weeks of gestation (23.04 ± 5.06weeks) but the increase was not significant as compared to the non pregnant women (6.5 mmoles/L) (Ahaneku et al.,
2009). Interestingly an increase in urea levels between
pregnant (23.2mg %) and non pregnant control groups was also observed in our study between 13-24 weeks of gestation. The pattern of changes in urea cannot be explained by increased GFR alone (De Flamingh and van der Merwe, 1984; Moniz et al., 1985). Forrester et al. noted a higher salvage of urea N in the 1st trimester which fell significantly by the 3rd trimester (Forrester et al., 1994). Excretion of urea fell and a
greater proportion of urea was channeled into the N2 metabolic
pool.
Kalhan has also noted changes in maternal protein and N2
metabolism appearing early in gestation aimed primarily at N2
accretion by the mother (Kalhan, 2000). There was a progressive decrease in creatinine levels across the different periods of gestation which can be attributed to the increased GFR and reduced clearance seen in pregnancy (Patricia et al.,
2013; Tran, 2005).
Effect of Parity and Age: Parity ranged from 1-4 previous
pregnancies. There was no significant change in urea and creatinine levels between the uniparous and multiparous group (Table 3, p > 0.05). Levels of urea and creatinine when analyzed in the 2 groups at different periods of gestation or with increasing parity also showed no change (Table 4). The age ranged from 0-40 years. No correlation of age with renal function was apparent from this study. (Table 5)
Hemoglobin concentration: Fluid overload (hypervolemia)
causes decreased Hemoglobin concentration and apparent anemia. The anemia of pregnancy is induced by blood volume
expansion. As expected there was a significant decrease (p< 0.0001) in Hb levels in the pregnant group as compared to
the controls (Table 6). There was no significant change in urea
and creatinine levels at different levels of Hb. (Table 7). (p Value > 0.05). Several glomerular diseases may occur in
women of child bearing age (Smyth et al., 2013). In most types of renal disease, pregnancy has no long term adverse effects on the maternal kidney provided that preconception renal function is close to normal. There is also clear evidence that pregnancy is damaging to the long term health of the kidney when maternal renal function is already compromised.
The likelihood of pregnancy induced damage is related more to the initial level of renal dysfunction than to the specific disease (Baylis, 2009). In this context Tran had emphasized that each laboratory, where practicable, should develop its own reference ranges for the pregnant women (Tran, 2005).
Several other studies have given their reference range for the pregnant women (Tran, 2005; Heidemann and Mc Clure 2003) at different trimesters of pregnancy (Patricia et al., 2013; Abbassi-Ghanavati, et al., 2009) and at different periods of
gestation (De Flamingh and van der Merwe, 1984; Moniz
et al., 1985). We have in our study been able to establish a
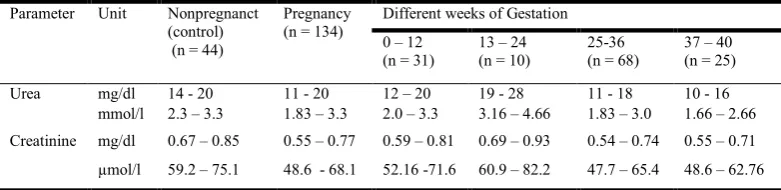
[image:4.595.104.495.112.207.2]reference range for the entire group of pregnant women and at different periods of gestation. (Table 8)
Table 8. Reference intervals for pregnant and nonpregnant group
Parameter Unit Nonpregnanct (control) (n = 44)
Pregnancy (n = 134)
Different weeks of Gestation
0 – 12 (n = 31)
13 – 24 (n = 10)
25-36 (n = 68)
37 – 40 (n = 25)
Urea mg/dl 14 - 20 11 - 20 12 – 20 19 - 28 11 - 18 10 - 16 mmol/l 2.3 – 3.3 1.83 – 3.3 2.0 – 3.3 3.16 – 4.66 1.83 – 3.0 1.66 – 2.66
Creatinine mg/dl 0.67 – 0.85 0.55 – 0.77 0.59 – 0.81 0.69 – 0.93 0.54 – 0.74 0.55 – 0.71
µmol/l 59.2 – 75.1 48.6 - 68.1 52.16 -71.6 60.9 – 82.2 47.7 – 65.4 48.6 – 62.76
Conclusion
The renal system undergoes marked changes in function during pregnancy. The pattern of changes in the level of urea and creatinine the 2 accepted markers of renal function were studied. A highly significant decrease in the levels of creatinine was observed in the pregnant group as compared to the controls. This decrease was progressive through the different periods of gestation which may be attributed to an increase in glomerular filtration rate which occurs in normal pregnancy. A significant decrease in urea was seen in the pregnant group. However when analysed at different periods of gestation it was observed that a highly significant decrease in urea occurred between 25-40 weeks of gestation. There was no significant change at 0-12 weeks of gestation and a small but significant increase between 13-24 weeks of gestation.
This strongly supports the contention that the pattern of changes in urea cannot be explained by increased GFR alone. Other factors like higher salvage of urea in the Ist trimester
(Ahaneku et al., 2009) or increased N2 accretion by the mother
in the earlier weeks of pregnancy may contribute to the variations in urea seen (Forrester et al., 1994). Importantly this study has enabled us to establish a reference range for urea and creatinine for pregnant women of this Malabar region of Kerala, India which in turn can influence the management of both the mother and fetus.
Acknowledgment
We would like to express our gratitude to the Management of Malabar Medical College Hospital and Research Centre, Kozhikode, Kerala, India
REFERENCES
Abbassi-Ghanavati, M., Greer, L.G.and Cunningham, F.G. 2009. Pregnancy and laboratory studies: a reference table for clinicians. Obstet. Gynaecol., 114(6):1326-1331. Ahaneku, J.E., Adinma, J.I., Ahaneku, G.I., Nwosu, B.O.,
Nwofor, P.C. and Okoli, C.C. 2009. Nigerian Journal of
Clinical Practice., 12 (2):216-218.
Baylis, C. 2009. Impact of pregnancy on underlying renal disease. Adv.Ren.Replace.Ther., 10(1):31-39.
Bowers, L.D. 1980. Kinetic serum creatinine assays1. The role of various factors in determining specificity. Clin. Chem., 26:551-554.
Chaney, A. L. 1962. Modified reagents for determination of urea and ammonia. Clin. Chem., 8:130-132.
De Flamingh, J.P. and van der Merwe, J.V. 1984. A serum biochemical profile of normal pregnancy. S. Afr. Med. J., 65 (14):552-555.
Egwuatu, V.E. 1983. Plasma urate, urea and creatinine levels during pregnancy and after the puerperium in normal primigravid Nigerians. Br. J. Obstet. Gynaecol., 90 (1): 21-25.
Forrester, T., Badaloo, A.V., Persaud, C.andJackson. A.A. 1994. Urea Production and salvage during pregnancy in normal Jamaican women. Am.J. Clin.Nutr.60:341-346. Heidemann, B.H. And McClure J.H.2003. British Journal of
Anaesthesia, CEPD Reviews., 3: 65-68.
Isra, H. and Hamdani, A.L. 2006. Measurement of serum uric acid urea and creatinine in pregnant women. Medical
Journal of Tikrit., 122(2): 31-35.
Kalhan, S.C. 2000. Protein metabolism in pregnancy. Am. J.
Clin. Nutr., 71:1249s-1255s.
King, J.C. 2000. Physiology of pregnancy and nutrient metabolism. Am. J. Clin. Nutr., 71:1218s-1225s.
Moniz, C.F., Nicolaides, K.H., Bamforth, F.J.andRodeck, C.K.1985. Normal reference ranges for biochemical substances relating to renal, hepatic and bone function in fetal and maternal plasma throughout pregnancy. J. Clin.
Pathol., 38:468-472.
Patricia, O.O., Christiana, B.A. and Raphael, O.J. 2013. Evaluation of changes in renal function of pregnant women attending ante-natal clinic in Vom Plateau State, North Central Nigeria. Archives of Applied Science Research, 5 (4) :111-116.
Smyth, A., Radovic, M.andGarovic, V.D.2013.Women, Kidney Disease, and Pregnancy. Advances in Chronic Kidney Disease., 20(5):402-410.
Steel, R.G.D. and Torrie, J.H. 1980. Principles and procedures of statistics: a biometrical approach. McGraw–Hill, New York.
Tran, H.A. 2005. Biochemical lab tests in pregnancy. Aust
Prescr., 28:98-101.