ISSN Online: 2164-5175 ISSN Print: 2164-5167
DOI: 10.4236/ajibm.2019.93045 Mar. 22, 2019 658 American Journal of Industrial and Business Management
Research on Enterprise Innovation Persistence
Patterns Recognition and Selection Based on
BP Neural Network
Yutong Ma, Yangyi Meng
School of Business Administration, South China University of Technology, Guangzhou, China
Abstract
This paper divided Chinese manufacturing listed enterprises into six innova-tion persistence patterns according to the innovainnova-tion persistence and owner-ship structure, and identified these six patterns by constructing BP neural network model. Under the condition of considering the scale of the enter-prise, we made a further analysis on which innovation persistence pattern should be adopted in different growth stages. The results show that small-scale enterprises mainly adopt the centralized continuous innovation pattern and the centralized interval innovation pattern. Medium-scale enter-prises mainly adopt the moderate interval innovation pattern. Large-scale en-terprises mainly adopt the loose interval innovation pattern. Through the scale classification, we analyzed the business performance of listed enterpris-es, and we found that the centralized continuous innovation pattern, the cen-tralized interval innovation pattern and the loose continuous innovation pat-tern are the most effective patpat-terns respectively for small-scale, medium-scale and large-scale enterprises in manufacturing industry. These show that with the expansion of the scale, the ownership structure will be more reasonable; enterprises will put more resources and funds into substantial innovation. With the strong strength of enterprises, the research will be more in-depth and innovative.
Keywords
Innovation Persistence, Ownership Structure, Pattern Recognition, BP Neural Network
1. Introduction
In the context of “Industrial 4.0” and cloud computing, big data, Internet of
How to cite this paper: Ma, Y.T. and Meng, Y.Y. (2019) Research on Enterprise Innovation Persistence Patterns Recogni-tion and SelecRecogni-tion Based on BP Neural Network. American Journal of Industrial and Business Management, 9, 658-679. https://doi.org/10.4236/ajibm.2019.93045
Received: March 4, 2019 Accepted: March 19, 2019 Published: March 22, 2019
Copyright © 2019 by author(s) and Scientific Research Publishing Inc. This work is licensed under the Creative Commons Attribution International License (CC BY 4.0).
http://creativecommons.org/licenses/by/4.0/
DOI: 10.4236/ajibm.2019.93045 659 American Journal of Industrial and Business Management things, mobile Internet, smart city and other technologies, R&D investment has been increasing. R&D activities have become the core competitiveness that de-termines whether enterprises can develop healthily and stably and surpass their competitors (Anandarajan et al., 2007). Any long-term innovation activity is in-separable from technological innovation [1][2][3] and institutional innovation. Technological innovation has become an important means for enterprises to build core competitiveness and long-term dynamic competitive advantage (Ganter & Hecker, 2013; Kang & Baek et al., 2017). Enterprise persistent tion is the process of continuously introducing and implementing new innova-tion projects and achieving innovative economic benefits for a long period of time. In China, some enterprises have invention patents [4][5] with high tech-nical content, but most of the patents are mainly new practical type patents, software copyrights, etc. The patent content has nothing to do with production and operation, and will not bring economic benefits in the future. Some enter-prises’ patent applications are caused by short-term economic interests or poli-cy-driven. In essence, they do not bring any long-term knowledge accumulation and technological progress in R&D investment. Therefore, the innovation per-sistence in this paper will be measured by the number of invention patent applications, and does not include the strategic behavior to cater to government policies or to obtain financial subsidies. The innovation persistence of this paper is to use the number of invention patent applications (Hall & Harhoff, 2012, Tong et al., 2014) to construct a new variable that can represent innovation per-sistence for a period of time.
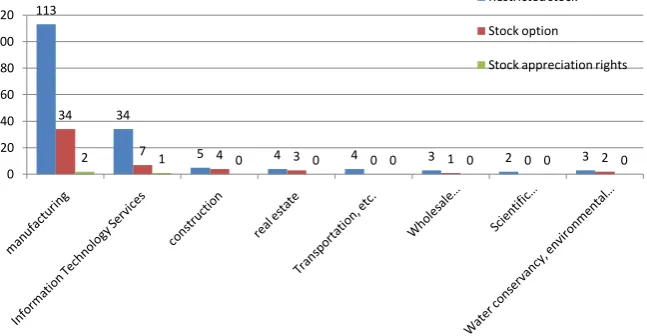
be-DOI: 10.4236/ajibm.2019.93045 660 American Journal of Industrial and Business Management havior of the enterprise is impaired, abnormal departure, etc., the outstanding stocks of the outstanding shares will be cancelled. Employees own part of the equity by purchasing part of the stock (or equity) and obtain corresponding management rights. The purpose of implementing the employee stock owner-ship plan is to make the employee become the shareholder. There are two main types. One is that the employees of the enterprise own part of the property rights of the enterprise by purchasing part of the shares of the enterprise and obtain the corresponding management rights. The other is that the employee purchases the entire equity of the enterprise and owns all the property rights of the enterprise, so that the employees have full management and voting rights to the enterprise. Management can obtain a portion of the corresponding real equity from the en-terprise in accordance with the incentive policy. Cash incentives include stock appreciation rights, virtual stock rights, virtual stock plans, and profit dividends. But in fact, as shown in Figure 1 (data source is CSMAR database). Restricted stocks, stock options, and stock appreciation rights all belong to equity incen-tives. As can be seen from the figure, the restricted stock value of manufacturing is about four times that of the second. Stock options are about five times higher than the second place, and stock appreciation rights are higher than all other industries. Therefore, it can be found that more enterprises in the manufacturing industry are willing to choose equity incentives. The reason is that according to the agency theory, when the agent’s behavior cannot be fully monitored, if the agent is encouraged by long-term equity, the benefits can be bound together with the interests of shareholders, enabling agents to make active investments in technology innovation based on long-term interests of the enterprise (Jensen & Meckling, 1976). Especially for business activities with high uncertainty such as R&D investment, the output and potential benefits often have a lag period of several years. Successful innovation behavior is not based on quick success but based on long-term efforts. Therefore, giving the necessary equity incentives to the strategic decision makers and key personnel in the R&D innovation activi-ties, tying their personal interests to the interests of the enterprise, can prompt them to select the optimal decision based on the long-term perspective and make the necessary commitment and action (Fu, 2012). More importantly, the incen-tive effect of long-term equity is not only reflected in the convergence of the ob-jective function of executives and shareholders, but also helps the internal man-agement members to maintain unity and cooperation in the R&D innovation process.
DOI: 10.4236/ajibm.2019.93045 661 American Journal of Industrial and Business Management
Figure 1. The main selection of incentive tools for various industries. Data Sources:
CCER database and CSMAR database.
of the enterprise, and the enterprise’s purpose is to maximize the shareholders’ interests. Only substantial innovation will bring shareholders a steady stream of benefits, so shareholders pursue corporate innovation and influence innovation behavior.
Jensen and Mecklingz [6] found that with the separation of corporate owner-ship and management, agency problems began to emerge. The management shareholding ratio is an indicator to measure the degree of separation between ownership and management. Demsetz, Jensen and Meckling [7] claimed the lower the shareholding ratio of management, the higher the separation of own-ership and management rights. Shareholders who have separated ownown-ership and management rights cannot directly participate in the enterprise’s business activi-ties, but indirectly affect the enterprise’s technological innovation through communication and incentives to managers. Francis and Smith [8] found that enterprises with higher shareholdings (>30%) had significantly higher R&D ac-tivities than enterprises with lower management shareholdings (<15%), who be-lieved that high equity concentration and shareholder regulation were effective It reduces the agency costs brought to enterprises by R&D activities. Lerner and Wulf [9] used US enterprises as a sample to find more long-term incentives (such as stock options or restricted stocks) that lead to more R&D output (such as higher patent citation rates), but short-term Incentives had nothing to do with the enterprise’s R&D output. However, the study sample is small and contains only 141 enterprises.
In summary, the current research on Innovation persistence has been exten-sive. However, the behavioral characteristics of an enterprise are often the result of a combination of factors. From the above, it can be seen that the degree of technological innovation of enterprises with different ownership structures [10] [11][12][13] is also different. There is currently only a small amount of litera-ture discussing the impact of ownership struclitera-ture on R&D intensity and R&D output. Therefore, this paper proposes a new method for dividing the innovation
113
34
5 4 4 3 2 3
34
7 4 3 0 1 0 2
2 1 0 0 0 0 0 0
0 20 40 60 80 100
120 Restricted stock
Stock option
DOI: 10.4236/ajibm.2019.93045 662 American Journal of Industrial and Business Management persistence pattern of manufacturing enterprises based on the ownership struc-ture of listed enterprises in China’s manufacturing industry. This paper uses BP neural network model, and discusses the recognition effect of BP neural network on these patterns and explains the significance of this pattern division.
Therefore, the paper is divided into four parts. The first part introduces the theoretical basis of this paper. The second part mainly introduces the definition of pattern recognition, the method of BP neural network. The third part mainly uses BP neural network to construct a recognition model for six innovation per-sistence patterns of China’s manufacturing enterprises, and verify the recogni-tion effect. The fourth part mainly studies the evolurecogni-tion of the enterprise pattern with the development of the enterprise scale through descriptive statistics, and further explores the difference in business performance of different innovation patterns under different enterprise scales. It can provide guidance for the inno-vation path of China’s manufacturing industry enterprises.
2. Research Methods and Model Design
2.1. Patterns Recognition Methods
Pattern recognition [14] method is a mathematical statistical method for processing information and classifying information by means of computer. The first step in applying the pattern recognition method is to create a pattern space. The pattern space refers to the multi-dimensional space formed by many indi-cators that affect the target when examining an objective phenomenon. Each in-dicator represents a pattern parameter. Suppose a phenomenon consists of sev-eral events (samples), each event has P characteristic parameters
(
x x1, , ,2 xp)
, which form a P-dimensional pattern space. The characteristic parameters of each event represent a pattern. Pattern recognition is to analyze the distribution cha-racteristics of various patterns in multidimensional space, divide the pattern space, and identify the clustering of various patterns to make judgments or deci-sions. The analysis method utilizes the “mapping” and “inverse mapping” tech-niques. Mapping refers to transforming a multidimensional mode space into a two-dimensional plane in which all patterns (sample points) of the multidimen-sional space are projected. In a two-dimenmultidimen-sional plane, different categories of patterns are distributed between different regions with distinct boundaries. This determines the direction of optimization back to the multidimensional space (primitive space), to obtain real information, to help people find out the rules or make decisions, to guide actual work or experimental research.DOI: 10.4236/ajibm.2019.93045 663 American Journal of Industrial and Business Management according to the probability, the target is judged as the risk value corresponding to each category, and the risk value is selected as the target category. Structural pattern recognition identifies a description of the structural features of the object to be identified. It treats an identified object as a language structure. Fuzzy pat-tern recognition is based on the thinking logic of human identification of things, drawing on the recognition characteristics of human brain, turning the binary logic commonly used in computers to continuous logic, and using fuzzy infor-mation to classify patterns. Bring a computer or machine with intelligence that is close to humans. Neural network pattern recognition is to correctly map the pattern from the feature space to the class space, or to implement the class divi-sion in the feature space. The difficulty of pattern recognition is closely related to the distribution in the pattern and feature space, if any two classes in the feature space can be distinguished by a hyperplane. Then the pattern is linear and se-parable, and the recognition at this time is easier.
After years of research and development, pattern recognition technology has been widely used in many important fields such as artificial intelligence, com-puter engineering, machine science, neurobiology, medicine, detective science and high energy physics, archaeology, geological exploration, aerospace science and weapon technology. Such as speech recognition, speech translation, face recognition, fingerprint recognition, recognition of handwritten characters, in-dustrial fault detection, precision guidance, etc. The rapid development and ap-plication of pattern recognition technology has greatly promoted the national economic construction and the modernization of national defense technology. Because neural network pattern recognition can deal with some environmental information is very complicated, the background knowledge is not clear, and the inference rules are not clear. Therefore, this paper selects the neural network recognition model with better overall performance as the pattern recognition method.
2.2. BP Neural Network Model Design
This paper uses BP neural network model. In the 1940s, McCulloch and Pitts
DOI: 10.4236/ajibm.2019.93045 664 American Journal of Industrial and Business Management At present, most of the research on the direction of innovation persistence adopts linear regression or probit nonlinear regression model. Their advantage lies in the obvious revealing of the relationship between independent variables and dependent variables, but the disadvantage is that this model cannot be used to achieve more complex operations, such as pattern recognition, in fact the re-lationship between independent variables and dependent variables is often a complex nonlinear model which is difficult to visually express. The BP neural network is a black box process and has a non-linear mapping capability without the need to determine the mapping relationship in advance. Internally, it trains data, learns the rules, and finally obtains the predicted output with the smallest mean square error of the actual output value. It has the advantages of relatively short model fitting time, self-learning, self-adaptation, and fault tolerance. After decades of development, BP neural network has become one of the models with wide application and significant classification effect. Therefore, BP neural net-work is used to identify and analyze patterns in our research.
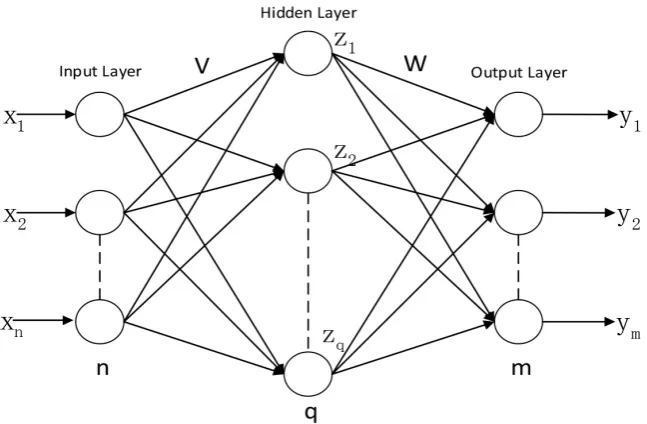
The Back Propagation (BP) network model is a multi-layer feed forward neural network trained according to the error back propagation algorithm. The topology is mainly divided into input layer, hide layer and output layer as shown in Figure 2. BP neural network is divided into two processes: 1) working signal forward transfer sub-process; 2) error signal reverse transfer sub-process. In a BP neural network, a sample has n inputs, m outputs, and there are usually sev-eral hidden layers between the input layer and the output layer.
DOI: 10.4236/ajibm.2019.93045 665 American Journal of Industrial and Business Management
Figure 2. Three-layer neural network topology.
assumptions about the distribution state of the objects to be processed in the sample space, but learns the relationship between the samples directly from the data, so they can also solve the identification problems that cannot be solved be-cause the sample distribution is unknown. 2) The neural network has the ability to promote. It can correctly process data similar to the original training samples based on the similarity between samples. 3) The network is non-linear, it can find complex interactions between system input variables. In a linear system, changing the input tends to produce a proportional output. But in a nonlinear system. This influence relationship is a high-order function. This feature is well suited for real-time systems because real-time systems are often non-linear. Neural networks provide a practical solution to this complex system. 4) Neural networks are highly parallel, that is, a large number of similar or independent operations can be performed simultaneously. This parallelism makes it thou-sands of times faster than traditional microprocessors and digital signal proces-sors when dealing with problems, which increases the processing speed of the system and provides the necessary conditions for real-time processing.
Based on the above advantages, neural network pattern recognition has de-veloped into an important method in the field of pattern recognition. It plays an irreplaceable role in traditional pattern recognition methods.
DOI: 10.4236/ajibm.2019.93045 666 American Journal of Industrial and Business Management
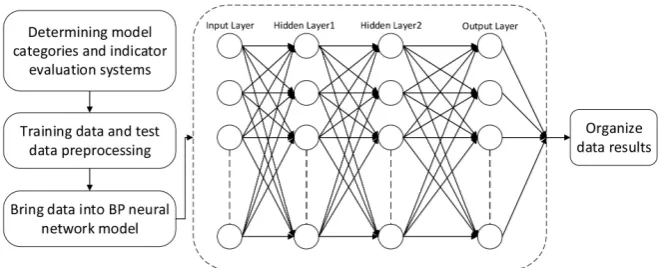
Figure 3. BP neural network model design.
patterns after training. Next, randomly set different network structures and weight threshold repetition training to obtain different models. When the model performed well (the error is less than the given value), the training is stopped. We recorded the weight threshold and topology at this time, and completed the construction of the innovative persistence patterns recognition model.
2.3. Enterprise Innovation Persistence Pattern
In order to judge the specific pattern of manufacturing listed enterprises, this paper is based on the ownership structure and Innovation persistence of enter-prises. The ownership structure mentioned in this article refers to the proportion of shares of different nature in the total share capital of the joint stock enterprise and their mutual relationship. Equity is a right that can be claimed against an enterprise based on its status (identity).
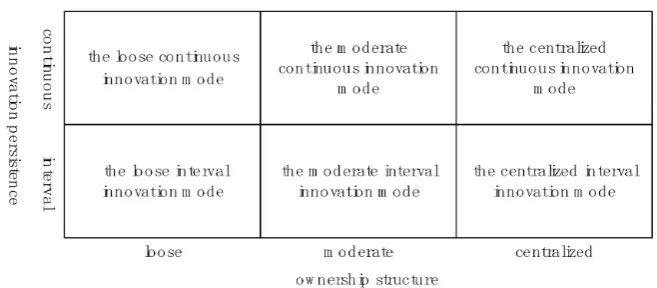
The ownership structure mentioned in this article refers to a kind of innova-tion behavior. In the past three years, if there are at least two inveninnova-tion patents per year for two or more years, then we call this situation a continuous innova-tion. In the past three years, if there are at least two invention patents per year for two or more years, then we call this situation continuous innovation. In the past three years, if there is only one year, the enterprise has patented inventions, or has not produced invention patents for three years, then we call this situation interval innovation. The innovation persistence is taken as the ordinate and the ownership structure is taken as the abscissa. In the light of the relevant literature, the ordinate is divided into two categories, continuous innovation and interval innovation, and the abscissa is divided into three categories, centralized equity, moderate equity and loose equity. Combine these two dimensions, and finally get six different innovative persistence patterns with different distinct characte-ristics are obtained, as shown in Figure 4. We call these six patterns the centra-lized continuous innovation pattern, the centracentra-lized interval innovation pattern, the moderate continuous innovation pattern, the moderate interval innovation pattern, the loose continuous innovation pattern, the loose interval innovation pattern.
DOI: 10.4236/ajibm.2019.93045 667 American Journal of Industrial and Business Management
Figure 4. Innovation persistence patterns of China’s listed manufacturing enterprises.
mature, the ownership structure is relatively scattered, and there are sustained substantial innovation outputs within three years. Enterprises with such charac-teristics generally have a large scale. The characcharac-teristics of the enterprises represented by the loose interval innovation pattern are that the ownership structure is more dispersed and the substantial innovation is intermittent. The characteristics of the enterprises represented by the moderate continuous inno-vation pattern are that the ownership structure is relatively dispersed and capa-ble of continuous innovation. The characteristics of the enterprises represented by the moderate interval innovation pattern are that the ownership structure is relatively dispersed, and innovation is intermittent. The characteristics of the enterprises represented by the centralized continuous innovation pattern are that the ownership structure is concentrated, mostly family businesses or equity is concentrated in the hands of management, and has continuous innovation capabilities. The characteristics of the enterprises represented by the centralized interval innovation pattern are that the ownership structure is concentrated, but they cannot have continuous innovation outputs due to limited investment ca-pacity.
The distribution of these six patterns of enterprises in the sample data is not uniform. According to the sample size, the enterprises belong to the moderate continuous innovation pattern and the loose continuous innovation pattern are relatively less.
3. Innovation Persistence Pattern Recognition
In this paper, we used BP neural network to identify the six manufacturing en-terprise innovation persistence patterns. The neural network model is con-structed by designing model feature items, network topology and parameters. Through continuous training and comparison, the optimal BP neural network recognition model was selected. After then, we also tested and verified the effect of the model.
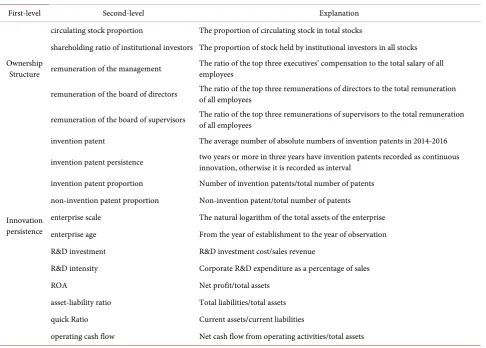
DOI: 10.4236/ajibm.2019.93045 668 American Journal of Industrial and Business Management role in the model results. The stronger the relationship between the data feature of the input layer and the dependent variable, the better the recognition effect of the model. To this end, we designed the following enterprise pattern recognition index system to finish feature selection [35][36][37][38], as shown in Table 1.
First of all, the innovation persistence of manufacturing enterprises is mainly divided into two first-level indicators, ownership structure and innovation per-sistence. Among them, the ownership structure is mainly divided into five second-level indicators. Circulating stock proportion, the shareholding ratio of institutional investors, remuneration of the management, remuneration of the board of directors, and remuneration of the board of supervisors. Innovation persistence is mainly divided into twelve second-level indicators. Invention pa-tent, invention patent persistence, invention patent proportion, non-invention patent proportion, enterprise size, enterprise age, R&D investment, R&D inten-sity, ROA, asset-liability ratio, quick Ratio, operating cash flow.
This evaluation system comprehensively describes the enterprise’s situation from the aspects of the structure, internal and external factors of the enterprise. Thus makes a comprehensive and accurate assessment of the enterprises’ inno-vation persistence.
3.2. Data Collection and Data Preprocessing
After comparing the enterprises’ innovation data published by different web-sites, we selected CCER database and CSMAR database with reliable data sources. We manually collected the initial data of the corresponding indicators. The research object of this paper is the enterprises that can collect data among the listed enterprises in the A-share manufacturing industry in Shanghai and Shenzhen in 2016. The sample screening process is as follows: First, delete the listed enterprises of ST and PT and the enterprises that conducted IPOs that year. Second, delete the total assets and the owners whose equity is negative or zero in the remaining enterprises. Third, delete the main research variable data missing or abnormal value samples in the remaining enterprises. We final used 1805 enterprises’ data samples from 2007 to 2016 as the original data. In order to ensure the quality of the data, data preprocessing is required before the data is brought into the model. First, we dealt with the vacancy value. There were only a few vacancy records. In order to avoid the impact of the vacancy value, the va-cancy value was set to the enterprise average value. Secondly, the original data was converted to data items in the index system according to the calculation formula. The data collected in this paper are quantitative indicators, so the cal-culation formula can be directly used to generate the required feature items of the model. At the same time, because each feature has different dimensions, log function conversion is performed on some feature items with large dimensions. The min-max standardization process is performed on all feature items. The conversion function is
(
min) (
max min)
ij ij j ij j ij j ij
DOI: 10.4236/ajibm.2019.93045 669 American Journal of Industrial and Business Management
Table 1. Evaluation index system for innovation persistence pattern.
First-level Second-level Explanation
circulating stock proportion The proportion of circulating stock in total stocks
shareholding ratio of institutional investors The proportion of stock held by institutional investors in all stocks Ownership
Structure remuneration of the management The ratio of the top three executives’ compensation to the total salary of all employees
remuneration of the board of directors The ratio of the top three remunerations of directors to the total remuneration of all employees
remuneration of the board of supervisors The ratio of the top three remunerations of supervisors to the total remuneration of all employees
invention patent The average number of absolute numbers of invention patents in 2014-2016
invention patent persistence two years or more in three years have invention patents recorded as continuous innovation, otherwise it is recorded as interval
invention patent proportion Number of invention patents/total number of patents non-invention patent proportion Non-invention patent/total number of patents
Innovation persistence
enterprise scale The natural logarithm of the total assets of the enterprise enterprise age From the year of establishment to the year of observation R&D investment R&D investment cost/sales revenue
R&D intensity Corporate R&D expenditure as a percentage of sales
ROA Net profit/total assets
asset-liability ratio Total liabilities/total assets
quick Ratio Current assets/current liabilities
operating cash flow Net cash flow from operating activities/total assets
ij
x is the feature item j of enterprise I, xij′ is the score after xij is standar-dized.
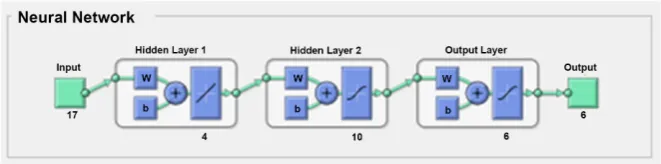
3.3. Topology of BP Neural Network
DOI: 10.4236/ajibm.2019.93045 670 American Journal of Industrial and Business Management
Figure 5. BP neural network topology.
layer is 6. Noted that the prediction results of one enterprise in BP neural net-work are the possibilities of each pattern, which are six decimal values between 0 - 1. So we selected the largest of the six decimal values and set it to 1, and the other values we set them to 0, which means we chose the most likely pattern as the final forecast pattern for this enterprise.
3.4. Training and Testing of BP Neural Network
We collected a total of 1805 enterprises’ data. We randomly divided data into training set and test set according to the ratio of 4:1, in the meanwhile ensuring that the training set was the same as the proportion of each pattern in the test set. Therefore, this paper used 1444 data as training data and 361 data as test da-ta. Using the BP neural network structure constructed above, different combina-tions of network parameters were tried on this basis. After comparing the expe-rimental results, the transfer function of each layer was finally set to purelin, tansig, tansig, purelin, the training function was set to trainlm, the learning function was set to traingda, the learning rate was set to 0.05. This combination was a relatively small combination of parameters with a root mean square error. Using the above topology and parameters, the training data was brought into the model for learning. It is important to note that the weights and thresholds of the BP neural network in Matlab were randomly initialized, so the results of each training model were different. We used the same network structure to learn multiple times, and selected the best performing BP neural network training model (the model result with the smallest global convergence error), and used this model as the final BP neural network model.
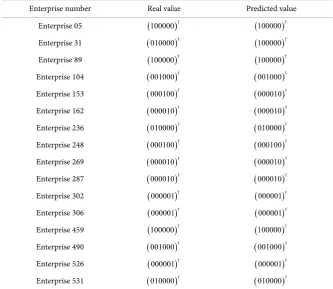
After constructing the model, we performed data preprocessing on the test data, and used the trained BP neural network model to verify the simulation. The real value of each enterprise in the test set presents the real pattern, and the predicted value of each enterprise in the test set presents the predicted pattern obtained by using the trained BP neural network model. As shown in Table 2, the predicted value of each enterprise is represented by vectors.
(
100000)
T presents the loose continuous innovation pattern,(
010000)
T presents the loose interval innovation pattern,(
001000)
T presents centralized continuous inno-vation pattern,(
000100)
T presents the moderate interval innovation pattern,(
)
T000010 presents the moderate continuous innovation pattern, and
(
)
TDOI: 10.4236/ajibm.2019.93045 671 American Journal of Industrial and Business Management
Table 2. Example of the expected output and actual output value of the neural network
model.
Enterprise number Real value Predicted value
Enterprise 05 ( )T
100000 ( )T
100000
Enterprise 31 ( )T
010000 ( )T
100000
Enterprise 89 ( )T
100000 ( )T
100000
Enterprise 104 ( )T
001000 ( )T
001000
Enterprise 153 ( )T
000100 ( )T
000010
Enterprise 162 ( )T
000010 ( )T
000010
Enterprise 236 ( )T
010000 ( )T
010000
Enterprise 248 ( )T
000100 ( )T
000100
Enterprise 269 ( )T
000010 ( )T
000010
Enterprise 287 ( )T
000010 ( )T
000010
Enterprise 302 ( )T
000001 ( )T
000001
Enterprise 306 ( )T
000001 ( )T
000001
Enterprise 459 ( )T
100000 ( )T
100000
Enterprise 490 ( )T
001000 ( )T
001000
Enterprise 526 ( )T
000001 ( )T
000001
Enterprise 531 ( )T
010000 ( )T
010000
4. Innovation Persistence Pattern Selection
After ensuring the BP neural network can effectively identify the patterns, this paper attempted to further analyze the changing trend of the pattern in the process of enterprise growth according to the characteristics of the enterprise pattern in different stages of development. The results can help manufacturing enterprises to better position themselves and provide advice on the optimal al-location of resources.
4.1. The Evolution of Innovation Persistence Pattern
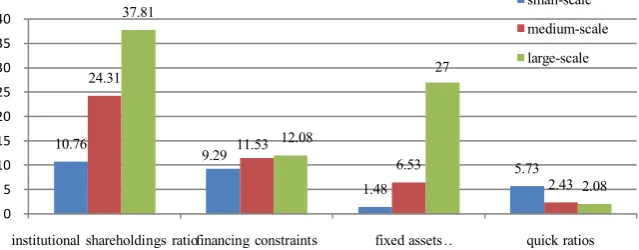
The development of manufacturing enterprises has obvious stages. Small-scale enterprises are in the growth stage, medium-scale enterprises are in the devel-opment stage, and large-scale enterprises are in the mature stage. This paper first classified the enterprises in the sample according to the scale of the enterprise and divided them into small-scale enterprises, medium-scale enterprises and large-scale enterprises. In order to verify the rationality of the classification, we did descriptive statistical analysis of the data for small-scale, medium-scale and large-scale enterprises which is shown in Figure 6.
DOI: 10.4236/ajibm.2019.93045 672 American Journal of Industrial and Business Management
Figure 6. Comparison of characteristics of manufacturing enterprises of different scales.
Data Sources: CCER database and CSMAR database.
is 10.76%, that of medium-scale enterprises is 24.31%, and that of large-scale en-terprises is 37.81%. As the size of the enterprise increases, the proportion of in-stitutional holdings gradually increases. It can be seen that the three types of en-terprise data form a clear gradient, indicating that when the enen-terprise grows from small-scale to large-scale, there are more institutional investors to invest, and the equity will be further dispersed. The average financing constraint for small-scale enterprises is 9.29, the average for medium-scale enterprises is 11.53, and the average for large-scale enterprises is 12.08. It can be seen that when the enterprise grows from small-scale to large-scale, the financing constraints also grow from small to large. This is in line with the current reality, because as manufacturing enterprise continues to expand, it will continue to increase funding for research and development and operations. But innovation output is not a one-off event. Therefore, in the process of expanding the scale of the enter-prise, on the one hand, the capital market itself has insufficient attention to the manufacturing industry, and on the other hand, the amount of R&D investment is enormous, which leads to the increasing financing constraints of enterprise. The average fixed assets of small-scale enterprises is 148 million yuan, the average for medium-scale enterprises is 653 million yuan, and the average for large-scale enterprises is 2.7 billion yuan. The characteristics of the industry determine that manufacturing enterprise needs a large amount of fixed assets, so it can be clearly seen that with the expansion of the scale of enterprise, fixed assets show a clear growth trend. The average quick ratio of small-scale enterprises is 5.73%, me-dium-scale companies average 2.43%, and large-scale enterprises are 2.08%. It can be seen that all types of enterprises have certain solvency, although the short-term solvency of small-scale enterprises will be significantly higher than that of large-scale enterprises, it also shows that the utilization rate of small-scale enter-prises is low. Overall, such classification is reasonable.
After the scale division, we explored the trends in the pattern of manufactur-ing enterprises from small-scale to large-scale. This will help enterprises to achieve better transformation and upgrading. Based on the enterprises’ owner-ship structure and innovation persistence characteristics, the scatter plot is shown in Figure 7. The scatter plots generally show a V-shaped distribution.
10.76
9.29
1.48 5.73
24.31
11.53
6.53
2.43 37.81
12.08
27
2.08
0 5 10 15 20 25 30 35 40
institutional shareholdings ratiofinancing constraints fixed assets… quick ratios
DOI: 10.4236/ajibm.2019.93045 673 American Journal of Industrial and Business Management
Figure 7. Evolution trend of enterprise pattern. Data Sources: CCER database and
CSMAR database.
Small-scale enterprises are mainly the centralized interval innovation pattern and the centralized continuous innovation pattern. Medium-scale enterprises are mainly the moderate interval innovation pattern. Large-scale enterprises are mainly the loose interval innovation pattern, and innovative behavior tries to gradually develop from interval to continuous.
DOI: 10.4236/ajibm.2019.93045 674 American Journal of Industrial and Business Management
4.2. Performance of Innovation Persistence Pattern in Different
Enterprise Scales
Although the above analysis illustrates the trend of enterprise pattern selection at different times, these patterns do not represent the most efficient pattern for the corresponding enterprise scale. In order to analyze which pattern has the highest efficiency, this paper used the performance level to analyze. We chose scholarly-accepted EBIT to represent the performance level of the enterprise.
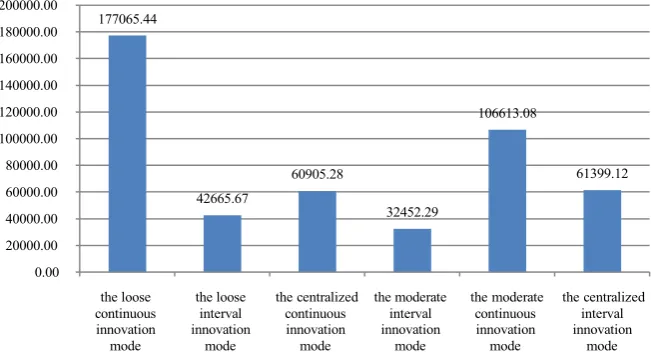
In Figures 8-10, the average business performance of enterprises in each pat-tern under different enterprise scales is calculated and plotted. We can see the rankings of the business performance of small-scale enterprises from high to low are the centralized continuous innovation pattern, the centralized interval inno-vation pattern, the loose interval innoinno-vation pattern and the moderate interval innovation pattern. The rankings of the business performance of medium-scale enterprises from high to low are the centralized interval innovation pattern, the loose interval innovation pattern, the moderate interval innovation pattern, the moderate continuous innovation mode and the centralized continuous innova-tion pattern. The rankings of the business performance of large-scale enterprises from high to low are the loose continuous innovation pattern, the moderate continuous innovation pattern, the centralized interval innovation pattern, the centralized continuous innovation pattern, the loose interval innovation pattern and the moderate interval innovation pattern. In summary, the centralized con-tinuous innovation pattern, the centralized interval innovation pattern, the loose continuous innovation pattern are the best business performances respectively for small-scale, medium-scale and large-scale enterprises.
5. Conclusions
Using of BP neural network model, we discussed the identification and selection of innovation persistence patterns of listed enterprises in China’s manufacturing industry, and obtained the following important conclusions.
Firstly, the evaluation index system is used as the input vector, and the enter-prise innovation persistence pattern is used as the output vector. The trained BP neural network model can correctly and reasonably identify the enterprises’ in-novation persistence patterns.
DOI: 10.4236/ajibm.2019.93045 675 American Journal of Industrial and Business Management
Figure 8. Business performance of different patterns of small-scale enterprises. Data
[image:18.595.211.538.279.429.2]Sources: CCER database and CSMAR database.
Figure 9. Business performance of different patterns of medium-scale enterprises. Data
Sources: CCER database and CSMAR database.
Figure 10. Business performance of different patterns of large-scale enterprises. Data
Sources: CCER database and CSMAR database.
innovations, more energy and time will be invested, and R&D activities will last longer. 6321.58 8435.00 5049.37 8428.53 0.00 1000.00 2000.00 3000.00 4000.00 5000.00 6000.00 7000.00 8000.00 9000.00
the loose interval
innovation mode the moderate interval innovation mode the centralized interval innovation mode
20773.98
15656.57 16770.74 15892.45
24762.16 0.00 5000.00 10000.00 15000.00 20000.00 25000.00 30000.00
the loose interval
innovation mode the centralized continuous
[image:18.595.211.537.474.654.2]DOI: 10.4236/ajibm.2019.93045 676 American Journal of Industrial and Business Management Finally, the analysis of the business performance of each pattern under differ-ent scales shows that the most efficidiffer-ent patterns at differdiffer-ent scales are differdiffer-ent. When conditions permit, small-scale, medium-scale and large-scale enterprises respectively choose the centralized continuous innovation pattern, the centra-lized interval innovation pattern, and the loose continuous innovation pattern, which are the most efficient innovation persistence patterns. The most efficient pattern for small-scale enterprises is also the pattern they use primarily, but me-dium-scale and large-scale enterprises are not the same. The main reason is that most medium-scale enterprises are in a transitional stage, the ownership struc-ture is not completely separated, and more research time is needed from the ap-plication-based innovation to the basic innovation. Moreover, it is not innova-tive every year. That is why the centralized interval innovation pattern has the best benefits, but most of medium-scale enterprises are the moderate interval innovation pattern. After enterprises’ scale reach large-scale enterprises, their strategic goals have shifted. They hope to become the continuous leader of the industry through major breakthroughs in transformation; it may take many years to produce innovative output. But large enterprises have more capacity and capital, so innovation output has increased to some extent. That is why most of the large-scale enterprises are the loose interval innovation pattern, but still have difficulty reaching the loose continuous innovation pattern.
Of course, this paper has the following shortcomings: Firstly, this paper takes the manufacturing enterprise as the representative to study the innovation per-sistence model of the enterprises. In the future, we can try to analyze and identi-fy the innovation persistence model of other industries. Secondly, this paper on-ly shows the recognition results of the BP neural network model. In the future, the effects of various models can be compared to further improve the results. Finally, in management practice, the specific content of the innovation persis-tence model of different enterprises should also be based on the characteristics of the company’s managers, the policies and trends introduced by the state, the ex-ternal macro environment and other factors. So in the future we will study how to build a more operational model.
Conflicts of Interest
The authors declare no conflicts of interest regarding the publication of this pa-per.
References
[1] Malerba, F., Orsenigo, L. and Peretto, P. (1997) Persistence of Innovative Activities, Sectoral Patterns of Innovation and International Technological Specialization. In-ternational Journal of Industrial Organization, 15, 801-826.
https://doi.org/10.1016/S0167-7187(97)00012-X
DOI: 10.4236/ajibm.2019.93045 677 American Journal of Industrial and Business Management [3] Huang, L.C., Luo, Y.F., Zhang, H.C. and Li, X.Y. (2006) Technology Innovation
Ability Analysis of Beijing’s Manufacturing Industry. IEEE International Confe-rence on Management of Innovation & Technology, Singapore, 21-23 June 2006, 1, 195-201.
[4] Abraham, B.P. and Moitra, S.D. (2001) Innovation Assessment through Patent Analysis. Technovation, 21, 245-252.
https://doi.org/10.1016/S0166-4972(00)00040-7
[5] Abbas, A., Zhang, L. and Khan, S.U. (2014) A Literature Review on the State-of-the-Art in Patent Analysis. World Patent Information, 37, 3-13.
https://doi.org/10.1016/j.wpi.2013.12.006
[6] Jensen, M.C. and Meckling, W.H. (1976) Theory of the Firm: Managerial Behavior, Agency Costs and Ownership Structure. Journal of Financial Economics, 3, 305-360. https://doi.org/10.1016/0304-405X(76)90026-X
[7] Demsetz, H. (1983) The Structure of Ownership and the Theory of the Firm. Jour-nal of Law & Economics, 26, 375-390. https://doi.org/10.1086/467041
[8] Francis, J. and Smith, A. (1995) Agency Costs and Innovation Some Empirical Evi-dence. Journal of Accounting and Economics, 19, 383-409.
https://doi.org/10.1016/0165-4101(94)00389-M
[9] Lerner, J. and Wulf, J. (2007) Innovation and Incentives: Evidence from Corporate R&D. Review of Economics & Statistics, 89, 634-644.
https://doi.org/10.1162/rest.89.4.634
[10] Ang, J.S., Cole, R.A. and Lin, J.W. (2000) Agency Costs and Ownership Structure. The Journal of Finance, 55, 81-106. https://doi.org/10.1111/0022-1082.00201 [11] Fama, E.F. and Jensen, M.C. (1983) Separation of Ownership and Control. The
Journal of Law and Economics, 26, 301-325.
[12] Colombo, M.G., Croce, A. and Murtinu, S. (2014) Ownership Structure, Horizontal Agency Costs and the Performance of High-Tech Entrepreneurial Firms. Small Business Economics, 42, 265-282. https://doi.org/10.1007/s11187-013-9483-y [13] Gogineni, S., Linn, S.C. and Yadav, P.K. (2010) Empirical Evidence on Ownership
Structure, Management Control and Agency Costs. Working Paper. University of Oklahoma.
[14] Raudys, S.J. and Jain, A.K. (1991) Small Sample Size Effects in Statistical Pattern Recognition: Recommendations for Practitioners and Open Problems. IEEE Trans-actions on Pattern Analysis and Machine Intelligence, 13, 252-264.
https://doi.org/10.1109/34.75512
[15] Jain, A.K., Duin, R.P.W. and Mao, J. (2000) Statistical Pattern Recognition: A Re-view. IEEE Transactions on Pattern Analysis and Machine Intelligence, 22, 4-37. https://doi.org/10.1109/34.824819
[16] Jelinek, F. (1997) Statistical Methods for Speech Recognition. Statistical Methods for Speech Recognition. MIT Press, New York.
[17] Fu, K.S. (1977) Syntactic Pattern Recognition, Applications. Springer-Verlag, Ber-lin, 14. https://doi.org/10.1007/978-3-642-66438-0
[18] Rengaswamy, R. and Venkatasubramanian, V. (1995) A Syntactic Pattern-Recognition Approach for Process Monitoring and Fault Diagnosis. Engineering Applications of Artificial Intelligence, 8, 35-51. https://doi.org/10.1016/0952-1976(94)00058-U [19] Vidal, E. and Garcia, P. (2002) Inference of K-Testable Languages in the Strict Sense
DOI: 10.4236/ajibm.2019.93045 678 American Journal of Industrial and Business Management [20] Pedrycz, W. (1990) Fuzzy Sets in Pattern Recognition: Methodology and Methods.
Pattern Recognition, 23, 121-146. https://doi.org/10.1016/0031-3203(90)90054-O [21] Taha, M.M.R. and Lucero, J. (2005) Damage Identification for Structural Health
Monitoring Using Fuzzy Pattern Recognition. Engineering Structures, 27, 1774-1783. https://doi.org/10.1016/j.engstruct.2005.04.018
[22] Fulkerson, B. (1995) Machine Learning, Neural and Statistical Classification. Tech-nometrics, 37, 459. https://doi.org/10.1080/00401706.1995.10484383
[23] Neal, R.M. (1996) Bayesian Learning for Neural Networks. Springer, Berlin. [24] Abirami, S. and Neelamegam, P.H.K. (2014) Analysis of Rice Granules Using Image
Processing and Neural Network Pattern Recognition Tool. International Journal of Computer Applications, 96, 20-24. https://doi.org/10.5120/16806-6530
[25] Pal, S.K., Ray, S.S. and Ganivada, A. (2017) Granular Neural Networks, Pattern Recognition and Bioinformatics. In: Studies in Computational Intelligence, Vol. 712, Springer, Berlin.
[26] Fu, J., Li, G., Qin, Y. and Freeman, W.J. (2007) A Pattern Recognition Method for Electronic Noses Based on an Olfactory Neural Network. Sensors and Actuators B: Chemical, 125, 489-497. https://doi.org/10.1016/j.snb.2007.02.058
[27] Mirfakhraei, K. and Horch, K. (1994) Classification of Action Potentials in Mul-ti-Unit Intrafascicular Recordings Using Neural Network Pattern-Recognition Techniques. IEEE Transactions on Biomedical Engineering, 41, 89-91.
https://doi.org/10.1109/10.277276
[28] Mcculloch, W.S. and Pitts, W. (1990) A Logical Calculus of the Ideas Immanent in Nervous Activity. Bulletin of Mathematical Biology, 52, 99-115.
https://doi.org/10.1007/BF02459570
[29] Rosenblatt, F. (1958) The Perceptron: A Probabilistic Model for Information Sto-rage and Organization in the Brain. Psychological Review, 65, 386-408.
https://doi.org/10.1037/h0042519
[30] Hopfield, J.J. (1982) Neural Networks and Physical Systems with Emergent Collec-tive Computational Abilities. Proceedings of the National Academy of Sciences of the United States of America, 79, 2554-2558.
https://doi.org/10.1073/pnas.79.8.2554
[31] Rumelhart, D.E., Hinton, G.E. and Williams, R.J. (1986) Learning Representations by Back-Propagating Errors. In: Anderson, J.A. and Rosenfeld, E., Eds., Neuro-computing: Foundations of Research, MIT Press, Cambridge, 533-536.
https://doi.org/10.1038/323533a0
[32] Ackley, D.H., Hinton G.E. and Sejnowski, T.J. (1985): A Learning Algorithm for Boltzmann Machines. Cognitive Science, 9, 147-169.
https://doi.org/10.1207/s15516709cog0901_7
[33] Werbos, P.J. (1994) The Roots of Backpropagation: From Ordered Derivatives to Neural Networks and Political Forecasting.Wiley, New York.
[34] Rumelhart, D.E., Hinton, G.E. and Williams, R.J. (1988) Learning Internal Repre-sentations by Error-Propagation. Readings in Cognitive Science, 323, 399-421. [35] Jain, A. and Zongker, D. (1997) Feature Selection: Evaluation, Application, and
Small Sample Performance. IEEE Transactions on Pattern Analysis and Machine Intelligence, 19, 153-158. https://doi.org/10.1016/S1088-467X(97)00008-5
DOI: 10.4236/ajibm.2019.93045 679 American Journal of Industrial and Business Management [37] Li, J., Cheng, K. and Wang, S., et al. (2016) Feature Selection: A Data Perspective.
ACM Computing Surveys, 50, Article No. 94.