Effective Classification Techniques for Melanoma
Classification on Dermoscopy Images
Ms. Ashtami K M1, Ms. Reshma V K2
1
M.Tech Student, CSE, JCET, Lakkidi, Ottapalam
2
Assistant Professor, Dept. of CSE. JCET, Lakkidi, Ottapalam
Abstract: Dermoscopy technique is one of the major imaging modalities used in the diagnosis of the pigmented skin lesions. Computerized image analysis techniques have become important tools in this research area due to the difficulty and subjectivity of human interpretation. The proposed system includes three steps: firstly, preprocess the input image secondly, segmentation and then classification. Classifying the melanocytic tumors as benign or malignant by the analysis of dermoscopy images using Artificial Neural Network (ANN) and Support Vector Machine (SVM) classifier.
Keywords: Dermoscopy; ANN; SVM
I. INTRODUCTION
Dermoscopy[1][7][8] also known as epiluminescence microscopy, this is a non-invasive skin imaging technique that makes the subsurface structures more easily visible when compared with the conventional clinical images. Close examination of the pigmented skin lesions in this way increases the effectiveness of the clinical diagnostic tools by providing the new morphological criteria for distinguishing melanoma from other melanocytic and non-melanocytic pigmented skin lesions.
Cancer begins with uncontrolled division of one cell, which results in a visible mass named tumor. Tumor can be of two forms benign or malignant. Malignant Melanoma (MM) tumor grows speedily and invades its surrounding tissues causing their damage. By providing the better treatment, the earlier the cancers are detected. The, early detection requires an accurate diagnosis which should be able to distinguish benign and malignant tumors.
A better detection approach is producing both low false positive rate and false negative rate. Conventional methods of diagnosing the diseases rely on detecting the presence of signal features by a human observer. Due to large number of patients in intensive care units, several Computer Aided Diagnosis (CAD) approaches for automated diagnostic systems have been developed to solve this problem. A number of CAD approaches have been proposed to improving the accuracy of diagnosis and evaluate the prognostic risk [51].
II. ARTIFACTSREMOVINGANDDETECTIONOFBOUNDARY
The purpose of artifacts removal stage is that the hair removal. Due to the presence of hairs dermoscopy image analysis is greatly difficult. Hairs are detected for these pictures and then removed using the median filter based technique presented in [49]. The accuracy of subsequent feature extraction and classification depends on the accuracy of the segmentation process. Although projected a number of automatic segmentation ways for dermoscopy images. In the earlier work [21], to segment the dermoscopy pictures, an automatic technique based on k-means model was developed, and it was able to acquire a lot of correct results under complicated conditions than Otsu’s threshold [22] and Statistical Region Merging (SRM) [23].
Fig. 1. Segmentation instances on dermoscopy image
III. EXTRACTIONOFIMPORTANTFEATURES
[image:2.612.204.402.153.337.2]The color, texture, and shape [15][24][25] are the most common features mentioned within the literature on lesion classification and border features are less well-described [14][26]. Since we handling pictures of incomplete lesion objects, shape features are abandoned in this model. Within the following, describe a collection of widely used color and texture features yet as a collection of lesion border features [1] that are effective on incomplete lesions. These features are utilized in this classification methodology.
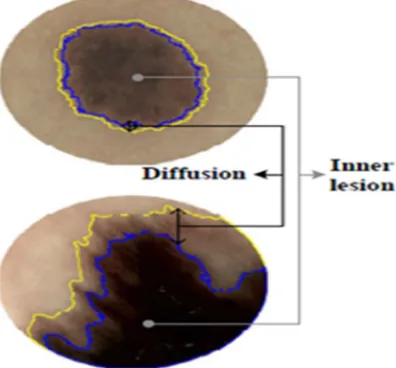
Fig. 2. Generating two lesion regions.
Before feature extraction we need to perform region division [21]. Therefore, the lesion object instead divides into a diffusion region and an inner lesion region and features are extracted on both individual regions, as well as over the entire lesion region. As delineated in Section II, every lesion object is separated from the background skin by employing the k-means technique. Then, this technique also employed to automatically segment the lesion into these two region types. Fig. 2. is an example showing generation of these two regions.
The color and texture features utilized in this model are the same as those delineate by Celebi et al. in [15]. Here, briefly summarize these features.
1) Color features: Total 30 color features are extracted.
2) Texture features: In this paper, several statistical texture descriptors are calculated from the Gray-Level Co-occurrence Matrix (GLCM) [27] based texture descriptor: the regional energy, entropy, contrast, inverse difference moment, and correlation [1]. Then we propose some additional statistical texture descriptors from GLCM: the autocorrelation, cluster prominence, cluster shade, dissimilarity, homogeneity, maximum probability, and information measure of correlation2. These statistics also are calculated over every of the three segmented regions. Again, the ratios of these statistics on the diffusion and inner lesion regions are also calculated. Total 48 texture features are extracted.
3) Border features: Total 7 border features[1] are extracted.
IV. CLASSIFICATIONUSINGSVMCLASSIFIER
Artificial neural network ensemble [1], Adaboost [16] and KNN [14] have been widely used for lesion classification. Many factors influence classification performance, such as parameter settings, extracted features or feature combinations, and the quality of the experimental samples. On highly representative benign or malignant lesions, correct classification is easily achieved, yet on representative lesions, incorrect classifications often happen. Therefore, the difficult task is to achieve correct classification on non-representative lesions. Here, we describe SVM and ANN classifiers to achieve more accurate lesion classification results. SVM proposed by Vapnik [47] and Michal Antkowiak [50] was originally designed for classification and regression tasks, however later has expanded in another directions. Essence of SVM method is construction of optimal hyperplane, which can separate data from opposite classes using the biggest possible margin. Margin is a distance between optimal hyper-plane and a vector which lies closest to it. There can be many hyperplanes which can separate two classes, but with regard to optimal choice, the most interesting solution can be obtained by gaining the biggest possible margin. Optimal hyperplane should satisfy,
( )
V. CLASSIFICATIONUSINGANNCLASSIFIER
In a neural network ensemble, each network individual is initially trained using the same training sample. Then, the outputs of the individual networks are weighted to form the overall output of the ensemble:
( , ) = ∑ (X) ,[1] (2) where X is the input feature vector and is the weight applied to the output of the individual network. Neural networks are
effective only when the individual nets make independent errors [28][30]. A variety of algorithms have been developed to train network to achieve better generalization capability, which can be broadly classified according to the type of initial conditions, training data, network architecture and individual network types. In the model, the network architecture and network type are completed in the model design stage, while the initial conditions and training data are developed in the generation stage of the nets.
VI. EXPERIMENTALRESULTSANDANALYSIS
Two dermoscopy datasets are deployed in our experiments: a xanthous race dataset and a caucasian race dataset. In order to judge the effectiveness of the proposed method, the experiments were performed with reference to assessing the performance dependence on three aspects of the model: novel border features, the generalization ability of the designed SVM and ANN models, and the performance of the proposed classification framework. Three metrics together with sensitivity, specificity and accuracy are used. Sensitivity is that the probability of correct detection of disease. Specificity is that the probability that a benign lesion would not be diagnosed as malignant. And accuracy defines the ratio of the number of properly classified samples to the total number of cases. The higher the values of the accuracy, the better the classification performance of the algorithm.
A. Experiment: Performance Analysis of Lesion Classification Using SVM and ANN
[image:3.612.180.431.508.721.2]In this experiment, our SVM and ANN classifier models was compared with KNN[1], to verify the performance of the proposed classifier models. Table I provides the classification results of the three methods (our SVM and ANN methodologies and KNN model). It can be seen that KNN classifier model delivered the very best specificity however their sensitivity was low, whereas our methodologies obtained the most effective sensitivity. With regards to sensitivity, the performance of our models was more than that of the compared KNN classifier models. Therefore, with the highest accuracy and the best balance between sensitivity and specificity, our SVM and ANN models greatly outperforms the compared classifier model. In [1] wherever features are extracted on patch regions, the models are in a position to cope with incomplete lesion objects. In our methodology, new border features are proposed and on that SVM and ANN classification models are designed. As could be seen in Table I, once compared with the system in [1], by using our methodology the sensitivity and accuracy were greatly improved, that could be a terribly positive outcome. With the most effective accuracy, our methodology is superior to the compared ways. Therefore, our proposed features and designed classifier are additionally highly effective on the datasets.
TABLE I
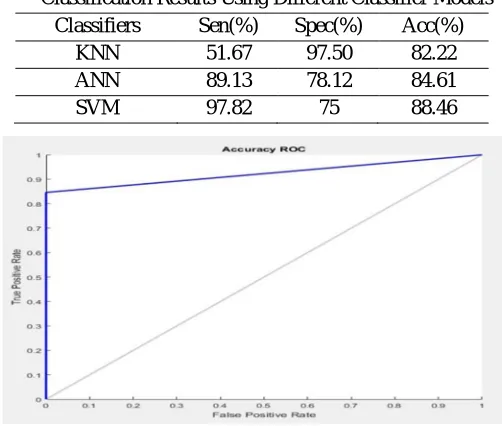
Classification Results Using Different Classifier Models Classifiers Sen(%) Spec(%) Acc(%)
KNN 51.67 97.50 82.22 ANN 89.13 78.12 84.61
SVM 97.82 75 88.46
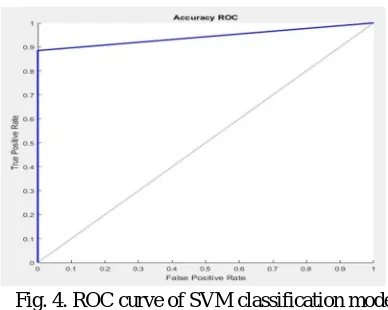
Fig. 4. ROC curve of SVM classification model
Fig. 3. shows the Receiver Operating Characteristic (ROC) curve of the ANN classification model and Fig. 4. shows the ROC curve of SVM classification model. The closer to the top-left corner the ROC curve, the better the method. It can be seen that the proposed classification models greatly outperforms the compared KNN classification model.
VII.DISCUSSION
In this paper, a framework was projected for lesion classification, wherever new texture and border [1] features were proposed and SVM and ANN classification models was designed. Concerning the proposed method, having the subsequent observations.
Although the proposed border features are ready to describe border irregularities more efficiently than the compared strategies, incomplete lesions still present a larger risk of incorrect classification than complete lesions. When a border irregularity is well preserved, this risk is lowered.
These designed models are advanced relative to another common classifier models, like normal Back Propagation (BP), Adaboost, KNN and needs a less compute time and storage space and these are comparatively less complexity.
VIII.CONCLUSION
For classifying skin lesion objects as malignant or benign we have described a unique methodology. 48 descriptive features are used, including 41color and new texture features and 7 novel lesion border feature. In clinical observe, images containing large and incomplete lesion objects are typically obtained by dermoscopy, leading to the failure of systems that depends on common shape features. For the incomplete lesion objects the proposed border features delineate here were insensitive. To deal with this difficult classification problem SVM and ANN classifiers can be used in a very robust and efficient approach. In the experiments, feature extraction were verified and classification performance was tested using KNN, and the proposed SVM and ANN classification models on two datasets that respectively include xanthous race data and caucacian race data. The experimental results powerfully suggest that the proposed lesion features are significantly useful for differentiating malignant from benign skin lesions. The classification results delivered by the designed model were shown to be more accurate than those by the compared methods.
IX. ACKNOWLEDGEMENT
I express my sincere gratitude to the assistant professor of computer science and engineering department Mr. Shyjith M.B, for his inspiration during my study period and for teaching me how to write publications. I would also like to give special thanks to anonymous reviewers for their insightful comments and constructive suggestions to improve the quality of the paper.
REFERENCES
[1] Fengying Xie, Haidi Fan, Yang Li, ZhiguoJiang, RusongMeng, and Alan C. Bovik,“Melanoma Classification on Dermoscopy Images using a Neural Network Ensemble Model”, DOI 10.1109/TMI.2016.2633551, IEEE Transactions on Medical Imaging.
[2] Mohammad Tagi Bahreyni Toossi, Hamid Reza Pourreza and Abbas Azimi,”An effective hair removal algorithm for dermoscopy images”, 2013 john wiley & sons A/S. published by blackwell publishing ltd accepted for publication 9 november 2012.
[3] G. Burg, “Das Melanom,” Serie Gesundheit, Piper/VCH, 1993.
[4] P. Schmid-Saugeona, J. Guillodb, J.P. Thirana, “Towards a computeraided diagnosis system for pigmented skin lesions.” Computerized Medical Imaging and Graphics, vol. 27, no. 1, pp. 65 78, 2003.
[5] R.L. Siegel, K.D. Miller, A. Jemal, “Cancer Statistics, 2015,” CA: A Cancer Journal for Clinicians, vol. 65, no. 1, pp. 5-26, 2015.
[7] G. Argenziano, H.P. Soyer, V. De Giorgi, D. Piccolo, P. Carli, et al., “Interactive atlas of dermoscopy,” EDRA Medical Publishing(http://www. dermoscopy.org), 2000.
[8] M. Binder, M. Schwarz, A. Winkler, et al., “Epiluminescence microscopy: a useful tool for the diagnosis of pigmented skin lesions for formally trained dermatologists,” Archives of Dermatology, vol. 131, no. 3, pp. 286-291, 1995.
[9] T. Schindewolf, W. Stolz, R. Albert, et al., “Classification of melanocytic lesions with color and texture analysis using digital image processing,” American Society of Cytology, vol. 15, no. 1, pp. 1-11, 1993.
[10] N. Cascinelli, M. Ferrario, T. Tonelli, et al., “A possible new tool for clinical diagnosis of melanoma: the computer,” Journal of the American Academy of Dermatology, vol. 16, no. 2, pp. 361-367, 1987.
[11] W. Stolz, A. Riemann, A.B. Cognetta, et al., “ABCD rule of dermatoscopy — a new practical method for early recognition of malignant-melanoma,” European Journal of Dermatology, vol. 4, no. 7, pp. 521–527, 1994.
[12] X. Yuan, Z. Yang, G. Zouridakis, et al., “SVM-based texture classification and application to early melanoma detection,” Engineering in Medicine and Biology Society, 2006. EMBS’06. 28th Annual International Conference of the IEEE. pp. 4775–4778, 2006.
[13] B. Kusumoputro, A. Ariyanto, “Neural network diagnosis of malignant skin cancers using principal component analysis as a preprocessor,” Neural Networks Proceedings, 1998. IEEE World Congress on Computational Intelligence, pp. 310–315, 1998.
[14] H. Ganster, A. Pinz, R. Rohrer, et al., “Automated melanoma recognition,” IEEE Transactions on Medical Imaging, vol. 20, no. 3, pp. 233-239, 2001.
[15] M.E. Celebi, H.A. Kingravi, B. Uddin, et al., “A methodological approach to the classification of dermoscopy images,” Computerized Medical Imaging and Graphics, vol. 31, no. 6, pp. 362-373, 2007.
[16] G. Capdehourat, A. Corez, A. Bazzano, et al., “Toward a combined tool to assist dermatologists in melanoma detection from dermoscopic images of pigmented skin lesions,” Pattern Recognition Letters, vol. 32, no. 16, pp. 2187-2196, 2011.
[17] N. Situ, X. Yuan, G. Chen, and J. Zouridakis, “Malignant melanoma detection by bag-of features classification,” in Proc. 30th IEEE EMBS Annu. Int. Conf., pp. 3110C3113, 2008.
[18] C. Barata, M. Ruela, M. Francisco, et al. “Two systems for the detection of melanomas in dermoscopy images using texture and color features,” Systems Journal, IEEE, vol. 8, no. 3, pp. 965-979, 2014.
[19] C. Barata, E. M. Celebi, J. S. Marques. “Improving dermoscopy image classification using color constancy,” Biomedical and Health Informatics, IEEE Journal of, vol. 19, no. 3, pp. 1146 1152, 2015.
[20] F.Y. Xie, S.Y. Qin, Z.G. Jiang, R.S. Meng, “PDE-based unsupervised repair of hair occluded information in dermoscopy images of melanoma,” Computerized Medical Imaging and Graphics, vol. 33, no. 4, pp. 275-282, 2009.
[21] M. Emre Celebi, “Automated Quantification of Clinically Significant Colors in Dermoscopy Images and Its Application to Skin Lesion Classification,” IEEE systems journal, vol. 8, no. 3, september 2014.
[22] N. Otsu, “An automatic threshold selection method based on discriminate and least squares criteria,” Automatica, vol. 63, pp. 349-356, 1979.
[23] M.E. Celebi M, H.A. Kingravi, H. Iyatomi, et al., “Border detection in dermoscopy images using statistical region merging,” Skin Research and Technology, vol. 14, no. 3, pp. 347-353, 2008.
[24] K. Korotkov, R. Garcia, “Computerized Analysis of Pigmented Skin Lesions: A Review,” Artificial Intelligence in Medicine, vol. 56, no. 2, pp. 69-90, 2012.
[25] M. Hintz-Madsen, K.L. Hansen, J. Larsen, et al., “A probabilistic neural network framework for detection of malignant melanoma,” Artificial Neural Networks in Cancer Diagnosis, Prognosis and Patient management, vol. 5, pp. 3262-3266, 2001.
[26] P.G. Cavalcanti, J. Scharcanski, “Automated prescreening of pigmented skin lesions using standard cameras,” Computerized Medical Imaging and Graphics, vol. 35, no. 6, pp. 481-491, 2011.
[27] D.A. Clausi, “An analysis of co-occurrence texture statistics as a function of grey level quantization,” Canadian Journal of remote sensing, vol. 28, no. 1, pp. 45-62, 2002.
[28] A. Ghodsi, “Dimensionality reduction a short tutorial,” Department of Statistics and Actuarial Science, Univ. of Waterloo, Ontario, Canada, 2006.
[29] L.K. Hansen, P. Salamon, “Neural network ensembles,” IEEE Transactions on Pattern Analysis and Machine Intelligence, vol. 12, no. 10, pp. 993-1001, 1990.
[30] V. Bukhtoyarov, E. Semenkin, “Neural Networks Ensemble Approach for Detecting Attacks in Computer Networks,” in 2012 IEEE World Congress on Computational Intelligence, pp. 10-15, 2012.
[31] D. Partridge, “Network generalization differences quantified,” Neural Networks, vol. 9, no. 2, pp. 263-271, 1996.
[32] V.V. Bukhtoyarov, O.E. Semenkina, “Comprehensive evolutionary approach for neural network ensemble automatic design,” in 2010 IEEE Congress on Evolutionary Computation (CEC), pp. 1-6, 2010.
[33] V. Bukhtoyarov, E. Semenkin, “Neural networks ensemble approach for detecting attacks in computer networks,” in 2012 IEEE Congress on Evolutionary Computation (CEC), pp. 1-6, 2012.
[34] H. Drucker, C. Cortes, L.D. Jackel, et al., “Boosting and other ensemble methods,” Neural Computation, vol. 6, no. 6, pp. 1289-1301, 1994.
[35] Y. Freund, R.E. Schapire, “A decision-theoretic generalization of on-line learning and an application to boosting,” Journal of Computer and System Sciences, vol. 55, no. 1, pp. 119-139, 1997.
[36] G. Giacinto, F. Roli, et al., “Unsupervised learning of neural network ensembles for image classification,” Neural Networks, vol. 3, 155-159, 2000.
[38] G.P. Zhang, “Neural network ensemble method with jittered training data for time series forecasting,” Information Sciences, vol. 177, no. 23, pp. 5329-5346, 2007.
[39] J. Yang, X. Zeng, et al., “Effective neural network ensemble approach for improving generalization performance,” IEEE transactions on neural networks and learning systems, vol. 24, no. 6, pp. 878-887, 2013.
[40] D.W. Opitz, J.W. Shavlik, “Actively searching for an effective neural network ensemble,” Connection Science, vol. 8, no. 3-4, pp. 337-354, 1996.
[41] M.P. Perrone, L.N. Cooper, “When networks disagree: Ensemble method for neural network,” Neural Networks for Speech and Image Processing, Chapman Hall, pp. 126-142, 1993.
[42] T. Mendonca, P. M. Ferreira, J. S. Marques, et al. “PH2-A dermoscopic image database for research and benchmarking,” in 35th Annual International Conference on Engineering in Medicine and Biology Society (EMBC), pp. 5437-5440, 2013.
[43] J.F. Alcon, C. Ciuhu et al., “Automatic Imaging System With Decision Support for Inspection of Pigmented Skin Lesions and Melanoma Diagnosis,” IEEE Journal of Selected Topics in Signal Processing, vol. 3, no. 1, pp. 14-25, 2009.
[44] J. Blackledge, D. Dubovitskiy, “Object detection and classification with applications to skin cancer screening,” ISAST Transactions on Intelligent Syetems, vol. 1, no. 2, pp. 1-12, 2008.
[45] I. Tsochantaridis, T. Joachims, et al., “Large margin methods for structured and interdependent output variables,” Journal of Machine Learning Research, vol. 6, pp. 1453-1484, 2005.
[46] The gental adaboost package, Available: http://graphics.cs.msu.ru/en/ science/research/machinelearning/adaboosttoolbox.
[47] The libsvm package, Available: http://www.csie.ntu.edu.tw/cjlin/ libsvm/.
[48] Cortes, C and Vapnik, V, “Support-vector networks,” Mach. Learn. 1995, 20, 1–20.
[49] P. Schmid, “Segmentation of digitized dermatoscopic images by two-dimensional color clustering,” IEEE Trans. Med. Imaging 18 (1999) 164–171.
[50] Michal Antkowiak, “Artificial Neural Networks vs. Support Vector Machines for Skin Diseases Recognition,” UMEA University Department of Computing Science SE-901 87 UMEA sweden.