[ 6
5o ]
STUDIES IN THE DEVELOPMENT OF THE RAINBOW
TROUT (SALMO IRIDEUS)
II. THE METABOLISM OF CARBOHYDRATES AND FATS
BY SYDNEY SMITH
The Zoological Laboratory, University of Cambridge
(Received 20 May 1952)
(With Two Text-figures) I. INTRODUCTION
The first paper of this series (Smith, 1947) reported the measurement of wet and dry weights, nitrogenous excretion and heat production of a single batch of fertilized eggs of the rainbow trout {Salmo irideus). It was shown that the dry-weight loss of egg and alevin was commensurate with the fall in total nitrogen and in total fuel value of the system. The dry-weight losses observed could be attributed to the observed combustion of protein, together with the combustion of some substance with a fuel value characteristic of fat. It was concluded that the main sources from which the energy for development is derived are protein and fat.
In the present paper the results of the determination of total carbohydrate are set out, together with the results of glyceride-fat extraction of dry egg, embyro and yolk material; an analysis of the metabolism of glyceride and phosphatide fats in trout development is presented; the probable substrates used in daily heat produc-tion are traced; and the concept of a sequence of energy sources in embryonic development is discussed.
II. MATERIAL
The batch of trout eggs on which carbohydrate determinations were made was also used for the measurement of heat production and nitrogen excretion, and for wet-and dry-weight determinations: details of this batch are given in Smith (1947). About the 22nd day eggs were weighed singly on a torsion balance, and only those with a weight of from 85 to 94 mg. were used for subsequent work. Sampling errors were thereby minimized.
For the determination of the glyceride-fat content dried samples of egg, embryo and yolk of the 1934-5 rearing were used. The egg size, hatching date and period of larval life of these were strictly comparable with those of the 1936-7 batch which is under discussion.
III. METHODS
(a) The determination of total carbohydrate
2-2% hydrochloric acid to release sugars in combination, neutralization with caustic soda, and precipitation by means of mercuric sulphate of any non-carbo-hydrate substances showing reducing action. Since mercuric sulphate precipitates glycogen, it is essential that the preliminary hydrolysis be complete before adding mercuric sulphate. Excess mercuric ion is removed by barium carbonate and by the action of zinc dust in alkaline solution. Total carbohydrate is then estimated in the filtrate by heating with Murphy and Young's reagent, followed by a titration with iodine-thiosulphate. The reagents used were calibrated with standard glucose solutions and the results of analysis are expressed in milligrams of glucose per gram of wet tissue.
(b) The determination of the glyceride-fat content
The determinations were on dried samples of egg, embryo and yolk, using a modified Soxhlet extraction apparatus requiring samples of approximately 50 mg., weighed on a microbalance. The extracting agent was carbon tetrachloride, so that the results are comparable with those for the Atlantic salmon obtained by Hayes (1930). The method of extraction using carbon tetrachloride is of limited value, since the agent is a non-polar solvent and will not extract polar lipids such as phosphatides. It was difficult to handle some of the later yolk samples because, when ground in an agate mortar, oily matter was pressed out from the material so that uniformly mixed samples could not be prepared. Extraction was continued until there was no further increase in weight of the extract, collected in weighing bottles and evaporated to constant weight at room temperature, using a 'Hyvac' pump. It proved impracticable to weigh the extraction cones, since the change in weight of these with varying conditions of atmospheric humidity necessitated enclosure in a weighing bottle, and such a bottle would have been too bulky for the sensitive microbalance employed.
IV. EXPERIMENTAL RESULTS
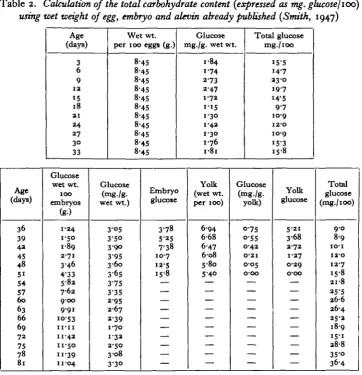
(a) The carbohydrate content of egg, embryo and yolk
The results of the analysis of total carbohydrate in egg, embryo and alevin are set out in Table 1. Smoothed mean values of the carbohydrate content and the wet weights of egg, embryo and alevin (see Smith, 1947) permit computation of the total carbohydrate content of the system. The results are set out in Table 2. There is no significant difference between the carbohydrate content of fertilized and un-fertilized eggs. In the un-fertilized egg a peak in carbohydrate content occurs about the 9th day when gastrulation overgrowth is almost complete; this is followed by a steady decline from the 9th to the 18th day. Subsequently, a slow synthesis sets in and is interrupted by hatching around the 36th day.
The amount of carbohydrate in the yolk material is very low and cannot be detected. After the 50th day, however, the yolk-sac wall, because of its considerable blood supply, may contain a significant amount of carbohydrate.
652 SYDNEY S M I T H
synthesis at a later stage. This observation is the more remarkable since yolk reserves are almost exhausted at this period and the alevins were denied food. Under normal conditions the young fish would be eating at this stage.
Table 1. Measurements of total carbohydrate content expressed as glucose
Age (days)
mg./g. wet material expressed as glucose results of separate
determinations
Glucose (mg./g-mean value)
Sample
_L
3 3 7 7
10
13 18 23 27 32 36 36 36 39 44 49 49 53 S9 69 7i 78
i-86, i-83 i-49, i-93 2-io, i-95 i-75. I-73
2-40, 2-28 i-86, 2-37, 2-46
I-OO, I-OO
O-92, 2-OO
i - 3 . i - i i i'5 2-14, 2-32
1-89, o-6 3-4 0-75
3-°7
4-1. 3-9 3-74. 3-44 o-oo 3-6, 4-0 3-04, 2-99 2-42, 2-76 1-48, i-oo, 1-33 2-99, 3-62, 2-81
1-84 i-7
2-02
1-74
2-34 223
I-OO
1-46 13 2 2 3 i-3 3'4 °-75 3-i 4-0 3-59 o-oo 3-8 3-02 2-59 127 3-14
Fertilized eggs Unfertilized eggs Unfertilized eggB Fertilized eggs Fertilized eggs Fertilized eggs Fertilized eggs Fertilized eggs Fertilized eggs Fertilized eggs Fertilized eggs Embryo
Yolk (dried before analysis) Embryo
Embryo Embryo
Yolk (dried before analysis) Embryo
Embryo Embryo Embryo Embryo
Carbohydrates, never present in large amount, are thus consumed during three relatively short phases of development:
(i) Immediately after gastrulation when the blood system is developed; 9—18 days of incubation at io° C.
(ii) During the period of hatching; 34—36 days at 10° C. (iii) At the onset of starvation; 66-68th days at io° C.
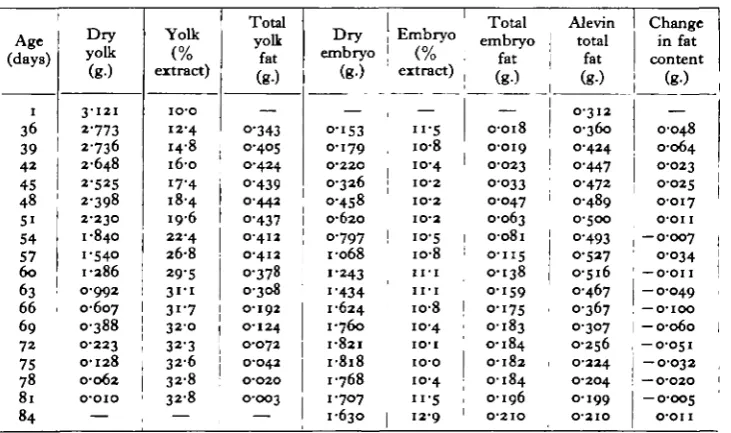
(b) The glyceride-fat content of egg, embryo and yolk
In Table 3 the results of the carbon tetrachloride extraction of dried egg, embryo and yolk material are set out. Because of difficulties in sampling and extracting, maximum values are more nearly correct, and smoothed maxima were used in the preparation of Table 4, indicating the probable content of glyceride fat in embryo and yolk throughout the yolk-sac phase.
The analyses are not sufficiently accurate to permit any definite statement about the occurrence of glyceride-fat synthesis between fertilization and hatching. The values for the total glyceride-fat content, calculated from dry-weight determinations and smoothed maximal fat extractions (Table 4), indicate that significant
glyceride-Table 2. Calculation of the total carbohydrate content {expressed as mg. glucose/ioo)
using wet weight of egg, embryo and alevin already published (Smith, 1947)
Age (days) 3 6 9 1 2 15 18 2 1 2 4 2 7 3 0 33 Wet wt. per 100 eggs (g.)
8-45 8-45 8-45 8-45 8-45 8-45 8-45 8-45 8-45 8-45 8-45 Glucose mg./g. wet wt.
1-84 1-74 2-73 2-47 1 72
1 1 5
i-3° 1-42 1-30
1 7 6
I - 8 I
Total glucose
mg./ioo
15-5 14-7 23-0
1 9 7
14-5 9-7 10-9
I2-O
IO-9
1 5 3
15-8 Age (days) 36 39 4 2 45 48 5 i 54 57 6 0 63 66 69 7 2 75 78 81 Glucose wet wt.
1 0 0
embryos (g-) 1-24 1-50 1-89 2-71 3'4° 4'33 5-82 7-62 9-00 9-91 10-53
I I - I I
11-42 11-50 11-39 11-04 Glucose (mg./g. wet wt.) 3-05 3-5°
3 0 0
3-95 3-60 3-65 3-75 3-35 2-95
2 6 7
2-39 1-70 1-32 2-50 3-o8 3-3° Embryo glucose 3-78 5-25 7-38 10-7 12-5 X5-8 — — — — — — — — — — Yolk (wet wt. per 100)
6 9 4 6-68 6-47
6 0 8
5-80 5-40 — — — — — — — — — — Glucose (mg./g. yolk) 0-75 o-55 0-42 0-21 0-05 o-oo — — — — — — — — — — Yolk glucose 5-21 3-68 2-72 1-27 0-29 o-oo — — — — — — — — — — Total glucose (mg./ioo) 9 0 8-9 IO-I I2-O 12-7 15-8 21-8 25-5
2 6 6
26-4 25-2 l8'9 I5-I 28-8 35-o 36-4
fat catabolism is confined from the 63rd to 80th days of rearing at 10° C , being at a maximum around the 66th day. This confirms Hayes and Ross's (1936) observa-tions on the Atlantic salmon, which show a similar fat-consumption peak at a com-parable phase of the yolk-sac period.
(c) The estimation of total fat catabolism
[image:4.595.118.481.213.589.2]6
[image:5.595.193.406.196.412.2]54
SYDNEY S M I T HTable 3. Mean values of carbon tetrachloride extractions
[image:5.595.119.485.481.697.2]Age | (days) 1 (eggs) 1 (eggs) 2 9 34 36 38 4 i 44
1 4 7
! 50 1 S3 ! 56 59 6 2 6s , 68 77 77 86 Extract yolk (%) 1 9-4, io-o 14-2 (after
HCI hydrolysis) |
8-o 1 13-0 13-4
6-53 6-95 n - 7 n - 9
13-0
1 0 6
26-0 24-1 : 30-7 21-4 26-2 32-7 — — Extract embryo (%) — — 8-87 — n - 9
9-20 IO-2 7"9S — — — 7-73
1 1 1 8
9 9 7 —
9 8 0 10-05 13-89
Table 4. Calculation of the total glyceride (CC74 extractable) fat content.
All figures refer to 100 individuals
Age (days) 1 36 39 4 2 45 48 S i 54 57 6 0 63 66 69 7 2 75 78 81 84
D r y yolk ( g )
3 - 1 2 1
2-773 2736 2-648 2-525 2-398 2-230 1-840 1-540 1-286 0-992 0-607 0-388 0-223 0-128 0-062 o-oio — Yolk (% extract) io-o 12-4 14-8 16-0 17-4 18-4 19-6 22-4 26-8 29-5
3 1 1
31-7
3 2 0
32-3 3 2 6 32-8 32-8 — Total yolk fat
( g )
— O-343 0-405 0-424 O-439 0-442 O-437 0-412 0-412 0-378
0 - 3 0 8 0 - 1 9 2 0 - 1 2 4 0 - 0 7 2 0 - 0 4 2 O-O20 O-OO3
D r y embryo (g-) — O-IS3 0-179 0-220 0-326 O-458 0-62O 0-797 •068 •243 •434 -624 •760 •821 •818 •768 •707 •630 Embryo (% extract) —
" • 5 io-8 10-4 IO-2 IO-2 IO-2 10-5
1 0 8 I I - I I I - I
i o - 8
1 0 4 IO-I
io-o 10-4
I I - S
1 2 9
Total embryo
fat
( g )
— 0-018 0-019 0-023 0-033 0-047 0-063 o-o8i 0-115 0-138 0-159 0-175 0-183 0-184 0-182 0-184 0-196 O-2IO Alevin total fat (g-) 0-312 0-360 O-424 0-447 0472 0-489 0-500 O-493 0-527 0-516 0-467 0-367 0-307 0-256 0-224 0-204 0 1 9 9 O-2IO Change in fat content (g-) — 0-048 0-064 0-023 0-025 0-017 O'OII — 0-007 0-034 — o-on
- O - O 4 9
(observed as nitrogen excretion) and of carbohydrate consumption (already summarized in this paper), in order to compute that proportion of the measured heat production which cannot be attributed to protein and carbohydrate catabolism. This procedure seems the more reasonable, since dry-weight losses, nitrogen excretion and heat production fit into a coherent picture if this method of computa-tion is admitted (Smith, 1947). The calculacomputa-tion is set out in Table 5. Column 1
Table 5. Figures all refer to 100 individuals
Age (days)
( 1 )
1 2 IS 18 2 1 24 27 3O 33 36 39 42 45 48 51 54 57 60 63 66 69 72 75 78 81 84 cal./hr. from N excretion
( 2 )
0-047 0-105 0-216 0-290 0-258 0-263 0-392 0-516 0 6 0 6 0-724 0-868 I-OI 1-18 i-34 1-71 2-29 2-30 2-60
3 2 2 3-4° 3 1 6 2 9 8 3'79 3-71 3-45 cal./hr. from carbo-hydrate combustion (3) 0-26 0-26 0-26 — — — — — 0-42 — — — — — — 0-04 0-22 0-30 — — — — — cal./hr. heat production measured (4) 0-76 0-98 o-8o 0-96 1-04 o-86 O-45 0-78 I-2O 1-70 2-30 3-O5 3-95 5-33 6 6 4 8-6 9-8 11-45 11-85 5-72 9 6 14-1 11-4 io-o 8-86 Residual heat production
(s)
°-45
0-62 0-32 0-67 0-78
o-6o 0 0 6
0-26 0-17 0-98 1-43 2-04 2-77 3'99 4-93 6 3 7-5 8-9 8-41 2-O2 6 4
I I - I
7-6 6-3 5-4i cal./hr. from glyceride fat (6) — — — — — — — — — -— 2 8
I I - 2
7-9 6-7 5-i 3 2 i - 6 o-o — cal./hr. from non-glyceride fats (7) O'45 0-62 0-32 0-67 0-78 o-6o 0-06 0-26 0-17 0-98 1'43
2 0 4
2-77
3-99 4-93 6-3 4"7
- 2 - 3
0'5 - 4 - 7 i-3 7-9 6 0 6-3
5-4i
gives age, column 2 the heat production calculated from the observed protein breakdown, and column 3 the heat production resulting from limited and infrequent carbohydrate combustion. The observed heat production is set out in column 4. The heat production remaining after the sum of entries in columns 2 and 3 has been subtracted from column 4, is given in column 5, and is the heat production not traceable to the combustion of protein and carbohydrate. It is inferred that these values arise from the catabolism of some form of fat.
Since amino-nitrogen does not pass through the chorionic membrane, the heat-production figures calculated from the nitrogen excretion before hatching may be less than the true value. The accumulated amino-nitrogen is released during hatching (Smith, 1947).
656
SYDNEY SMITHIt is reasonably certain that some fat catabolism occurs before the hatching period from the 34th to 36th days, but to what extent, and when, cannot be definitely stated on the evidence here presented. After hatching the nitrogen excretion can be observed directly, together with the heat production. It is probable that the
150"
140-
130-
120-
110-
100-
90-8
C.
80-T;
70-
60-
50-
40-
30-
20-
10-• Total heat production, cal./hr./100
x Heat production from protein
catabolism, cal./nr./100 D Heat production from
carbohydrate catabolism, cal./nr./100 • Heat production
from fat catabolism, cal./hr./100
10
Fig. 1.
20 30 40 50 60
Days after fertilization
70 80 90
Graph to show the contribution of carbohydrate, protein and fat consumption to the daily heat production.
figures for the fat catabolism that may be deduced from such directly measured quantities are more reliable than results obtained from any of the methods of total extraction at present available.
The figures from Table 5 for heat production from consumption of carbohydrate (column 3), of protein (column 2) and of total fat (column 5) are set out graphically in Fig. 1 together with the observed heat production (column 4). The total fat consumption is analysed into glyceride and non-glyceride fractions in columns 6 and 7 respectively of Table 5.
pro-portion of the daily heat production derives from fat catabolism. Over the major period of development, until at the earliest the 57th day, the fat burnt is non-glyceride, i.e. it is probably phosphatide fat. This non-glyceride fat is probably contained in the aqueous phase of the yolk, bound to the yolk proteins in some form of complex. It may be absorbed and consumed by the embryo in that combination.
Table 6
Age
(days)
36 39 4 2 45
48
51 54 57 6 0 63
66 69
7 2 75 78 81 84
Heat production
Nitrogen compounds
0 9 3
0-89 0-83 0-63 0-50 0-41 0-40
0 3 9
O-34 o-34 0-37 0-36 o-33 0-31 0-41 0-42 0-41
in cal./hr. from the
Carbohydrate
0-64
— — — — — — — —
0-005 0-03 0-03
— — — — —
by 1000 cal. of embryo catabolism of
Fat
0-27
• 3 1
•38 •26 •18
• 2 1
•14 •09
• 1 0
[•13 0-96
O-2I
0-67 1-17 0-83 0-72 0-65
material
Total
1-84 :
2-IO 2-21 1-89 i-68
1 6 2
i-54 1-48 1-44 1-47
1 3 6
0-61
I'OO
1-48 1-24 1-14 1-07
The relative contribution of the three main substrates, carbohydrate, protein and fat, during the yolk-sac period may be seen more clearly if the intensity of catabolism for each component be expressed in units of embryo tissue. In Table 6 the hourly heat production in calories for each 1000 cal. of embryo is calculated and also the proportionate share of carbohydrate, protein and fat to this hourly heat production. These quantities are represented graphically in Fig. 2. It is clear that the level of catabolism of protein at a high level in the beginning settles down from the 50th day onwards roughly at the level of 0-4 cal./hr./iooo cal. of embryo. This level is maintained throughout relatively violent changes in the level of fat catabolism. Carbohydrate is consumed on two occasions only during the period from hatching to the complete absorption of the yolk-sac, the first over hatching and the other from the 63 rd to 69th days of incubation when the thermal contribu-tion would seem hardly significant. It is of interest, however, to correlate this temporary expenditure of carbohydrate reserve with the change-over from com-bustion of phosphatide fat of the aqueous yolk phase to the glyceride-fat of the yolk oil globule.
658 SYDNEY SMITH
o
i
OS
•
Total heat production, cal./hr./1000cal. dry embryo Total heat production from protein catabolism, cal./hr./IOOOcal. dry embryo
Total heat production from carbohydrate catabolism, cal./nr./1000cal. dry embryo Total heat production from fat catabolism, cal./hr./1000cal. dry embryo
50 60
Days after fertilization
70 80
Fig. 2. Graph to show the rate of heat production for each iooo cal. of embryo arising from the catabolism of carbohydrate, protein and fat.
V. DISCUSSION
The analysis of the fat content of embryo and yolk-sac throughout the development of the rainbow trout egg which has been presented shows that glyceride-fats, which constitute the conspicuous oil drop of the teleost yolk-sac, increase slightly in total amount during the first two-thirds of the free-living yolk-sac phase. After this the glyceride fats are consumed in an intense burst of heat production. The importance of the phosphatide fats for the maintenance of the embryo during the first two-thirds of the yolk-sac phase has been demonstrated. They seem to be coupled to the proteins of the aqueous phase of the yolk. The changes in total carbohydrate show that combustion of this energy source is confined to three periods: (i) immediately after gastrulation; (2) during the period of hatching; (3) at the onset of starvation. The relation of these findings to earlier investigations is discussed below.
(a) The fats of the salmonid egg and embryo
contained pigment but no phosphorus at all. He also experienced difficulty in extracting phospholipids of salmon (Onchorhynchus) roe, unless a polar solvent such as methyl or ethyl alcohol was used. 12-5% oil and 6-2% phospholipid were found. It is assumed these percentages refer to the dried material.
Tangl & Farkas (1904) found the ether extract of the trout egg to be 9-4% of the dry weight: in the newly hatched larva the extract amounted to 12-1%. Lieber-mann's wet saponification at the corresponding stages gave for the egg 21-3% of the dry weight as fat and for the larva 22-8 %.
McClendon (1915) studied the egg and 'young' (newly hatched) fish stage of the American brook trout (Salvelinus fontinalis) using both the fatty acid determination on fresh material of Kumagawa & Suto (1908) and the alcohol ether extraction of material dried at a low temperature in vacuo. His extract was 23-4% of the dry weight of the eggs and 24-7 % of that of the newly hatched alevins. An increase of 5'55 % m the ether soluble fraction between egg and alevin was also observed, and there was also a parallel increase in fatty acid from 16-17% in the egg to 17-16% in the young fish. The loss in dry weight over the period of development studied was 2-5%, and McClendon considered it probable that fats were formed from protein, during this phase of development.
A complete analysis of the fats in the trout egg was made by Faure-Fremiet & Garrault (1922). Total fats were 22-4% of the dry weight; glyceride amounted to 10%; phosphatides, 8-25%; cholesterol, 1-37%; and unsaponifiable residues, 0-67%.
Hayes (1930) extracted dried samples of Salmo solar, eggs and alevins, over a considerable period of their development with carbon tetrachloride. The fat content of the 36-day egg was 12-2% of the dry weight; of the newly hatched alevin at 65 days 8-47% and at 70 days 12-6%. By 116 days, the glyceride-fat content had risen to 20-0% of the dry material of the alevin. The temperature of incubation was low and variable, so these figures may not be compared with those in Table 3, but the rise in glyceride-fat content during the free-living yolk-sac period is very suggestive.
Hayes & Ross (1936) continued this study of Atlantic salmon egg development and found that 22-6% of the egg and io-8% of the alevin at the end of the yolk-sac period could be extracted by an alcohol ether mixture using fresh material.
66o SYDNEY SMITH
It is of interest that Lafon considers the rate of transfer of the yolk proteins into the embryo more speedy than the transfer of fats. He remarks that the dried material of the yolk-sac becomes enriched in fats as development proceeds. Five days after hatching the total fat content of the yolk-sac is 22-5 % of the dry weight, 21 days later it is 34-8% and after a further 9 days no less than 37%. The observed iodine values of yolk and embryo fats showed little variation. The percentage of phosphorus seemed to fall during embryonic development, being slightly less in embryo fats (i-oo%) than in yolk fats (1-15 %). Lafon suggests that this fall in fat-soluble phosphorus in the embryo might arise either from a preferential oxidation of yolk phosphatides or else from the conversion of phosphatide fat to glyceride fat while in course of transfer from yolk-sac to embryo. The balance of the evidence reviewed here would tend to support this last hypothesis.
The analysis of the rainbow trout egg by Hartmann, Medem, Kuhn & Bielig (1947) is in agreement with the main conclusions reached independently in the course of this study. Their results were as shown in Table 7.
Table 7
Dry substance Water
Ash
Fat (Eiol) Phosphatide Chorion
Protein of egg contents Total protein (N x 6-25) Nitrogen-free extract
mg. per fresh egg wt. 44-3 mg.
14-94 2932 0-57
1 6 0
166 1-19 8-93 — 1-03
Percentage by weight dry substance
ioo-oo
O'OO
3-8i 10-67 11-09 7-95 59-62 — 6-86
Percentage by weight fresh egg
33-82 6 6 1 8 1-29
3 6 1
3-75 2-69 20-16 2 3 1 9 2-32
Concerning the phase distribution and chemistry of the major egg components they concluded: 'Das Ol des Eies von S. irideus enthalt weder Stickstoff noch Phosphor. Die Phosphatide liegen vollstandig in der wassrigen Eifliissigkeit vor. Sie sind an Eiweiss gebunden; atherloslicher Phosphor lasst sich erst nach Vorbehandlung mit Alkohol extrahieren. Auch die Kohlenhydrate liegen in gebundener Form vor.'
In the study under discussion the glyceride-fat of the egg was found to be io-o% of the dry material of the egg which is in substantial agreement with Tangl & Farkas, Faure-Fremiet & Garrault, and Hartmann et al. The value of 1 2 3 % for the glyceride-fat in the newly hatched alevin compares well with the value of
12-1 % given by Tangl & Farkas. The fat content at the end of the yolk-sac period (77th day) is 10-05 %, m ^T agreement with Hayes & Ross's figure of io-8 % for the salmon. Ether extraction of a large number of eggs after hydrolysis in 2-2% hydro-chloric acid yielded 14-2% of fatty material showing some release of fat from the yolk as a result of the partial hydrolysis.
salmonid egg is distributed between two main sites, one of which is the glyceride-fat globule, and the other a water soluble lipoprotein which constitutes the main bulk of the yolk.
(b) The mechanism of fat absorption
The yolk-sac wall of the trout embryo is a multinucleate syncytium; it has a well-developed blood circulation in which blood from the liver capillaries after flowing through the yolk-sac wall is collected into a vein leading directly to the heart. Preliminary studies of the egg and alevin have been made, using the lipoid techniques of Baker (1944); they indicate a general distribution of lipoid throughout the bulk of the yolk mass in addition to that of the oil globules. In all stages examined there is evidence that the yolk mass breaks down into a zone of emulsified droplets in contact with the yolk-sac wall, and, at the stages so far studied, such droplets seem to be composed of the bulk lipoprotein phase only. The blood vessels of the yolk-sac contain oily matter staining intensely with Sudan Black. It seems probable, therefore, that after digestion some of the fat at least appears in the embryonic circulation as glyceride-fat.
The glyceride-fat droplets in the yolk-sac may be protected from enzyme action by an adsorbed layer of protein; evidence for this can be seen in the abnormally low interphasial tension (06 dyne/cm.) between oil globule and yolk observed by Harvey & Shapiro (1934) and Danielli & Harvey (1934). It is perhaps significant that the lipase activity of aqueous extracts of trout eggs differs notably from the lipase activity of the solids left after water extraction (Falk, Noyes & Lauberblatt, 1927). In the young fish this difference between water-extract activity and that of the residue does not occur. It would seem, therefore, that in the case of the egg, solubility played an important part in the observed lipase activity; for instance, if the lipase were present only in the aqueous phase of the yolk then the protection of the glyceride-fat droplets against the action of the lipase until a late stage of the yolk-sac period would follow automatically since access of the enzyme to the glyceride-fat substrate would first require the relative exhaustion of the water-soluble lipoprotein of the yolk.
The morphology of the liver and yolk-sac circulation in the rainbow trout alevin has been studied by Portmann & Metzner (1929). Some 14 days after hatching the developing liver presses against the yolk-sac and increases in size as the yolk-sac diminishes. The area of contact on the anterior left aspect of the yolk-sac shows peculiar cytological changes which are initiated some 30 days after hatching. The double layer of splanchnopleur and the cell wall of the liver in contact with the yolk-sac syncytium disappear, so that the nuclei of the liver cells may be observed surrounded in part by their proper cytoplasm and in part by tissue of the syncytium of the yolk-sac wall.
662 SYDNEY S M I T H
material which had been reared in Cambridge for a total of 74 days at io° C. In the case of Portmann & Metzner's (1929) material the initiation of fusion probably began at about the 70th day. Their material was, however, incubated at a lower mean temperature.
It seems probable, therefore, that this fusion of liver cells with the yolk-sac wall and the final absorption of the glyceride-fat from the yolk-sac may be correlated with the gross changes of metabolic activity initiated about the 66th day of incuba-tion at io° C. which has been described in a previously published paper (Smith, 1947). Whatever the mechanism may be for the accumulation of glyceride-fat during a considerable part of the yolk-sac phase, the increase in amount of glyceride fat and its later consumption in a relatively intense burst of heat production cannot be disputed.
(c) The carbohydrates of the developing salmonid
A direct comparison between the observations under discussion and the work of Hayes & Hollett (1940) on the Atlantic salmon is not easy, since they measured total free carbohydrate as glucose and as glycogen after water extraction and did not estimate that fraction of the carbohydrate attached to yolk protein. They report no glycogen in the salmon egg and only very small amounts of glucose (0-049 g7I O° S-of egg), whereas in the trout, after hydrolysis, the total carbohydrate expressed as glucose is as much as 0-18 g./ioo g. of egg. The discrepancy between these results seems to imply that most of the carbohydrate of the egg is bound to protein.
It is the decline in this bound carbohydrate that is presumably responsible for the first peak of carbohydrate combustion which was accordingly not detected by Hayes & Hollett, but has since been observed by Daniel (1947). The maximum carbohydrate content recorded by Hayes & Hollett was of the order of 0-6 g./ioo g. of embryo and is half as much again as the value of 0-4 g./ioo g. of embryo observed for the trout. The lower values here recorded might have arisen from loss of blood while preparing the embryo for analysis. The Canadian authors report glucose consumption during hatching, and at the same time an interruption in carbohydrate synthesis. Glycogen accumulates in the liver at a steady rate beginning some 30 days after hatching. They also report a significant combustion of glycogen and glucose initiated approximately 60 days after hatching; this would correspond to the combustion observed around the 66th day in the present series of observations during the initial phase of starvation.
Lafon (1947) reports a sugar content in S.fario and S. irideus material of the order of 2-0 mg./g. of fresh material. Hartmann et al. (1947), while publishing no specific figure for carbohydrate content, remark that on testing the egg contents with a-naphthol in concentrated sulphuric acid a violet colour, which indicates the presence of carbohydrate, develops only after 2 min. hydrolysis with 30% sulphuric acid. This would seem to support their conclusion 'auch die Kohlenhydrate liegen in gebundener Form vor'.
throughout both blastoderm and yolk. Six days later the glycogen content has fallen to 0-026 mg. per egg. The temperature of incubation is unfortunately not known, even approximately, but since the eggs hatched after 49 days of develop-ment it must be assumed that they developed rather more slowly than the rainbow trout eggs under discussion. Daniel's results would therefore suggest glycogen consumption actually occurring during gastrulation overgrowth.
This present study was undertaken to secure evidence that might be expected to confirm unequivocally whether glycogen or other carbohydrate was consumed during gastrulation. The times of sampling were planned so as to show such a fall in the content of total carbohydrate, samples being analysed immediately before gastrulation began and as soon as gastrulation finished. Yet it was only after gastrulation was complete that a significant fall in total carbohydrate took place. So it must be concluded that the total glycogen consumed during gastrulation is not sufficient to reveal a change in total carbohydrate content by the methods of analysis here employed.
Several points in Daniel's paper are difficult to interpret. The wet weights of the embryo blastoderm show a peculiar history. From an average wet weight of 47 mg. 23 days before hatching the average falls in 8 days to 33 mg. and after a further 9 days it is no more than 34 mg. Eleven days later (2 days after hatching) the average wet weight is still only 53 mg.; after the passage of a further 9 days the wet weight is 45 mg. These figures can only be the result of sampling errors which are very high. While embryonic growth is restricted up to hatching there is no such restriction after hatching, so that the report of an embryo blastoderm slightly smaller 11 days after hatching than it was 23 days before hatching suggests an ab-normal sampling error. Daniel also reports the existence of 'yolk-sac cells' within the syncytial wall. Unless salmon eggs differ significantly from those of trout these 'cells' can only be the emulsified droplets of yolk in process of digestion. Fixation and sectioning for the histochemical determination of glycogen is probably not sufficiently good for any precise interpretation; however, a careful examination of sections of comparable stages of the trout shows droplets as already reported but not any trace of nucleus in the drop as there should be if they are to merit the description 'yolk-sac cell'. Daniel also refers to his failure to confirm Portmann & Metzner's (1929) observation of fusion of liver cells with the yolk-sac syncytium. This may be because his series of samples break off too soon. His failure to observe the short burst of carbohydrate consumption when the change-over occurs in the type of fats catabolized might be attributed to the same cause; on the other hand, this period is brief and the complete cycle of combustion and replacement may have occurred between two of his later samples.
(d) The sequence of energy sources in embryonic development
664 SYDNEY SMITH
In the case of the rainbow trout the analysis of the daily heat production into portions relating to the particular fuel component consumed (Tables 5 and 6) makes it clear that a sequence of peaks of combustion in the use of carbohydrate protein and fat cannot be established for the trout. The metabolic substrates used before hatching cannot be identified with certainty; it has, however, been shown that a fall in the level of carbohydrate is delayed until after the 9th day of incubation at io° C , by which time gastrulation is almost complete under these conditions of incubation. A striking feature of the main growth period, from the 39th to 60th days, is the relatively constant rate of heat production per gram of embryo tissue which may be attributed to the simultaneous combustion of protein and phospha-tide fats. At the end of this phase there is a considerable though short-lived increase in the rate of heat production as glyceride-fat is burnt. Thus, if the energy sources of the sequence be modified to read, first, protein plus phosphatide fat, and secondly, glyceride-fat, these two substrates may be said in a general sense to have successive peaks of maximal consumption.
The consumption of carbohydrate in the earliest phase of development in teleosts could be inferred from the observations of Schlenk (1933), who studied the oxygen and carbon dioxide exchanges of developing trout eggs from fertilization until the 43 rd day of incubation during continuous perfusion in a closed circulatory system. He was somewhat unusually successful both in the fertility of his material and in the complete absence of any mortality. From 36 hr. until the 9th day the respiratory quotient was of the order of i-o, indicating carbohydrate consump-tion ; subsequently values were of the order of 0-7. The glycogen estimaconsump-tions and histochemical study of salmon eggs by Daniel (1947) show that there is a significant consumption of glycogen between the 5th and n t h days of incubation.
stages of metabolism in the embryo fish are concerned in the main with carbo-hydrate, small though the total amount may be. Changes in gross amount of total carbohydrate can be interpreted as a partial breakdown in supplies produced by some slowing of the synthesis of carbohydrate from other sources; and these changes can be correlated as we have seen above with certain periods of difficulty in the life of the developing fish.
Nothing in the present study has been done towards discerning the course of intermediary metabolism in embryonic development of the teleost. That remains a field for future study.
SUMMARY
1. The total carbohydrate content of the trout egg and embryo has been measured. The carbohydrate content falls during three periods: (i) the establish-ment of the blood circulation; (ii) hatching; and (iii) the onset of starvation.
2. The fats extracted by a non-polar solvent (carbon tetrachloride) from egg, embryo and yolk samples show no significant catabolism before hatching. These fats are considered to be glyceride-fats. In the yolk-sac stage such fats are only consumed between the 63rd and 80th days of incubation at io° C.
3. The combustion of phosphatide fat deduced from the heat-production figures is conspicuous during the early stages of yolk-sac absorption, and may be correlated with the consumption of protein as an energy source.
4. These findings may be correlated with histological changes in the yolk-sac wall, and in the relation between yolk-sac and liver. The concept of a sequence of energy sources in ontogenesis is discussed.
REFERENCES
AMBERSON, W. R. & ARMSTRONG, P. B. (1933). The respiratory metabolism oiFundulut heteroclitus during embryonic development. J. Cell. Comp. Pkysiol. a, 381-97.
BAKER, J. R. (1944). The structure and chemical composition of the Golgi element. Quart. J. Micr.
Set. 85, 1-71.
DANIEL, R. J. (1947). Distribution of glycogen in the developing salmon {Salmo solar L.). J. Exp.
Biol. 24, 123-44.
DANIELLI, J. F. & HARVEY, E. N. (1934). The tension at the surface of mackerel egg oil, with remarks on the nature of the cell surface. J. Cell. Comp. Pkysiol. 5, 483-94.
FALK, K. G., NOYES, H. M. & LAUBERBLATT, I. (1927). Studies on enzyme action. XLV. Lipase actions of the whole trout at different ages. J. Gen. Pkytiol. 10, 837-44.
FAURE-FREMTBT, E. & GARRAULT, H. (1922). litude des substances grasses et lipoides de l'ocuf de Truite (Trutta fario). Bull. Soc. Chim. Biol, Paris, 4, 379-87.
HALPBRN, G. R. (1945). Extraction of phospholipids in salmon roe. Nature, Lond., 155, n o .
HARTMANN, M., MEDEM, F. GRAF., KUHN, R. & BIELIG, H.-J. (1947). Untersuchungen Qber die
Befruchtungsstoffe der Regenbogenforelle. Z. Naturf. 36, 330-49.
HARVEY, E. N. & SHAPIRO, H. (1934). The interfacial tension between oil and protoplasm within living cells. J. Cell. Comp. Pkytiol. 5, 255-67.
HAYES, F. R. (1930). The metabolism of developing salmon eggs. (1) The significance of hatching and the role of water in development. Biochem. J. 24, 723-34.
HAYES, F. R. (1930). The metabolism of developing salmon eggs. (2) Chemical changes during development. Biochem. J. 34, 735-45.
HAYES, F. R. & HOLLETT, A. (1940). The carbohydrate metabolism of developing salmon eggs.
Canad. J. Res. 18, Sect. D, 53-65.
666 SYDNEY S M I T H
KUMAOAWA, M. & SUTO, K. (1908). Ein neues Verfahren zur quantitativen Bestimmung des Fettes und der unverseifbaren Substanzen in tierischem Materiel nebst der Kritik einiger gebrSuch-lichen Methoden. Bioch. Z. 8, 212—347.
LAFON, M. (1947). Recherches sur l'utilisation des reserves vitellines au cours de l'erabryog^nese. (1) Donnees sur l'embryon de Truite (Salmo fario et Salmo irideus). Arch. int. Physiol. 55,
123-51.
MCCLENDON, J. F. (1915). On the formation of fats from proteins in the eggs of fish and amphibians. J. Biol. Chem. 21, 269—74.
NEEDHAM, J. (1931). Chemical Embryology. Cambridge University Press.
NEEDHAM, J. (1942). Biochemistry and Morphogenesis. Cambridge University Press.
PHILLIPS, F. S. (1940). Oxygen consumption and its inhibition in the development of Fundulus and various pelagic fish eggs. Biol. Bull. Woods Hole, 78, 256-74.
PORTMANN, A. & METZNER, G. (1929). Die Verbindung von Leber und Dottersack bei
Teleostier-larven. Verb. naUtrf. Ges. Basel. 40, 271—9.
SCHLENK, W. (1933). Kinetik der Oxydationsvorgange in befruchteten Eiern. I. Mitteilung: Geschwindigkeit der Oxydation wfihrend der Embryonalentwicklung von Trutta iridea (Regenbogenforelle). Biochem. Z. 3J&J, 424-37.
SMITH, S. (1947). Studies in the development of the rainbow trout (Salmo irideus). 1. The heat production and nitrogenous excretion. J. Exp. Biol. 23, 357-78.
TANGL, F. & FARKAS, K. (1904). Beitrage zur Energetik der Ontogenese. 4. Uber den Stoff und Energieumsatz im bebrliteten Forellenei. Pfliig. Arch. ges. Physiol. 104, 624-38.