Abstract— The harmony search is considered as musician's behavior which is inspired by soft computing algorithm. As the musicians in improvisation process try to find the best harmony in terms of aesthetics, the decision variables in optimization process try to be the best vector in terms of objective function. Cluster analysis is one of attractive data mining technique that use in many fields. One popular class of data clustering algorithms is the center based clustering algorithm. K-means used as a popular clustering method due to its simplicity and high speed in clustering large datasets. However, k-means has two shortcomings: dependency on the initial state and convergence to local optima and global solutions of large problems cannot found with reasonable amount of computation effort. In order to overcome local optima problem lots of studies done in clustering. This paper describes a new clustering method based on the harmony search (HS) meta-heuristic algorithm, which was conceptualized using the musical process of searching for a perfect state of harmony. The HS algorithm does not require initial values and uses a random search instead of a gradient search, so derivative information is unnecessary. We compared proposed algorithm with other heuristics algorithms in clustering, such as GA, SA, TS, and ACO, by implementing them on several simulation and real datasets. The results indicate that the proposed clustering is a powerful clustering method suggesting higher degree of precision and robustness than the existing algorithms.
Index Terms—clustering, meta-heuristic, k-means, harmony search algorithm.
I. INTRODUCTION
Clustering is one of powerful data mining techniques that can discover intentional structures in data. It groups instances which have similar features and builds a concept hierarchy. As a result, it often extracts new knowledge from a database. Because of the ability to find the intentional descriptions, it is one of the very important techniques in managing databases. Clustering problems arise in many different applications, such as knowledge discovery [1], data compression and
Manuscript received May 9, 2010.
Babak Amiri, is with the University of Sydney. (e-mail: [email protected]).
Liaquat Hossain is with the University of Sydney
Seyyed Esmaeil Mosavi, is with Tarbiat Modaress University,.
vector quantization [2], and pattern recognition and pattern classification [3].
There are many methods applied in clustering analysis, like hierarchical clustering, partition-based clustering, density-based clustering, and artificial intelligence-based clustering. One popular class of data clustering algorithms is the center based clustering algorithm. K-means used as a popular clustering method due to its simplicity and high speed in clustering large datasets [4].
K-means has two shortcomings: dependency on the initial state and convergence to local optima [5] and also global solutions of large problems cannot found with reasonable amount of computation effort [6]. In order to overcome local optima problem lots of studies done in clustering. In these studies researchers used meta heuristic algorithms like, GA [7 and 8], SA [9], TS [10], ACO [11 and 12].
Recently, Geem et al. [13] developed a new harmony search (HS) meta-heuristic algorithm that was conceptualized using the musical process of searching for a perfect state of harmony. The harmony in music is analogous to the optimization solution vector, and the musician's improvisations are analogous to local and global search schemes in optimization techniques. The HS algorithm does not require initial values for the decision variables.
And now this paper presents a new k-means algorithm based on harmony search algorithm. The paper organized as follow: in section 2 we discussed cluster analysis problems. Section 3 introduce harmony search algorithm. In section 4 application of HAS on cluster analysis is presented, and then in section 5 experimental result of proposed clustering algorithm in comparison with other meta heuristics clustering algorithms are shown.
II. CLUSTER ANALYSIS PROBLEM
Clustering in N-dimensional Euclidean space RN is the process of partitioning a given set of n points into a number, say k, of groups (or, clusters) based on some similarity (distance) metric in clustering procedure is Euclidean distance, which derived from the Minkowski metric (equations 1 and 2) [14].
r m
i
r j y i x y x d
1 1
) ,
(
(1)
21
,
m
i j i y
x y x
d (2)
Let the set of n points {X1, X2,…, Xn} be represented by
Application of Harmony Search Algorithm on
Clustering
the set S and the K clusters be represented by C1, C2…,CK.
Then:
. 1
, ..., , 1 , ..., , 1
, ..., , 1
S i C K i and
j i and k j k i for j
C i C
k i for i
C
In this study, we will also use Euclidian metric as a distance metric. K-means is one of the simplest unsupervised learning algorithms that solve the well known clustering problem [15]. The procedure follows a simple and easy way to classify a given data set through a certain number of clusters (assume k clusters) fixed a priori. The main idea is to define k centroids, one for each cluster. These centroids shoud be placed in a cunning way because of different location causes different result. So, the better choice is to place them as much as possible far away from each other. The next step is to take each point belonging to a given data set and associate it to the nearest centroid. When no point is pending, the first step is completed and an early groupage is done. At this point we need to re-calculate k new centroids as barycenters of the clusters resulting from the previous step. After we have these k new centroids, a new binding has to be done between the same data set points and the nearest new centroid. A loop has been generated. As a result of this loop we may notice that the k centroids change their location step by step until no more changes are done. In other words centroids do not move any more.
Finally, this algorithm aims at minimizing an objective function, in this case a squared error function. The objective function
N
i
l
i c l K
x Min C
X f
1
2| 1,..., } ||
{|| )
, (
Where
x
i
c
l 2 is a chosen distance measure between adata point
x
iand the cluster centrec
lis an indicator of thedistance of the n data points from their respective cluster centers.
The algorithm is composed of the following steps:
1. Place K points into the space represented by the objects that are being clustered. These points represent initial group centroids.
2. Assign each object to the group that has the closest centroid.
3. When all objects have been assigned, recalculate the positions of the K centroids.
4. Repeat Steps 2 and 3 until the centroids no longer move. This produces a separation of the objects into groups from which the metric to be minimized can be calculated.
Although it can be proved that the procedure will always terminate, the k-means algorithm does not necessarily find the most optimal configuration, corresponding to the global objective function minimum. The algorithm is also significantly sensitive to the initial randomly selected cluster centers. The k-means algorithm can be run multiple times to reduce this effect. K-means is a simple algorithm that has been adapted to many problem domains.
III. MARMONY SEARCH ALGORITHM
[image:2.595.307.546.235.403.2]Harmony search algorithm is a new algorithm can be conceptualized from a music performance process (say, a jazz improvisation) involving searching for a better harmony. Just like music improvisation seeks a best state (fantastic harmony) determined by aesthetic estimation, optimization process seeks a best state (global optimum) determined by objective function evaluation; Just like aesthetic estimation is determined by the set of the pitches played by ensemble instruments, function evaluation is determined by the set of the values assigned for decision variables; Just like aesthetic sound quality can be improved practice after practice, objective function value can be improved iteration by iteration [13].
Fig. 1: Analogy between improvisation and Optimization [20]
As Figure 1 shows the analogy between improvisation and optimization, each music player (saxophonist, double bassist, and guitarist) can correspond to each decision variable (x1 , x2 , and x3), and the range of each music instrument (saxophone={Do, Re, Mi}; double bass={Mi, Fa, Sol}; and guitar={Sol, La, Si}) corresponds to the range of each variable value (x1={100, 200, 300}; x2={300, 400, 500}; and x3= {500, 600, 700}). If the saxophonist toots the note Do, the double bassist plucks Mi, and the guitarist plucks Sol, their notes together make a new harmony (Do, Mi, Sol). If this New Harmony is better than existing harmony, the New Harmony is kept. Likewise, the new solution vector (100mm, 300mm, 500mm) generated in optimization process is kept if it is better than existing harmony in terms of objective function value. Just as the harmony quality is enhanced practice after practice, the solution quality is enhanced iteration by iteration.
According to the above algorithm concept and the procedure of harmony search shown in Figure 1, the HS algorithm consists of the following steps [16]:
Step 1. Initialize the problem and algorithm parameters. Step 2. Initialize the harmony memory.
IV. APPLICATION OF HARMONY SEARCH ALGORITHM ON CLUSTERING The search capability of HSA algorithm is used in this paper for the purpose of appropriately determining a fixed number of K cluster centers in RN; thereby suitably clustering the set of n unlabelled points the clustering metric that has been adopted is the sum of the Euclidean distance of the points of the points from their respective cluster centers. Based on steps of HSA, the steps of proposed clustering algorithm as shown in figure 2 are as follow: Step 1: Initialize the problem and algorithm parameters
A popular performance function for measuring goodness of the k clustering is the total within-cluster variance or the total mean-square quantization error (MSE), that is specified as follows: Minimize
N n ln
c
l
K
x
Min
C
X
f
12
|
1
,...,
}
||
{||
)
,
(
where f(x,c) is objective function, xn is a data, N is the
number of data, cl is a cluster center and k is number of
clusters, C is the set of each decision variable Cl, C=(C1, C2,
…, Ck)=(c11, c12,…, c1d, c21, c22,…, c2d,…, ck1, ck2,…, ckd),
number of decision variables is
k
d
that k is the number of clusters and d is the number of data dimensions. For exampleC
(
2
,
5
,
1
,
6
,
3
,
2
,
5
,
7
,
4
)
, represents a solution with 3 cluster centers those are C1= (2, 5, 1), C2= (6, 3, 2), C3= (5, 7, 4), that each cluster center has 3 dimensions. Cij isthe set of possible range for each decision variable that is
Lcij<Cij<Ucij that Lci and Uci are the lower and upper bounds
for each decision variable. The HS algorithm parameters are also specified in this step. These are the harmony memory size (HMS), or the number of solution vectors in the harmony memory; harmony memory considering rate (HMCR); pitch adjusting rate (PAR); and the number of improvisations (NI), or stopping criterion.
The harmony memory (HM) is a memory location where all the solution vectors (sets of decision variables) are stored. This HM is similar to the genetic pool in the GA [3]. Here, HMCR and PAR are parameters that are used to improve the solution vector. Both are defined in Step 3. Step 2: Initialize the harmony memory
In Step 2, the HM matrix is filled with as many randomly generated solution vectors as the HMS
HMS kd HMS d k HMS HMS HMS kd HMS d k HMS HMS kd d k kd d kc
c
c
c
c
c
c
c
c
c
c
c
c
c
c
c
) 1 ( 12 11 1 1 ) 1 ( 1 12 1 11 2 2 ) 1 ( 2 12 2 11 1 1 ) 1 ( 1 12 1 11
Step 3: Improvise a new harmony
A new harmony vector ) ( ) ..., , , ,..., ..., , , , ,..., ,
(c11 c12 c1d c21 c22 c2d ck1 ck2 ckd cij c that,
1
i
d
and1
j
k
is generated based on three rules: (1) memory consideration, (2) pitch adjustment and (3) random selection. Generating a new harmony is called ‘improvisation’ [16].In the memory consideration, the value of the first decision variable
(
c
11
)
for the new vector is chosen from any of the values in the specified HM range)
(
111 11HMSc
c
HMS. Values of the other decision variablesً◌
(
c
12
,...,
c
1
d,
c
21
,
c
22
,
...,
c
2d,...,
c
k1,
c
k2,
...,
c
kd)
are chosen in the same manner. The HMCR, which varies between 0 and 1, is the rate of choosing one value from the historical values stored in the HM; while (1-HMCR) is the rate of randomly selecting one value from the possible range of values. ) 1 ( , } ..., , , {1 2HMCR y probabilit with C c HMRCR y probabilit with c c c c c ij ij HMS ij ij ij ij ij (3) For example, a HMCR of 0.85 indicates that the HS algorithm will choose the decision variable value from historically stored values in the HM with an 85% probability or from the entire possible range with a (100– 85)% probability. Every component obtained by the memory consideration is examined to determine whether it should be pitch-adjusted. This operation uses the PAR parameter, which is the rate of pitch adjustment as follows:
) 1 ( , PAR y probabilit with No PAR y probabilit with Yes c for decision adjusting Pitch ij (4) The value of (1 - PAR) sets the rate of doing nothing. If the pitch adjustment decision for
c
ij
is YES,c
ij
is replaced as follow:bw
rand
c
c
ij
ij
()
(5)where bw is an arbitrary distance bandwidth,
rand
()
is a random number between 0 and 1.In Step 3, HM consideration, pitch adjustment or random selection is applied to each variable of the new harmony vector in turn.
Step 4: Update harmony memory
If the new harmony vector,
)
...,
,
,
,...,
...,
,
,
,
,...,
,
(
c
11c
12c
1dc
21c
22c
2dc
k1c
k2c
kdc
is better than the worst harmony in the HM, judged in terms of the objective function value, the new harmony is included in the HM and the existing worst harmony is excluded from the HM.
Step 5: Check stopping criterion
If the stopping criterion (maximum number of improvisations) is satisfied, computation is terminated. Otherwise, Steps 3 and 4 are repeated.
V. EXPERIMENTAL RESULTS
dataset, algorithms performed 10 times individually for their own effectiveness tests, each time with randomly generated initial solutions. We have done our experiments on a Pentium IV, 2.8 GHz, 512 GB RAM computer and we have coded with Matlab 7.1 software. We run all five algorithms on datasets.
A. Artificial data sets
Data 1: This is none overlapping two-dimensional data set where the number of clusters is two. It has 10 points. The value of K is chosen to be 2 for this data set.
Data 2: This is none overlapping two-dimensional data set where the number of clusters is three. It has 76 points. The value of K is chosen to be 3 for this data set.
Data 3: This is an overlapping two-dimensional triangular distribution of data points having nine classes where all the classes are assumed to have equal a priori probabilities (=1/19 ). It has 900 data points. The X-Y ranges for the nine classes are as follows:
Class 1: [-3.3,-0.7] × [0.7, 3.3], Class 2: [-1.3, 1.3] × [0.7, 3.3], Class 3: [0.7, 3.3] × [0.7, 3.3], Class 4: [-3.3,-0.7] × [-1.3, 1.3], Class 5: [-1.3, 1.3] × [-1.3, 1.3], Class 6: [0.7, 3.3] × [-1.3, 1.3], Class 7: [-3.3,-0.7] × [-3.3,-0.7], Class 8: [-1.3, 1.3] × [-3.3,-0.7], Class 9: [0.7, 3.3] × [-3.3,-0.7].
Thus the domain for the triangular distribution for each class and for each axis is 2.6. Consequently, the height will be 1/1.3 (since 12*2.6*height"1). The value of K is chosen to be 9 for this data set.
Data 4: This is an overlapping ten-dimensional data set generated using a triangular distribution of the form shown in Fig. 3 for two classes, 1 and 2. It has 1000 data points. The value of K is chosen to be 2 for this data set. The range for class 1 is [0, 2] × [0, 2] × [0, 2]…10 times, and that for class 2 is [1, 3] × [0, 2] × [0, 2]…9 times, with the corresponding peaks at (1, 1) and (2, 1). The distribution along the first axis (X) for class 1 may be formally quantified as:
.
2
0
,
2
1
2
,
1
0
,
0
0
)
(
1x
for
x
for
x
x
for
x
x
for
x
f
for class 1. Similarly for class 2
.
3
0
,
3
2
3
,
2
1
1
,
1
0
)
(
1x
for
x
for
x
x
for
x
x
for
x
f
The distribution along the other nine axes (Yi, i=1, 2… 9)
for both the classes is
.
2
0
,
2
1
2
,
1
0
,
0
0
)
(
1
i i i
i i
i
y
for
y
for
y
y
for
y
y
for
[image:4.595.311.542.49.292.2]x
f
Figure 3. Triangular distribution along the X-axis B. Real-life data sets
Vowel data: This data consists of 871 Indian Telugu vowel sounds [17]. These were uttered in a consonant-vowel-consonant context by three male speakers in the age group of 30-35 years. The data set has three features F1, F2 and F3, corresponding to the first, second and third vowel formant frequencies, and six overlapping classes {, a, i, u, e, o}. The value of K is therefore chosen to be 6 for this data.
Iris data: This is the Iris data set, which is perhaps the best-known database to found in the pattern recognition literature. Fisher’s paper is a classic in the field and referenced frequently to this day. The data set contains three classes of 50 instances each, where each class refers to a type of iris plant. One class is linearly separable from the other 2; the latter are not linearly separable from each other. There are 150 instances with four numeric attributes in iris data set. There is no missing attribute value. The attributes of the iris data set are; sepal length in cm, sepal width in cm, petal length in cm and petal width in cm [18].
Crude oil data: This overlapping data [19] has 56 data points, 5 features and 3 classes. Hence the value of K is chosen to be 3 for this data set.
Wine data: This is the wine data set, which also taken from MCI laboratory. These data are the results of a chemical analysis of wines grown in the same region in Italy but derived from three different cultivars. The analysis determined the quantities of 13 constituents found in each of the three types of wines. There are 178 instances with 13 numeric attributes in wine data set. All attributes are continuous. There is no missing attribute value.
Thyroid diseases data: This dataset categories N = 215 samples of patients suffering from three human thyroid diseases, K=3 as: euthyroid, hyperthyroidism, and hypothyroidism patients where 150 individuals are tested euthyroid thyroid, 30 patients are experienced hyperthyroidism thyroid while 35 patients are suffered by hypothyroidism thyroid. Each individual was characterized by the result of five, n =5 laboratory tests as: total serum thyroxin, total serum iodothyronine, serum
tri-0 tri-0.5 1 1.5 2 2.5 3
0.5
f(x)
1
x
iodothyronine resin uptake, serum thyroid-stimulating hormone (TSH), and increase TSH after injection of TSH-releasing hormone [18].
The comparison of results for each dataset based on the bet solution found in 10 distinct runs of each algorithm and the convergence processing time taken to attain the best solution. The solution quality is also given in terms of the average and worst values of the clustering metric (Favg, Fworst, respectively) after 10 different runs for each of the five algorithms. F is the performance of clustering method that illustrated in equation 3. Tables 1–9 show these results. Table 1. Result obtained by the five algorithms for 10 different runs on dataset 1
Method Function Value CPU
time (s) Fbest Faverage Fworst
HSAK 3,120321 3,130807 3,225182 1.74 ACO 3,142375 3,163422 3,352843 1.89
GA 3,273426 3,355521 3,683901 2.01
TS 3,244326 3,310024 3,572814 1.92
SA 3,217832 3,282089 3,539115 1.99
Table 2. Result obtained by the five algorithms for 10 different runs on dataset 2
Method Function Value CPU
time (s) Fbest Faverage Fworst
HSAK 51.427326 51.447066 51.624728 8.23 ACO 52.082746 52.212071 52.729373 8.98 GA 56.142562 56.377520 57.317354 17.24 TS 54.752946 54.879342 55.384927 14.57 SA 53.562492 53.635943 53.929748 14.82
Table 3. Result obtained by the five algorithms for 10 different runs on dataset 3
Method Function Value CPU
time (s) Fbest Faverage Fworst
HSAK 961.524871 961.682520 963.101361 25.98 ACO 964.739472 965.048327 966.283745 26.88 GA 966.649837 966.772302 966.853946 38.52 TS 972.629478 973.209275 975.528463 32.78 SA 966.418263 966.614089 967.397392 31.24
Table 4. Result obtained by the five algorithms for 10 different runs on dataset 4
Method Function Value CPU
time (s)
Fbest Faverage Fworst
[image:5.595.299.556.77.150.2]HSAK 1246.264515 1246.318181 1246.801172 121.56 ACO 1248.958685 1249.034036 1249.335442 122.34 GA 1258.673362 1520.777767 1271.635528 178.42 TS 1282.538294 1285.988483 1299.789237 142.15 SA 1249.736287 1249.968105 1250.895375 136.61
Table 5. Result obtained by the five algorithms for 10 different runs on Vowel data
Method Function Value CPU
time (s)
Fbest Faverage Fworst
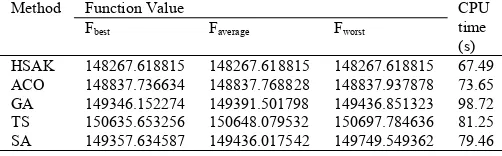
HSAK 148267.618815 148267.618815 148267.618815 67.49 ACO 148837.736634 148837.768828 148837.937878 73.65 GA 149346.152274 149391.501798 149436.851323 98.72 TS 150635.653256 150648.079532 150697.784636 81.25 SA 149357.634587 149436.017542 149749.549362 79.46
Table 6. Result obtained by the five algorithms for 10 different runs on Iris data
Method Function Value CPU
time (s) Fbest Faverage Fworst
HSAK 96.001255 96.001255 96.001255 32.21 ACO 97.100777 97.171546 97.808466 33.72 GA 113.986503 125.197025 139.778272 105.53 TS 97.365977 97.868008 98.569485 72.86 SA 97.100777 97.134625 97.263845 95.92
Table 7. Result obtained by the five algorithms for 10 different runs on Crude oil data
Method Function Value CPU
time (s) Fbest Faverage Fworst
HSAK 250.327045 250.545712 252.513712 14.26 ACO 253.564637 254.180897 256.645938 14.98 GA 278.965152 279.907029 283.674535 35.26 TS 254.645375 255.422953 258.533264 26.55 SA 253.763548 254.653208 258.211847 24.74
Table 8. Result obtained by the five algorithms for 10 different runs on Wine data
Method Function Value CPU
time (s)
Fbest Faverage Fworst
HSAK 16239.202351 16239.202351 16239.202351 53.17 ACO 16530.533807 16530.533807 16530.533807 68.29 GA 16530.533807 16530.533807 16530.533807 226.68 TS 16666.226987 16785.459275 16837.535670 161.45 SA 16530.533807 16530.533807 16530.533807 57.28
Table 9. Result obtained by the five algorithms for 10 different runs on Thyroid data
Method Function Value CPU time
(s)
Fbest Faverage Fworst
HSAK 10081.725461 10081.725461 10081.725461 95.41 ACO 10111.827759 10112.126903 10114.819200 102.15 GA 10116.294861 10128.823145 10148.389608 153.24 TS 10249.729170 10354.315021 10438.780449 114.01 SA 10111.827759 10114.045265 10115.934358 108.22
For Dataset 1 (Table 1) it is found that the HSAK clustering algorithm provides the optimal vale of 3,120321 in 90% of the total runs that is better than other clustering algorithms. The ACO clustering algorithm found value of 3,142375 in 90% of runs and GA, TS, and SA found values of 3,273426, 3,244326, and 3,217832 in 80% of runs. The HSAK required the least processing time (1.74). For Data 2 (Table 2) the HSA clustering algorithm attains the best value of 51.427326 in 90% of the total runs.
[image:5.595.41.292.651.729.2]For Vowel Data, (Table 5) the HSA clustering algorithm attains the best value of 148267.618815 in all of runs. ACO, TS, and SA provided the best values in 80% of runs and the GA algorithm attains the best value only in 50% of total runs. In addition the HSA clustering algorithm performed better than other algorithms in term of the processing time required (67.49). For clustering problem, on iris dataset results given in Table 6, show that the HSAK provide the optimum value of 96.001263, the ACO and SA methods obtain 97.100777. The HSAK was able to find the optimum 10 times as compared to that of nine times obtained by ACO and five times obtained by SA. The HSAK required the least processing time (32.21). For Crude Oil data set, the HSA clustering algorithm attains the best value of 250.327045 in 90% of total runs and ACO, GA, TS, and SA attain the best value of 253.564637, 278,965152, 254.645375, and 253.763548 in 80% of total runs. The processing time required by HSA is less than other algorithms (14.26).
The result obtained for the clustering problem, Wine dataset given in Table 8. The HSAK find the optimum solution of 16239.202351 and the ACO, SA and GA methods provide 16530.533807. The HSAK, ACO, SA and GA methods found the optimum solution in all their 10 runs. The execution time taken by the HSAK algorithm is less than other algorithms.
The HSAK algorithm for the human thyroid disease dataset, provide the optimum solution of 10093.118364 to this problem with success rate of 100% during 10 runs. In term of the processing time the HSAK performed better than other clustering algorithms as can observed from Table 9.
Shelokar et al [12] performed several simulations to find the algorithmic parameters that result into the best performance of ACO, GA, SA and TS algorithms in terms of the equality of solution found, the function evaluations and the processing time required. In this study, we used their algorithmic parameters. In addition, we performed several simulations to find the algorithmic parameters for HSAK algorithm.
The result illustrate that the proposed HSAK optimization approach can be considered as a viable and an efficient heuristic to find optimal or near optimal solutions to clustering problems of allocating N objects to k clusters.
VI. CONCLUSION
In summary, in this paper a new clustering algorithm is presented based on the recently developed HS meta-heuristic algorithm that it was conceptualized using the musical process of searching for a perfect state of harmony. Proposed algorithm has several advantages when compared with other optimization techniques, it does not require complex calculus, thus it is free from divergence and proposed algorithm does not require initial value settings for the decision variables, thus it may escape local optima. The harmony search algorithm for data clustering can be apply when the number of clusters is known a priori and is crisp in nature. To evaluate the performance of the HSA algorithm, it compared with other stochastic algorithms viz. ant colony, genetic algorithm, simulated annealing and tabu search. The algorithm implemented and tested on several simulation and real datasets; preliminary computational experience is very
encouraging in terms of the quality of solution found and the processing time required. Thus proposed algorithm can be considered as a viable and an efficient heuristic to find optimal or near optimal solutions of clustering problems.
REFERENCES
[1] U.M. Fayyad, G. Piatetsky-Shapiro, P. Smyth, and R. Uthurusamy, Advances in Knowledge Discovery and Data Mining. AAAI/MIT Press, 1996.
[2] A. Gersho and R.M. Gray, Vector Quantization and Signal Compression. Boston: Kluwer Academic, 1992.
[3] R.O. Duda and P.E. Hart, Pattern Classification and Scene Analysis. New York: John Wiley & Sons, 1973.
[4] E.W. Forgy, Cluster analysis of multivariate data: Efficiency versus interpretability of classifications, Biometrics 21 (3) (1965) 768–769. [5] S.Z. Selim, M.A. Ismail, K-means type algorithms: a generalized
convergence theorem and characterization of local optimality, IEEE Trans. Pattern Anal. Mach. Intell. 6 (1984) 81}87.
[6] H. Spath, Clustering Analysis Algorithms, Ellis Horwood, Chichester, UK, 1989.
[7] Ujjwal Mualik, Sanghamitra Bandyopadhyay, genetic algorithm-based clustering technique, pattern Recognition, 33 (2000) 1455-1465. [8] K. Krishna, Murty, genetic k-means Algorithm, IEEE Transaction on
Systems, man, and Cybernetics-Part B: Cybernetics 29 (1999), 433-439 [9] Shokri Z. Selim and K. Al-Sultan, A Simulated Annealing Algorithm
for the Clustering problem, Pattern Recognition, Volume 24, Issue 10, 1991, Pages 1003-1008.
[10] C.S. Sung, H.W. Jin, A tabu-search-based heuristic for clustering, Pattern Recognition, Volume 33, 2000, Pages 849-858.
[11] R. I. kuo, H. S. Wang, Tung-Lai Hu, S. H. Chou, Application of Ant K-Means on Clustering Analysis, Computers and Mathematics with Applications 50 (2005) 1709-1724.
[12] P.S. Shelokar, V.K. Jayaraman, B.D. Kulkarni, An ant colony approach for clustering, Analytica Chimica Acta 509 (2004) 187–195. [13] Geem ZW, Kim JH, Loganathan GV. A new heuristic optimization
algorithm: harmony search. Simulation 2001;76 (2):60–8. [14] Zulal Gungor, Alper Unler, K-harmonic means data clustering with
simulated annealing heuristic, Applied Mathematics and Computation, 2006.
[15] R.A. Johnson, D.W. Wichern, Applied Multivariate Statistical Analysis, Prentice-Hall, Englewood Cli!s, NJ, 1982.
[16] K.S. Lee, Z.W. Geem, A new meta-heuristic algorithm for continues engineering optimization: harmony search theory and practice, Comput. Meth. Appl. Mech. Eng. 194 (2004) 3902–3933.
[17] S.K. Pal, D.D. Majumder, Fuzzy sets and decision making approaches in vowel and speaker recognition, IEEE Trans. Systems, Man Cybernet. SMC-7 (1977) 625}629.
[18] C.L. Blake, C.J. Merz, UCI repository of machine learning databases. Available from:
<http://www.ics.uci.edu/_mlearn/MLRepository.html>. [19] R.A. Johnson, D.W. Wichern, Applied Multivariate Statistical
Analysis, Prentice-Hall, Englewood Cli!s, NJ, 1982.
![Fig. 1: Analogy between improvisation and Optimization [20]](https://thumb-us.123doks.com/thumbv2/123dok_us/1297641.659180/2.595.307.546.235.403/fig-analogy-improvisation-optimization.webp)