171
Discovering User Groups for Natural Language Generation
Nikos Engonopoulos and Christoph Teichmann and Alexander Koller Saarland University
{nikos|cteichmann|koller}@coli.uni-saarland.de
Abstract
We present a model which predicts how individual users of a dialog system under-stand and produce utterances based on user groups. In contrast to previous work, these user groups are not specified beforehand, but learned in training. We evaluate on two referring expression (RE) generation tasks; our experiments show that our model can identify user groups and learn how to most effectively talk to them, and can dynam-ically assign unseen users to the correct groups as they interact with the system.
1 Introduction
People vary widely both in their linguistic prefer-ences when producing language and in their abil-ity to understand specific natural-language expres-sions, depending on what they know about the do-main, their age and cognitive capacity, and many other factors. It has long been recognized that ef-fective NLG systems should thereforeadaptto the current user, in order to generate language which works well for them. This adaptation needs to address all levels of the NLG pipeline, including discourse planning (Paris, 1988), sentence plan-ning (Walker et al.,2007), and RE generation ( Ja-narthanam and Lemon, 2014), and depends on many features of the user, including level of ex-pertise and language proficiency, age, and gender.
Existing techniques for adapting the output of an NLG system have shortcomings which limit their practical usefulness. Some systems need user-specific information in training (Ferreira and Paraboni,2014) and therefore cannot generalize to unseen users. Other systems assume that each user in the training data is annotated with their group, which allows them to learn a model from the data of each group. However, hand-designed user groups
may not reflect the true variability of the data, and may therefore inhibit the system’s ability to flexibly adapt to new users.
In this paper, we present a user adaptation model for NLG systems which induces user groups from training data in which these groups were not anno-tated. At training time, we probabilistically assign users to groups and learn the language preferences for each group. At evaluation time, we assume that our system has a chance to interact with each new user repeatedly – e.g., in the context of a dia-logue system. It will then calculate an increasingly accurate estimate of the user’s group membership based on observable behavior, and use it to gen-erate utterances that are suitable to the user’s true group.
We evaluate our model on two tasks involving the generation of referring expressions (RE). First, we predict the use of spatial relations in human-like REs in the GRE3D domain (Viethen and Dale,
2010) using a log-linear production model in the spirit ofFerreira and Paraboni(2014). Second, we predict the comprehension of generated REs, in a synthetic dataset based on data from the GIVE Challenge domain (Striegnitz et al.,2011) with the log-linear comprehension model ofEngonopoulos et al.(2013). In both cases, we show that our model discovers user groups in the training data and in-fers the group of unseen users with high confidence after only a few interactions during testing. In the GRE3D domain, our system outperformed a strong baseline which used demographic information for the users.
2 Related Work
2012); or language proficiency (Koller et al.,2010).
Individual differences are also reflected in the way people produce language. Viethen and Dale
(2008) present a corpus study of human-produced REs (GRE3D3) for simple visual scenes, where they note two clearly distinguishable groups of speakers, one that always uses a spatial relation and one that never does. Ferreira and Paraboni
(2014) show that a model using speaker-specific information outperforms a generic model in predict-ing the attributes used by a speaker when producpredict-ing an RE. However, their system needs to have seen the particular speaker in training, while our system can dynamically adapt to unseen users. Ferreira and Paraboni(2017) also demonstrate that splitting speakers in predefined groups and training each group separately improves the human likeness of REs compared to training individual user models.
The ability to adapt to the comprehension and production preferences of a user is especially im-portant in the context of a dialog system, where there are multiple chances of interacting with the same user. Some methods adapt to dialog system users by explicitly modeling the users’ knowledge state. An early example isParis(1988); she selects a discourse plan for a user, depending on their level of domain knowledge ranging between novice and expert, but provides no mechanism for inferring the group to which the user belongs.Rosenblum and Moore(1993) try to infer what knowledge a user possesses during dialogue, based on the questions they ask. Janarthanam and Lemon(2014) adapt to unseen users by using reinforcement learning with simulated users to make a system able to ad-just to the level of the user’s knowledge. They use five predefined groups from which they generate the simulated users’ behavior, but do not assign real users to these groups. Our system makes no assumptions about the user’s knowledge and does not need to train with simulated users, or use any kind of information-seeking moves; we instead rely on the groups that are discovered in training and dynamically assign new, unseen users, based only on their observable behavior in the dialog.
Another example of a user-adapting dialog com-ponent is SPaRKy (Walker et al.,2007), a trainable sentence planner that can tailor sentence plans to individual users’ preferences. This requires train-ing on separate data for each user; in contrast to this, we leverage the similarities between users and can take advantage of the full training data.
3 Log-linear models for NLG in dialog
We start with a basic model of the way in which people produce and comprehend language. In order to generalize over production and comprehension, we will simply say that a human language user exhibits a certainbehaviorbamong a range of pos-sible behaviors, in response to astimuluss. The behavior of a speaker is the utterancebthey pro-duce in order to achieve a communicative goals; the behavior of a listener is the meaningbwhich they assign to the utterancesthey hear.
Given this terminology, we define a basic log-linear model (Berger et al.,1996) of language use as follows:
P(b|s;ρ) = Pexp(ρ·φ(b, s))
b0exp(ρ·φ(b0, s))
(1)
whereρis a real-valued parameter vector of length
nandφ(b, s)is a vector of real-valuedfeature func-tionsf1, ..., fnover behaviors and stimuli. The
pa-rameters can be trained by maximum-likelihood estimation from a corpus of observations(b, s). In addition to maximum-likelihood training it is pos-sible to include some prior probability distribution, which expresses our belief about the probability of any parameter vector and which is generally used for regularization. The latter case is referred to asa posterioritraining, which selects the value ofρthat maximizes the product of the parameter probability and the probability of the data.
In this paper, we focus on the use of such models in the context of the NLG module of a dialogue system, and more specifically on the generation of referring expressions (REs). Using (1) as a compre-hensionmodel,Engonopoulos et al.(2013) devel-oped an RE generation model in which the stimulus
s= (r, c)consists of an RErand a visual context
cof the GIVE Challenge (Striegnitz et al.,2011), as illustrated in Fig.1. The behavior is the objectbin the visual scene to which the user will resolve the RE. Thus for instance, when we consider the RE
r =“the blue button” in the context of Fig.1, the log-linear model may assign a higher probability to the button on the right than to the one in the back-ground.Engonopoulos and Koller(2014) develop an algorithm for generating the RErwhich maxi-mizesP(b∗|s;ρ), whereb∗is the intended referent in this setting.
Figure 1: A visual scene and a system-generated instruction from the GIVE challenge.
the visual contextc, and the behaviorbis the RE. We followFerreira and Paraboni(2014) in training individual models for the different attributes which can be used in the RE (e.g., thatais a button; that it is blue; that the RE contains a binary relation such as “to the right of”), such that we can simply representbas a binary choiceb∈ {1,−1}between whether a particular attribute should be used in the RE or not. We can then implement an analog of Ferreira’s model in terms of (1) by using feature functionsφ(b, a, c) = b·φ0(a, c), whereφ0(a, c)
corresponds to theircontextfeatures, which do not capture any speaker-specific information.
4 Log-linear models with user groups
As discussed above, a user-agnostic model such as (1) does not do justice to the variability of lan-guage comprehension and production across dif-ferent speakers and listeners. We will therefore extend it to a model which distinguishes different
user groups. We will not try to model why1users behave differently. Instead our model sorts users into groups simply based on the way in which they respond to stimuli, in the sense of Section3, and implements this by giving each group g its own parameter vector ρ(g). As a theoretical example, Group 1 might contain users who reliably compre-hend REs which use colors (“the green button”), whereas Group 2 might contain users who more easily understand relational REs (“the button next to the lamp”). These groups are then discovered at training time.
When our trained NLG system starts interacting with an unseen user u, it will infer the group to whichubelongs based onu’s observed responses to previous stimuli. Thus as the dialogue withu
unfolds, the system will have an increasingly
pre-1E.g., in the sense of explicitly modeling sociolects or the
difference between novice system users vs. experts.
σ(π) σ(ρ)
π ρ(g)
g
b(d) s(d)
1≤g≤K
[image:3.595.353.481.65.217.2]u∈U d∈D(u)
Figure 2: Plate diagram for the user group model.
cise estimate of the group to whichubelongs, and will thus be able to generate language which is increasingly well-tailored to this particular user.
4.1 Generative story
We assume training dataD={(bi, si, ui)}iwhich
contains stimulisitogether with the behaviorsbi
which the usersuiexhibited in response tosi. We
writeD(u)={(bu
1, su1), . . .(buN, suN)}for the data
points for each useru.
The generative story we use is illustrated in Fig.2; observable variables are shaded gray, unob-served variables and parameters to be set in training are shaded white and externally set hyperparame-ters have no circle around them. Arrows indicate which variables and parameters influence the prob-ability distribution of other variables.
We assume that each user belongs to a group
g ∈ {1, . . . , K}, where the numberK of groups is fixed beforehand based on, e.g., held out data. A group g is assigned to u at random from the distribution
P(g|π) = exp(πg) PK
g0=1exp(πg0)
(2)
Hereπ ∈RKis a vector of weights, which defines
how probable each group is a-priori.
We replace the single parameter vectorρof (1) with group-specific parameters vectorsρ(g), thus obtaining a potentially different log-linear model
P b|s;ρ(g) for each group. After assigning a group, our model generates responsesbu1, . . . , buN at random fromP b|s;ρ(g)
, based on the group spe-cific parameter vector and the stimulisu
1, . . . , suN.
This accounts for the generation of the data. We model the parameter vectorsπ ∈RK, and
P(D;θ) =
Y
u∈U K
X
g=1
P(g|π)· Y
d∈D(u)
Pbd|sd;ρ(g)
· N
π|0, σ(π)·
K
Y
g=1
N ρ(g)|0, σ(ρ)
(3)
L(θ) = X
u∈U
log
K
X
g=1
P(g|π)· Y
d∈D(u)
P
bd|sd;ρ(g)
(4)
AL(θ) = X
u∈U K X g=1 P
g|D(u);θ(i−1)
·
logP(g|π) + X
d∈Du
logP
bd|sd;ρ(g)
(5)
normal distributions N(0, σ(π)), and N(0, σ(ρ)), which are centered at0with externally given vari-ances and no covariance between parameters. This has the effect of making parameter choices close to zero more probable. Consequently, our models are unlikely to contain large weights for features that only occurred a few times or which are only helpful for a few examples. This should reduce the risk of overfitting the training set.
The equation for the full probability of the data and a specific parameter setting is given in (3). The left bracket contains the likelihood of the data, while the right bracket contains the prior probabil-ity of the parameters.
4.2 Predicting user behavior
Once we have set values θ = (π, ρ(1), . . . , ρ(K))
for all the parameters, we want to predict what behaviorb a useru will exhibit in response to a stimuluss. If we encounter a completely new user
u, the prior user group distribution from (2) gives the probability that this user belongs to each group. We combine this with the group-specific log-linear behavior models to obtain the distribution:
P(b|s;θ) =
K
X
g=1
P
b|s;ρ(g)
·P(g|π) (6)
Thus, we have a group-aware replacement for (1). Furthermore, in the interactive setting of a dia-logue system, we may have multiple opportunities to interact with the same useru. We can then de-velop a more precise estimate ofu’s group based on their responses to previous stimuli. Say that we have made the previous observations D(u) = {hs1, b1i, . . . ,hsN, bNi}for useru. Then we can
use Bayes’ theorem to calculate a posterior esti-mate foru’s group membership:
P
g|D(u);θ
∝P
D(u)|ρ(g)
·P(g|π) (7)
This posterior balances whether a group is likely in general against whether members of that group behave as u does. We can use Pu(g) =
P g|D(u);θ as our new estimate for the group membership probabilities for u and replace (6) with:
Pb|s, D(u);θ=
K
X
g=1
Pb|s;ρ(g)·Pu(g) (8)
for the next interaction withu.
An NLG system can therefore adapt to each new user over time. Before the first interaction withu, it has no specific information aboutuand modelsu’s behavior based on (6). As the system interacts with
urepeatedly, it collects observationsD(u)aboutu’s behavior. This allows it to calculate an increasingly accurate posteriorPu(g) = P g|D(u);θ
ofu’s group membership, and thus generate utterances which are more and more suitable touusing (8).
5 Training
So far we have not discussed how to find settings for the parametersθ = π, ρ(1), . . . , ρ(K), which define our probability model. The key challenge for training is the fact that we want to be able to train while treating the assignment of users to groups as unobserved.
We will use a maximuma posteriori estimate forθ, i.e., the setting which maximizes (3) when
Dis our training set. We will first discuss how to pick parameters to maximize only the left part of (3), i.e., the data likelihood, since this is the part that involves unobserved variables. We will then discuss handling the parameter prior in section5.2.
5.1 Expectation Maximization
models, under the conditions that all relevant vari-ables are observed in the training data. If group assignments were given, gradient computations, and therefore gradient based maximization, would be straightforward for our model. One algorithm specifically designed to solve maximization prob-lems with unknown variables by reducing them to the case where all variables are observed, is the expectation maximization (EM) algorithm (Neal and Hinton,1999). Instead of maximizing the data likelihood from (3) directly, EM equivalently max-imizes the log-likelihood, given in (4). It helps us deal with unobserved variables by introducing “pseudo-observations” based on the expected
fre-quency of the unobserved variables.
EM is an iterative algorithm which produces a sequence of parameter settingsθ(1), . . . , θ(n). Each will achieve a larger value for (4). Each new set-ting is generated in two steps: (1) an lower bound on the log-likelhood is generate and (2) the new parameter setting is found by optimizing this lower bound. To find the lower bound we compute the probability for every possible value the unobserved variables could have had, based on the observed variables and the parameter settingθ(i−1)from the last iteration step. Then the lower bound essentially assumes that each assignment was seen with a fre-quency equal to these probabilities - these are the “pseudo-observations”.
In our model the unobserved variables are the assignments of users to groups. The probability of seeing each useruassigned to a group, given all the dataD(u)and the model parameters from the last iterationθ(i−1), is simply the posterior group membership probability P g|D(u);θ(i−1)
. The lower bound is then given by (5). This is the sum of the log probabilities of the data points under each group model, weighted byP g|D(u);θ(i−1)
. We can now use gradient descent techniques to optimize this lower bound.
5.1.1 Maximizing the Lower Bound
To fully implement EM we need a way to maximize (5). This can be achieved with gradient based meth-ods such as L-BFGS (Nocedal and Wright,2006). Here the gradient refers to the vector of all partial derivatives of the function with respect to each di-mension ofθ. We therefore need to calculate these partial derivatives.
There are existing implementations of the gradi-ent computations our base model such as in En-gonopoulos et al. (2013). The gradients of (5)
for each of the ρ(g) is simply the gradient for the base model on each datapointdweighted by
P g|D(u);θ(i−1)
ifd∈Du, i.e., the probability
that the userufrom which the datapoint originates belongs to groupg. We can therefore compute the gradients needed for eachρ(g)by using implemen-tations developed for the base model.
We also need gradients for the parameters inπ, which are only used in our extended model. We can use the rules for computing derivatives to find, for each dimensiong:
∂U L(θ)
∂πg
=X
u∈U
Pu(g)−
exp (πg)
PK
g0=1exp πg0
wherePu(g) =P g|D(u);θ(i−1)
. Using these gradients we can use L-BFGS to maximize the lower bound and implement the EM iteration.
5.2 Handling the Parameter Prior
So far we have discussed maximization only for the likelihood without accounting for the prior prob-abilities for every parameter. To obtain our full training objective we add the log of the right hand side of (3):
log
N
π|0, σ(π)·
K
Y
g=1
N ρ(g)|0, σ(ρ)
i.e., the parameter prior, to (4) and (5). The gradi-ent contribution from these priors can be computed with standard techniques.
5.3 Training Iteration
We can now implement an EM loop, which maxi-mizes (3) as follows: we randomly pick an initial valueθ(0)for all parameters. Then we repeatedly compute theP g|D(u);θ(i−1)
Hinton,1999) and this has the advantage that we do not spend time trying to find a θ(i) which is a good fit for the likely poor group assignments
P g|D(u);θ(i−1)
we obtain from early parameter estimates.
6 Evaluation
Our model can be used in any component of a di-alog system for which a prediction of the user’s behavior is needed. In this work, we evaluate it in two NLG-related prediction tasks: RE production and RE comprehension. In both cases we evaluate the ability of our model to predict the user’s be-havior given a stimulus. We expect our user-group model to gradually improve its prediction accuracy compared to a generic baseline without user groups as it sees more observations from a given user.
In all experiments described below we set the prior variancesσγ= 1.0andσπ = 0.3after trying
out values between 0.1 and 10 on the training data of the comprehension experiment.
6.1 RE production
Task The task of RE generation can be split in two steps:attribute selection, the selection of the visual attributes to be used in the RE such as color, size, relation to other objects and surface real-ization, the generation of a full natural language expression. We focus here on attribute selection: given a visual scene and a target object, we want to predict the set of attributes of the target object that a human speaker would use in order to describe it. Here we treat attribute selection in terms of individual classification decisions on whether to use each attribute, as described in Section3. More specifically, we focus on predicting whether the speaker will use aspatial relationto another object (“landmark”). Our motivation for choosing this attribute stems from the fact that previous authors (Viethen and Dale, 2008; Ferreira and Paraboni,
2014) have found substantial variation between dif-ferent users with respect to their preference towards using spatial relations.
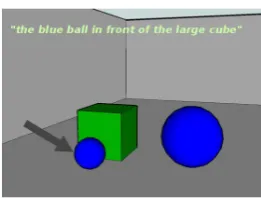
[image:6.595.349.480.59.158.2]Data We use the GRE3D3 dataset of human-produced REs (Viethen and Dale, 2010), which contains 630 descriptions for 10 scenes collected from 63 users, each describing the same target ob-ject in each scene.35%of the descriptions in this corpus use a spatial relation. An example of such a scene can be seen in Fig.3.
Figure 3: A sample scene with a human-produced RE from the GRE3D3 dataset.
Models We use two baselines for comparison:
Basic: The state-of-the-art model on this task with this dataset, under the assumption that users are seen in training, is presented inFerreira and Paraboni(2014). They define context features such as type of relation between the target object and its landmark, number of object of the same color or size, etc., then train an SVM classifier to predict the use of each attribute. We recast their model in terms of a log-linear model with the same features, to make it fit with the setup of Section3.
Basic++:Ferreira and Paraboni(2014) also take speaker features into account. We do not use speaker identity and the speaker’s attribute fre-quency vector, because we only evaluate on unseen users. We do use their other speaker features (age, gender), together withBasic’s context features; this gives us a strong baseline which is aware of manu-ally annotated user group characteristics.
We compare these baselines to ourGroupmodel for values ofKbetween 1 and 10, using the exact same features asBasic. We do not use the speaker features ofBasic++, because we do not want to rely on manually annotated groups. Note that our results are not directly comparable with those of
Ferreira and Paraboni(2014), because of a different training-test split: their model requires having seen speakers in training, while we explicitly want to test our model’s ability to generalize to unseen users.
Experimental setup We evaluate using
Figure 4: F1 scores on test data for values ofK
between1and10in the production experiment.
actual observation from the corpus to the setD(u) of observations for this particular user, in order to update our estimate about their group membership.
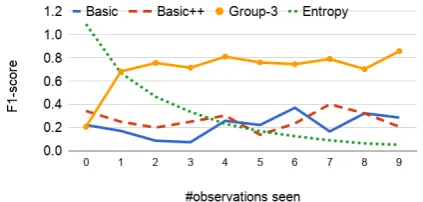
Results Figure4shows the test F1-score
(micro-averaged over all folds) as we increase the num-ber of groups, compared to the baselines. For our
Group models, these are averaged over all inter-actions with the user. Our model gets F1-scores between0.69and0.76for all values ofK >1, out-performing bothBasic(0.22) andBasic++(0.23). In order to take a closer look at our model’s be-havior, we also show the accuracy of our model as it observes more instances at test time. We com-pare the model withK= 3groups against the two baselines. Figure5shows that the group model’s F1-score increases dramatically after the first two observations and then stays high throughout the test phase, always outperforming both baselines by at least 0.37 F1-score points after the first ob-servation. The baseline models of course are not expected to improve with time; fluctuations are due to differences between the visual scenes. In the same figure, we plot the evolution of the entropy of the group model’s posterior distribution over the groups (see (7)). As expected, the model is highly uncertain at the beginning of the test phase about which group the user belongs to, then gets more and more certain as the setD(u)of observations from that user grows.
6.2 RE comprehension
Task Our next task is to predict the referent to which a user will resolve an RE in the context of a visual scene. Our model is given a stimulus
s= (r, c)consisting of an instruction containing an RErand a visual contextcand outputs a probabil-ity distribution over all possible referentsb. Such a model can be used by a probabilistic RE generator to select an RE which is highly likely to be cor-rectly understood by the user or predict potential
Figure 5: F1-score evolution with increasing num-ber of observations from the user in the production experiment.
misunderstandings (see Section3).
Data We use the GIVE-2.5 corpus for training and the GIVE-2 corpus for testing our model (the same used byEngonopoulos et al.(2013)). These contain recorded observations of dialog systems giving instructions to users who play a game in a 3D environment. Each instruction contains an RE
r, which is recorded in the data together with the vi-sual contextcat the time the instruction was given. The objectbwhich the user understood as the ref-erent of the RE is inferred by the immediately sub-sequent action of the user. In total, we extracted 2927 observations by 403 users from GIVE-25 and 5074 observations by 563 users from GIVE-2.
Experimental setup We follow the training
method described in Section3. At test time, we present the observations from each user in the or-der they occur in the test data; for each stimulus, we ask our models to predict the referentawhich the user understood to be the referent of the RE, and compare with the recorded observation. We subsequently add the recorded observation to the dataset for the user and continue.
Models As a baseline, we use theBasicmodel
described in Section 3, with the features of the “semantic” model ofEngonopoulos et al. (2013). Those features capture information about the ob-jects in the visual scene (e.g. salience) and some basic semantic properties of the RE (e.g. color, po-sition). We use those features for ourGroupmodel as well, and evaluate forKbetween 1 and 10.
Results on GIVE data Basic had a test
accu-racy of 72.70%, which was almost identical with the accuracy of our bestGroupmodel forK = 6
[image:7.595.311.523.67.168.2]probabil-ity to one of the groups, and effectively gets stuck with this assignment while testing; the mean en-tropy of the posterior group distribution only falls from an initial 1.1 to 0.7 after 10 observations.
We speculate that the reason behind this is that the features we use are not sensitive enough to cap-ture the differences between the users in this data. Since our model relies completely on observable behavior, it also relies on the ability of the features to make relevant distinctions between users.
Results on synthetic data In order to test this
hypothesis, we made a synthetic dataset based on the GIVE datasets with 1000 instances from 100 users, in the following way: for each user, we ran-domly selected 10 scenes from GIVE-2, and re-placed the target the user selected, so that half of the users always select the target with the highest visual salience, and the other half always select the one with the lowest. Our aim was to test whether our model is capable of identifying groups when they are clearly present in the data and exhibit dif-ferences which our features are able to capture.
We evaluated the same models in a 2-fold cross-validation. Figure6shows the prediction accuracy forBasicand theGroupmodels forK from 1 to 10. All models for K > 1 clearly outperform the baseline model: the 2-group model gets62.3%
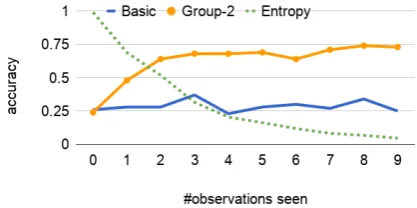
vs28.6%averaged over all test examples, while adding more than two groups does not further im-prove the accuracy. We also show in Figure7the evolution of the accuracy asD(u)grows: theGroup
model withK = 2reaches a 64% testing accuracy after seeing two observations from the same user. In the same figure, the entropy of the posterior dis-tribution over groups (see production experiment) falls towards zero asD(u) grows. These results show that our model is capable of correctly assign-ing a user to the group they belong to, once the features are adequate for distinguishing between different user behaviors.
6.3 Discussion
[image:8.595.312.522.65.170.2]Our model was shown to be successful in discover-ing groups of users with respect to their behavior, within datasets which present discernible user vari-ation. In particular, if all listeners are influenced in a similar way by e.g. the visual salience of an object, then the group model cannot learn different weights for the visual salience feature; if this hap-pens for all available features, there are effectively no groups for our model to discover.
Figure 6: Prediction accuracies in the comprehen-sion experiment with synthetic data.
Figure 7: Accuracy evolution with increasing num-ber of observations from the user in the comprehen-sion experiment with synthetic data.
Once the groups have been discovered, our model can then very quickly distinguish between them at test time. This is reflected in the steep performance improvement even after the first user observation in both the real data experiment in6.1
and the synthetic data experiment in6.2.
7 Conclusion
We have presented a probabilistic model for NLG which predicts the behavior of individual users of a dialog system by dynamically assigning them to user groups, which were discovered during train-ing2. We showed for two separate NLG-related tasks, RE production and RE comprehension, how our model, after being trained with data that is not annotated with user groups, can quickly adapt to un-seen users as it gets more observations from them in the course of a dialog and makes increasingly accurate predictions about their behavior.
Although in this work we apply our model to tasks related to NLG, nothing hinges on this choice; it can also be applied to any other dialog-related prediction task where user variation plays a role. In the future, we will also try to apply the basic prin-ciples of our user group approach to more sophisti-cated underlying models, such as neural networks.
2Our code and data is available inhttps://bit.ly/
[image:8.595.312.521.216.320.2]References
David Benyon and Dianne Murray. 1993. Developing adaptive systems to fit individual aptitudes. In Pro-ceedings of the 1st international conference on Intel-ligent user interfaces. ACM, pages 115–121.
Adam L. Berger, Stephen A. Della Pietra, and Vincent J. Della Pietra. 1996. A maximum entropy approach
to natural language processing. Computational
Lin-guistics22.
Markus Dr¨ager and Alexander Koller. 2012. Genera-tion of landmark-based navigaGenera-tion instrucGenera-tions from
open-source data. InProceedings of the Thirteenth
Conference of the European Chapter of the ACL.
Nikos Engonopoulos and Alexander Koller. 2014. Gen-erating effective referring expressions using charts. In Proceedings of the INLG and SIGDIAL 2014 Joint Session. pages 6–15.
Nikos Engonopoulos, Mart´ın Villalba, Ivan Titov, and Alexander Koller. 2013. Predicting the resolution of referring expressions from user behavior. In Pro-ceedings of the 2013 Conference on Empirical Meth-ods in Natural Language Processing. pages 1354– 1359.
Thiago Castro Ferreira and Ivandr´e Paraboni. 2017. Improving the generation of personalised
descrip-tions. In Proceedings of the 10th International
Conference on Natural Language Generation. pages 233–237.
Thiago Castro Ferreira and Ivandr Paraboni. 2014. Re-ferring expression generation: taking speakers pref-erences into account. InProceedings of the Interna-tional Conference on Text, Speech, and Dialogue.
Katja H¨auser, Jutta Kray, and Vera Demberg. 2017. Age differences in language comprehension during driving: Recovery from prediction errors is more ef-fortful for older adults. InProceedings of CogSci.
Srinivasan Janarthanam and Oliver Lemon. 2014. Adaptive generation in dialogue systems using
dy-namic user modeling. Computational Linguistics
40.
Alexander Koller, Kristina Striegnitz, Andrew Gargett, Donna Byron, Justine Cassell, Robert Dale, Johanna Moore, and Jon Oberlander. 2010. Report on the Second NLG Challenge on Generating Instructions
in Virtual Environments (GIVE-2). InProceedings
of the 6th International Natural Language Genera-tion Conference.
Radford M. Neal and Geoffrey E. Hinton. 1999. A
view of the em algorithm that justifies incremen-tal, sparse, and other variants. In Michael I.
Jor-dan, editor, Learning in graphical models, MIT
Press, Cambridge, MA, USA, pages 355–368.
http://dl.acm.org/citation.cfm?id=308574.308679.
Jorge Nocedal and Stephen Wright. 2006. Numerical
Optimization. Springer.
Cecile Paris. 1988. Tailoring object descriptions to a user’s level of expertise. Computational Linguistics 14.
J. A. Rosenblum and J. D. Moore. 1993. Participating in instructional dialogues: Finding and exploiting
relevant prior explanations. In Proceedings of the
World Conference on Artificial Intelligence in Edu-cation.
Kristina Striegnitz, Alexandre Denis, Andrew Gargett, Konstantina Garoufi, Alexander Koller, and Mariet Theune. 2011. Report on the Second Second Chal-lenge on Generating Instructions in Virtual
Environ-ments (GIVE-2.5). InProceedings of the 13th
Euro-pean Workshop on Natural Language Generation.
Jette Viethen and Robert Dale. 2008. The use of spa-tial relations in referring expression generation. In Proceedings of the Fifth International Natural Lan-guage Generation Conference. Association for Com-putational Linguistics, pages 59–67.
Jette Viethen and Robert Dale. 2010.
Speaker-dependent variation in content selection for referring
expression generation. In Proceedings of the
Aus-tralasian Language Technology Association Work-shop 2010. pages 81–89.