Data on nutrient digestibility is often applied in the formulation of fish diets to maximise feed efficiency and decrease environmental pollution due to undigested feed. An aquatic environment and the unique biological features of the animal caused digestibility studies with fish to be more complicated, lengthy, tedious and prone to error than with terrestrial animals (Cho et al., 1982). The above, together with cultivation of numerous fish species that differ in digestive capacity, result in the frequent use of tabulated digestibility values in fish feed formulation.
The main assumption in the use of digestibility values is that digestibility coefficients determined for individual feed ingredients are additive in
com-pound diets, suggesting the absence of interactions among ingredients and no influence due to dietary inclusion level. However, the validation of additiv-ity for apparent digestible contents of energy, pro-tein, amino acids and lipid is based on few studies (Cho et al., 1982; Wilson and Poe, 1985; Watanabe et al., 1996; Lupatsch et al., 1997; Allan et al., 1999; Tibbets et al., 2006) with finfish. Furthermore, di-gestibility coefficients for individual feed ingredi-ents are influenced by numerous factors other than species, related to the rearing environment, ingre-dient history, and digestibility technique (National Research Council, 1993; Glencross et al., 2007). The latter includes, among others, acclimatisation pe-riod, indigestible marker used, faeces collection
Supported by the Ministry of Education, Youth and Sports of the Czech Republic (Project No. MSM 6007665809).
The error associated with the prediction of digestible
protein contents of fish diets from tabulated values
J. Sales
University of South Bohemia in České Budějovice, Faculty of Fisheries and Protection of Waters, Research Institute of Fish Culture and Hydrobiology, Vodňany, Czech Republic
AbstrAct: Numerous species available for culture, and lengthy, tedious and demanding digestibility experiments necessitate the use of tabulated values to calculate the apparent digestible nutrient contents of compound fish diets. The error associated with the above practice was evaluated in the present study with the use of apparent protein digestibility coefficients (APDCs) and dietary crude protein (CP) contents obtained in independent studies on fish nutrition. Prediction of APDCs of 21 compound diets evaluated in 18 studies with rainbow trout (Oncorhynchus mykiss), by using APDCs of 27 individual feed ingredients determined for this fish species, presented a mean prediction error (MPE) of 0.0489 between observed and predicted values. However, the above APDCs resulted in an overestimation of 7.86% (MPE = 0.0899) for APDCs of compound diets (n = 15) tested with 7 species other than rainbow trout. The CP contents of the above compound diets were overestimated with MPE’s of 0.3029 and 0.3200 for rainbow trout and other species, respectively, when using CP contents of individual feed ingredients as predictors. This eliminates the use of tabulated values to calculate apparent digestible protein contents of compound fish diets, except if databases are regularly updated with CP values for feed ingredients used.
method, leaching of nutrients from feed and faeces, assay diet, and equation to calculate the digest-ibility coefficient.
Digestibility coefficients (energy, protein, lipid, carbohydrates) for several feed ingredients evalu-ated with rainbow trout (Oncorhynchus mykiss) have been tabulated by the National Research Council (1981) from studies conducted before 1980. However, a majority of the above values were obtained from the study of Smith et al. (1980), who used an aquatic modification of metabolism chambers developed for terrestrial animals that al-lowed separate collection of gills, urine and faecal excretions. This method, which has been successful only with rainbow trout, is open to criticism. Fish are immobilised and force-fed, which might cause stress that hampers the effective utilisation of feed (National Research Council, 1993).
A study was conducted to evaluate the accuracy of the prediction of apparent protein digestibility of compound fish diets with the use of values obtained for individual feed ingredients in independent stud-ies. Although amino acids, rather than total protein, should be the primary consideration of nutrition-ists in the formulating of fish diets (Sales, 2008), insufficient suitable values hampered an evaluation of amino acid digestibility values.
MAteriAl And Methods
description of datasets
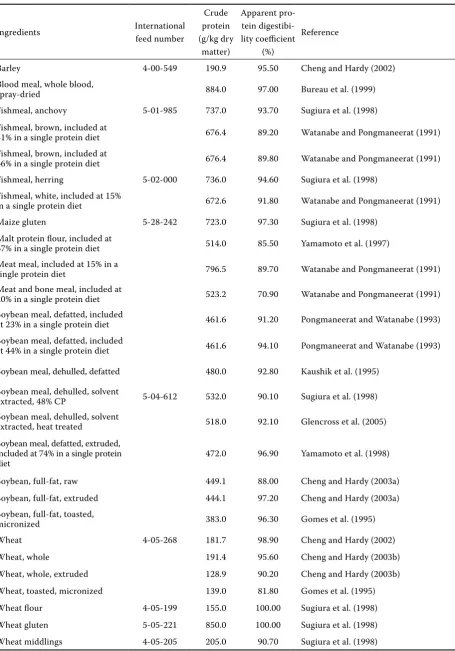
Crude protein (CP) contents and apparent protein digestibility coefficients(APDCs) of feed ingredi-ents commonly used in the formulation of diets for rainbow trout were collected from studies as presented in Tab1e 1.
In the above studies fish size ranged from 3.6 (Watanabe and Pongmaneerat, 1991) to 266 g (Glencross et al., 2005). All studies kept fish in fresh water, with water temperature varying from 12 (Watanabe and Pongmaneerat, 1991) to 22°C (Glencross et al., 2005). Two to five replicates were used in individual studies to determine digestibility. Four studies (Sugiura et al., 1998; Cheng and Hardy, 2002, 2003a,b) used yttrium oxide as indigestible marker, acid-insoluble ash was used in the study of Bureau et al. (1999), whereas all other studies utilized chromic oxide. Methods other than a set-tling column (Cho et al., 1982) to collect faeces were stripping (Cheng and Hardy, 2003a; Glencross
et al., 2005) and the St. Pee system (Gomes et al., 1995; Kaushik et al., 1995). The latter technique is based on the filtering of drainage water from fish tanks through metallic screens that separate faeces from water as they move linearly (Choubert et al., 1982). Except for the studies of Watanabe and Pongmaneerat (1991), Pongmaneerat and Watanabe (1993), and Yamamoto et al. (1997, 1998), which used single protein diets with direct calculation of APDCs, studies replaced 30% of a reference diet with the feed ingredient. In the lat-ter the relative contribution of the nutrient from the reference diet and the test ingredient to the combined diet in calculation of digestibility, as de-scribed by Forster (1999), was applied by Sugiura et al. (1998), Bureau et al. (1999) and Glencross et al. (2005). Crude protein content was determined by Cheng and Hardy (2002, 2003a,b) and Glencross et al. (2005) according to the Dumas method (Ebeling, 1968), with the Kjeldahl technique (AOAC, 1990) used in other studies.
Table 1. Digestibility coefficients of individual feed ingredients for rainbow trout
Ingredients International feed number
Crude protein (g/kg dry
matter)
Apparent pro-tein digestibi-lity coefficient
(%)
Reference
Barley 4-00-549 190.9 95.50 Cheng and Hardy (2002) Blood meal, whole blood,
spray-dried 884.0 97.00 Bureau et al. (1999) Fishmeal, anchovy 5-01-985 737.0 93.70 Sugiura et al. (1998) Fishmeal, brown, included at
31% in a single protein diet 676.4 89.20 Watanabe and Pongmaneerat (1991) Fishmeal, brown, included at
46% in a single protein diet 676.4 89.80 Watanabe and Pongmaneerat (1991) Fishmeal, herring 5-02-000 736.0 94.60 Sugiura et al. (1998)
Fishmeal, white, included at 15%
in a single protein diet 672.6 91.80 Watanabe and Pongmaneerat (1991) Maize gluten 5-28-242 723.0 97.30 Sugiura et al. (1998)
Malt protein flour, included at
67% in a single protein diet 514.0 85.50 Yamamoto et al. (1997) Meat meal, included at 15% in a
single protein diet 796.5 89.70 Watanabe and Pongmaneerat (1991) Meat and bone meal, included at
20% in a single protein diet 523.2 70.90 Watanabe and Pongmaneerat (1991) Soybean meal, defatted, included
at 23% in a single protein diet 461.6 91.20 Pongmaneerat and Watanabe (1993) Soybean meal, defatted, included
at 44% in a single protein diet 461.6 94.10 Pongmaneerat and Watanabe (1993) Soybean meal, dehulled, defatted 480.0 92.80 Kaushik et al. (1995)
Soybean meal, dehulled, solvent
extracted, 48% CP 5-04-612 532.0 90.10 Sugiura et al. (1998) Soybean meal, dehulled, solvent
extracted, heat treated 518.0 92.10 Glencross et al. (2005) Soybean meal, defatted, extruded,
included at 74% in a single protein
diet 472.0 96.90 Yamamoto et al. (1998) Soybean, full-fat, raw 449.1 88.00 Cheng and Hardy (2003a) Soybean, full-fat, extruded 444.1 97.20 Cheng and Hardy (2003a) Soybean, full-fat, toasted,
within diets, and significance levels among APDCs obtained from diets within studies.
To evaluate the possible use of APDCs obtained with rainbow trout in other fish species, stud-ies including similar feed ingredients like those presented in Table 1 in compound diets, and conducted with African catfish (Clarias gariepi-nus) (Ali and Jauncey, 2004), Atlantic cod (Gadus morhua) (Albrektsen et al., 2006; Toppe et al., 2006), Atlantic halibut (Hippoglossus hippoglos-sus) (Grisdale-Helland and Helland, 1998), Atlantic salmon (Salmo salar) (Aksness, 1995; Refstie et al., 1998, 1999, 2000, 2001; Storebakken et al., 1998; Bjerkeng et al., 1999), common carp (Cyprinus carpio) (Pongmaneerat et al., 1993), European sea bass (Dicentrarchus labrax) (Boujard et al., 2004; Kaushik et al., 2004) and Nile tilapia (Oreochromis niloticus) (Köprücü and Özdemir, 2005) were se-lected. Stripping was used in eight studies to col-lect faeces, whereas siphoning was used by Ali and Jauncey (2004) and dissection by Albrektsen et al. (2006). A mean value for the APDC was used in the study of Storebakken et al. (1998), who compared different faecal collection techniques (stripping, sieving, dissection), without any significant dif-ferences found among methods. Similarly like for rainbow trout, values were reduced to one diet per study. Limited values prevented the reduction of values to a maximum of two values per fish spe-cies and author, thus Atlantic salmon occurred in seven studies.
calculations and statistical analysis
Predicted values for compound diets were calcu-lated from relative proportions of feed ingredients multiplied by either APDCs (%) or CP contents (g/kg dry matter) of corresponding individual feed ingredients presented in Table 1. Despite the ab-sence of information on moisture status of diets in some studies, values were converted to a dry matter basis if presented as wet weight.
Simple linear regression analysis to evaluate the relation between predicted (y) and observed (x) values was performed with the use of the software STATISTICA (data analysis software system, Version 7.1; StatSoft, Tulsa, OK, USA), as described by Sales (2008). With linear regression the coefficient of deter-mination (R2) illustrates how well the regression line
represents the data, whereas the root mean square error (RMSE) indicates the magnitude of variation.
Mean square prediction error (MSPE) analysis, as described by Sales (2009), was included to identify the error of predicted relative to observed values (Theil, 1966):
n
MSPE =
∑
(Oi – Pi)2/ni=1
where:
n = the number of experimental observations Oi, Pi = the observed and predicted values, respectively
The mean prediction error (MPE) was calculated by presenting the root MSPE (√ MSPE ), which can be expressed in the same units as the output, as a fraction of the observed mean (O ):–
√ MSPE MPE = –––––––– O
The MSPE was divided into: (1) error in central tendency (ECT) or mean bias, (2) error due to re-gression (ER) or line bias, and (3) error due to dis-turbance (ED) or random bias:
ECT = (X– P – X– O)2
ER = (sP – r × sO)2
ED = ((1 – r2) × s O)2
where:
X
– P, X– O = the mean predicted and observed values, respec-tively
sP, sO = the standard deviations of the predicted and observed values, respectively
r = the correlation coefficient between predicted and observed values
results And discussion
Apparent protein digestibility coefficients
Feed ingredients are identified in National Research Council feed tables by a five-digit in-ternational feed number, preceded by a feed class number, with numbers assigned successively as new feed names are created. However, these numbers are seldom reported in studies on fish nutrition, especially in studies conducted in countries out-side the United States of America, as illustrated in Table 1.
differ-ent processing methods, such as fishmeal, soybean meal and wheat. In fish- and soybean meals differ-ences between the lowest and the highest CP con-tents were over 60 g/kg dry matter, whereas APDCs in soybean meals and wheat differed with around 7 percentage units. According to Sales (2008) the range of APDCs obtained in numerous studies with fish species varied from 56.00 to 99.00% for fishmeals, and 49.70 to 99.40% for soybean meals/ flours, indicating that feed ingredients selected in the present study were in the upper limits.
Values of 100% for apparent protein digestibil-ity, as presented for wheat flour and wheat gluten (Table 1), are a common phenomenon in studies evaluating feed ingredient digestibility with fish species. Furthermore, the assumption that digest-ibility coefficients will be between 0 and 100% is often not true. This could be attributed to, among others, analytical errors for markers or nutrients, poor mixing of the marker, non-representative samples of diets or faeces, interaction (associative effects) among feed ingredients (Glencross et al., 2007), and differential leaching of some nutrients within ingredients that is not accommodated by equations used for calculation (Allan et al., 2000; Sales and Britz, 2002).
Table 1 demonstrated an increase in APDCs for brown fishmeal (Watanabe and Pongmaneerat, 1991) and defatted soybean meal (Pongmaneerat and Watanabe, 1993) with an increase in the inclu-sion level of the protein source. This is in accord-ance with the linear relationship between dietary CP and apparent digestible protein contents in fish diets presented by Sales (2008). The former authors related these differences to the possible influence of metabolic faecal nitrogen. Metabolic faecal
ni-trogen is more correlated with dry feed intake than dietary protein content, with the result that the proportion of metabolic faecal nitrogen in faeces from fish fed low protein diets will be higher than for fish fed high protein diets. Furthermore, protein quality improves and the content of carbohydrates decreases with an increased dietary protein con-tent, resulting in an increase in protein digestibility (Austreng and Refstie, 1978). However, it should be emphasized that the above findings have been obtained for diets with a single ingredient as the only source of dietary protein.
Across individual feed ingredients (Table 1), grains (barley, wheat), characterised by a low CP content relatively to other feed ingredients, do not follow in general a decrease in the APDC when evaluated by the reference substitution method. Their low CP content would however result in little contribu-tion to the apparent digestible protein content of a compound diet. Lower APDCs for rainbow trout have been found at lower inclusion levels of fish-meal (Aksness et al., 1996) and lupin varieties with a lower CP content (Glencross et al., 2003), when applying the reference diet substitution method. Similar differences have been detected (Allan and Booth, 2004) with canola meal substituted at either 30 or 50% in reference diets for Australian silver perch (Bidyanus bidyanus). However, Appleford and Anderson (1997) reported a non-significant de-crease in APDCs of soybean meal for common carp with an increase (10 to 40%) in replacement level, attributed to the possible influence of protease inhibitors in soybean meal. Similarly, decreased APDCs at higher inclusion levels have been found with feather meal, field beans and field peas evalu-ated with rainbow trout (Pfeffer et al., 1995), and
y = 68.5481* + 2725*x R2 = 0.2987, RMSE = 1.6257
80 82 84 86 88 90 92 94 96 98 100
80 82 84 86 88 90 92 94 96 98 100
Observed apparent protein digestibility coefficients (%)
Predicted apparent protein digestibility coefficients (%)
Observed apparent protein digestibility coefficients (%)
Pr
edic
te
d a
pp
ar
en
t pr
ot
ein
dige
stibility c
oeffic
ien
ts (%)
80 82 84 86 88 90 92 94 96 98 100
y = 68.5481* + 2725*x R2 = 0.2987; RMSE = 1.6257
100 98 96 94 92 90 88 86 84 82 80
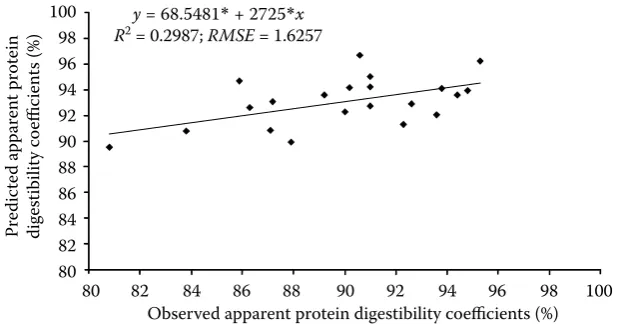
Figure 1. Linear relationship between predicted and observed apparent protein digestibility coefficients evaluated with rain-bow trout (n = 21, 18 studies)
[image:5.595.66.377.594.757.2]leaf meal with blue tilapia (Oreochromis aureus) (De Silva et al., 1990). In contrast, Da Silva and Oliva-Teles (1998) found no statistical differences in APDCs of various feed ingredients (fishmeal, fish protein concentrate, soybean meal, blood meal, meat meal) included at either 15 or 30% in test diets when evaluated with European sea bass,whereas fishmeal (Kim et al., 2006) and soybean meal (Kim et al., 2007) included at levels of 10–40% in a refer-ence diet presented similar results with haddock (Melanogrammus aeglefinus). In addition, the in-clusion level had no influence on APDCs of raw and extruded soybean meal (Allan and Booth, 2004) and meat meal products evaluated with Australian silver perch (Stone et al., 2000), or meat and poul-try meals for Australian snapper (Pagrus auratus) (Booth et al., 2005). It seems that in addition to feeding habits and digestive physiology of fish, di-gestibility might also be influenced by the chemi-cal composition of the reference diet and test feed ingredients (Kim et al., 2006).
Accuracy of predicted apparent protein digestibility values of diets for rainbow trout
The linear relationship between observed and predicted APDCs of compound diets for rainbow trout is characterised by an intercept and slope that differed significantly from 0 and 1, respectively, and an R2-value of less than 0.3000 (Figure 1).
However, with empirical validation there is no interest to predict a value from an observation, eliminating the main purpose of linear regression, and rendering the R2-value meaningless. The fitted
line is irrelevant to validation, and is simply the best summary of a straight line relationship among the samples of points provided by pairs of predic-tions and observapredic-tions. With a significant regression achieved with any cloud of points with a tendency to avoid two opposite corners, regression is not sensi-tive enough to quantify the quality of the line, once past the conventional thresholds of P = 0.05, 0.01 or 0.001. Furthermore, a low scattering of points caused lower standard errors and higher computed values of the t-statistic used for the null hypothesis tests for the intercept and slope, resulting in values that are likely to be significant from 0 and 1, respec-tively (Mitchell, 1997). A further contributing factor to the poor performance of linear regression in the present study could be the narrow ranges of ob- Tabl
[image:6.595.332.475.88.760.2]served values. Although the relationships between observed and predicted values are graphically rep-resented in the text below, discussions are mainly restricted to results from MPE analysis.
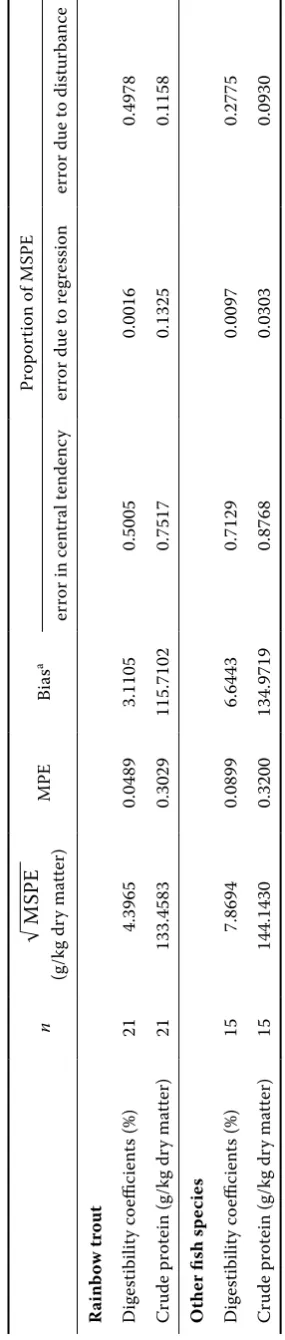
In contrast to linear regression, deviations, calcu-lated as prediction minus observation, give direct information on the failure of the model to simulate the system exactly (Mitchell, 1997). These devia-tions are incorporated in mean square prediction error analysis, which is frequently used in animal nutrition for the validation of models (see Sales, 2009). An MPE of 0.0489 indicated an overpredic-tion of 4.40% of observed values when tabulated APDCs for individual feeds were used to calcu-late coefficients for compound diets (Table 2). The MSPE was caused by a consistent overestimation of observed values by predicted values (ECT), and a failure to predict the pattern of fluctuations across observed values (ED).
Speculation about the possibility of non-addi-tivity among feed ingredients causing overestima-tions of observed values would be unjustified in the present study, considering the diverse origin of
feed ingredients. Non-additivity due to associative effects among dietary ingredients, a common phe-nomenon in terrestrial herbivore nutrition and also found with some aquatic species (see Sales and Britz, 2002), caused a higher or lower digestibility value in a mixture of ingredients than the mean digestibility of the individual feed ingredients composing the mixture. Furthermore, with 0.6000 arbitrarily set as an acceptable MPE, APDCs used for individual feed ingredients (Table 1) could be reduced by 7.52 per- centage units, or increased by 1.37 percentages units (with values not exceeding 100% for the latter). This indicates a degree of insensitivity of APDCs to change, and could find application in practical feed formulation for compound fish diets.
However, the use of CP contents of individual feed ingredients (Table 1) to calculate the CP con-tents of compound diets (Figure 2) resulted in an MPE of over 0.3000 (Table 2), with most (>75%) of the MSPE attributed to a consistent overestima-tion of observed values (ECT). This eliminates the prediction of apparent digestible protein content (CP content × APDC) of compound diets from
y = 455.5035* + 0.2289*x R2 = 0.0343; RMSE = 59.0244
300 350 400 450 500 550 600 650 700
300 350 400 450 500 550 600
Observed crude protein (g/kg dry matter)
Pr ed ic te d cr ud e pr ot ei n (g /k g dr y m at te
r) R2y = 0.0343; = 455.5035RMSE* + 0.2289 = 59.0244*x
Observed crude protein (g/kg dry matter)
300 350 400 450 500 550 600 700 650 600 550 500 450 400 350 300 Pr edic te d c rude pr ot ein (g/kg dr y ma tter)
y = 92.5231* + 0.0187*x R2 = 0.0052, RMSE = 1.1512
80 82 84 86 88 90 92 94 96 98 100
80 82 84 86 88 90 92 94 96 98 100
Observed apparent protein digestibility coefficients (%)
Pr ed ic te d ap pa re nt p ro te in d ig es tib ili ty co ef fic ie nt s (% )
y = 92.5231* + 0.0187*x R2 = 0.0052; RMSE = 1.1512
Observed apparent protein digestibility coefficients (%)
Pr edic te d a pp ar en t pr ot ein dige stibility c oeffic ien ts (%)
80 82 84 86 88 90 92 94 96 98 100 100 98 96 94 92 90 88 86 84 82 80
Figure 2. Linear relationship between predicted and observed crude protein content (g/kg dry matter) in compound diets for rainbow trout (n = 21, 18 stu-dies)
*different (P < 0.05) from 0 for intercept and 1 for slope
Figure 3. Linear relationship between predicted and obser-ved apparent protein digestibi-lity coefficients evaluated with different fish species (n = 15, 7 species, 15 studies)
[image:7.595.65.417.89.256.2] [image:7.595.64.376.594.759.2]tabulated values. An MPE of 0.3404 and overpre-diction of 135.1942 g/kg dry matter was obtained for this measurement with current results. Sales (2008) presented a linear regression equation (y = –10.0731 + 0.8942x) to predict apparent digest-ible protein (y; g/kg dry matter) from CP contents (x; g/kg dry matter) for individual feed ingredients across a wide range of fish species, feed ingredients, feed types, nutrient levels, life stages and rearing conditions. This equation facilitates different di-gestibilities at variable CP contents, and takes en-dogenous losses into account. However, due to the use of several studies included in the present study in the computing of this equation (Sales, 2008), it could not be evaluated in the current study.
Accuracy of predicted apparent protein digestibility values of diets for other fish species
The use of APDCs for individual feed ingredients established with rainbow trout (Table 1) to predict APDCs of compound diets for other fish species (Figure 3) resulted in an MPE of almost 0.0900 (Table 2). This put a restriction on the safe use of APDCs established with a specific fish species in other species.
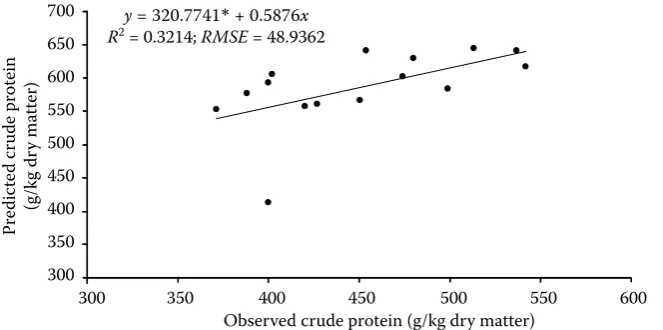
Predicted CP contents (Table 2) presented a simi-lar MPE, with a higher overestimation (√ MSPE) than found with rainbow trout above. Although the fish factor (APDCs) was not taken into considera-tion in this calculaconsidera-tion and the results were expected to be similar, differences, both in linear regression equations (Figures 3 and 4) and MPE analysis (Table 2), showed that differences existed among similar feed ingredients between the two datasets.
conclusions
This study presents evidence that, based on pre-diction error analysis between predicted and ob-served values, the APDC of a compound fish diet can be predicted with a high degree of accuracy from APDCs determined for individual feed ingredients in independent studies. Furthermore, a certain degree of flexibility of the latter gave an acceptable level of accuracy. However, it seemed that the above pro-cedure was to some extent specific for fish species, and generalisation across species would not be rec-ommended. Furthermore, it should be accentuated that only high quality, commonly used feed ingre-dients were included in the present study. A lack of suitable values, mainly caused by an incomplete description of products in studies, eliminated the evaluation of non-conventional feed ingredients that might present low digestibility values.
Contrary to APDCs, the use of corresponding CP contents of feed ingredients to calculate the CP content of compound diets gave erroneous results, and prevented the prediction of apparent digestible protein contents from tabulated values. This accen-tuates the well-known variability in CP content of similar feed ingredients, influenced by numerous factors, such as geographical origin and processing. Regular evaluation of the chemical composition of feed ingredients included in feed composition tables is of utmost importance. Furthermore, this cannot be restricted to feed ingredients specific to a certain region, seen the regular distribution of feed ingredients worldwide. Although this might be a logical fact, it is often ignored by feed formula-tors. The present study contributes by quantifying the error associated with not taking the above into account.
Figure 4. Linear relationship between predicted and observed crude protein content (g/kg dry matter) in compound diets for different fish species (n = 15, 7 species, 15 studies)
*different (P < 0.05) from 0 for intercept and 1 for slope
y = 320.7741* + 0.5876x R2 = 0.3214, RMSE = 48.9362
300 350 400 450 500 550 600 650 700
300 350 400 450 500 550 600
Observed crude protein (g/kg dry matter)
Pr
ed
ic
te
d
cr
ud
e
pr
ot
ei
n
(g
/k
g
dr
y
m
at
te
r) R2y = 0.3214; = 320.7741RMSE* + 0.5876 = 48.9362x
Observed crude protein (g/kg dry matter)
Pr
edic
te
d c
rude pr
ot
ein
(g/kg dr
y ma
tter)
300 350 400 450 500 550 600 700
[image:8.595.64.396.89.254.2]references
Akiyama T., Unuma T., Yamamoto T., Marcouli P., Kishi S. (1995): Combinational use of malt protein flour and soybean meal as alternative protein sources of fish meal in fingerling rainbow trout diets. Fisheries Science, 61, 828–832.
Aksnes A. (1995): Growth, feed efficiency and slaughter quality of salmon, Salmo salar L., given feed with dif-ferent ratios of carbohydrate and protein. Aquaculture Nutrition, 1, 241–248.
Aksnes A., Hjertnes T., Opstvedt J. (1996): Comparison of two assay methods for determination of nutrient and energy digestibility in fish. Aquaculture, 140, 343–359. Albrektsen S., Mundheim H., Aksnes A. (2006): Growth,
feed efficiency, digestibility and nutrient distribution in Atlantic cod (Gadus morhua) fed two different fish meal qualities at three dietary levels of vegetable pro-tein sources. Aquaculture, 261, 626–640.
Ali M.Z., Jauncey K. (2004): Optimal dietary carbohy-drate to lipid ratio in African catfish Clarias
garie-pinus (Burchell, 1822). Aquaculture International,
12, 169–180.
Allan G.L., Booth M.A. (2004): Effects of extrusion processing on digestibility of peas, lupins, canola meal and soybean meal in silver perch, Bidyanus bidyanus (Mitchell) diets. Aquaculture Research, 35, 981–991. Allan G.L., Rowland S.J., Parkinson S., Stone D.A.J.,
Jan-trarotai W. (1999): Nutrient digestibility for juvenile silver perch Bidyanus bidyanus: development of meth-ods. Aquaculture, 170, 131–145.
Allan G.L., Parkinson S., Booth M.A., Stone D.A.J., Row-land S.J., Frances J., Warner-Smith R. (2000): Replace-ment of fish meal in diets for Australian silver perch,
Bidyanus bidyanus: I. Digestibility of alternative
ingre-dients. Aquaculture, 186, 293–310.
AOAC (1990): Official Methods of Analysis. 15th ed. As-sociation of Official Analytical Chemists. Arlington, USA, 1230 pp.
Appleford P., Anderson T.A. (1997): Effect of inclusion level and time on apparent digestibility of solvent-ex-tracted soybean meal for common carp (Cyprinus car-pio, Cyprinidae). Asian Fisheries Science, 10, 65–74. Austreng E., Refstie T. (1978): Effect of varying dietary
protein level in different families of rainbow trout. Aquaculture, 18, 145–156.
Barrias C., Oliva-Teles A. (2000): The use of locally pro-duced fish meal and other dietary manipulations in practical diets for rainbow trout Oncorhynchus mykiss (Walbaum). Aquaculture Research, 31, 213–218. Barrows F.T., Gaylord T.G., Stone D.A.J., Smith C.E.
(2007): Effect of protein source and nutrient density
on growth efficiency, histology and plasma amino acid concentration of rainbow trout (Oncorhynchus mykiss Walbaum). Aquaculture Research, 38, 1747–1758. Bjerkeng B., Følling M., Lagocki S., Storebakken T., Olli
J.J., Alsted N. (1997): Bioavailability of all-E -astaxan-thin and Z-isomers of astaxanthin in rainbow trout
(Oncorhynchus mykiss). Aquaculture, 157, 63–82.
Bjerkeng B., Storebakken T., Wathne E. (1999): Choles-terol and short-chain fatty acids in diets for Atlantic salmon Salmo salar (L.): effects on growth, organ in-dices, macronutrient digestibility, and fatty acid com-position. Aquaculture Nutrition, 5, 181–191.
Booth M.A., Allan G.L., Anderson A.J. (2005): Investiga-tion of the nutriInvestiga-tional requirements of Australian
snap-per Pagrus auratus (Bloch and Schneider, 1801):
apparent digestibility of protein and energy sources. Aquaculture Research, 36, 378–390.
Boujard T., Gélineau A., Covès D., Corraze G., Dutto G., Gasset E., Kaushik S. (2004): Regulation of feed intake, growth, nutrient and energy utilisation in European sea bass (Dicentrarchus labrax) fed high fat diets. Aquaculture, 231, 529–545.
Bureau D.P., Harris A.M., Cho C.Y. (1999): Apparent di-gestibility of rendered animal protein ingredients for rainbow trout (Oncorhynchus mykiss). Aquaculture, 180, 345–358.
Cheng Z.J., Hardy R.W. (2002): Effect of microbial phytase on apparent nutrient digestibility of barley, canola meal, wheat and wheat middlings, measured in vivo using rainbow trout (Oncorhynchus mykiss). Aquacul-ture Nutrition, 8, 271–277.
Cheng Z.J., Hardy R.W. (2003a): Effects of extrusion and expelling processing, and microbial phytase supple-mentation on apparent digestibility coefficients of nu-trients in full-fat soybeans for rainbow trout
(Oncorhynchus mykiss). Aquaculture, 218, 501–514.
Cheng Z.J., Hardy R.W. (2003b): Effect of extrusion processing of feed ingredients on apparent digestibility coefficients of nutrients for rainbow trout (
Oncorhyn-chus mykiss). Aquaculture Nutrition, 9, 77–83.
Cheng Z.J., Hardy R.W., Usry J.L. (2003): Effects of lysine supplementation in plant protein-based diets on the performance of rainbow trout (Oncorhynchus mykiss) and apparent digestibility coefficients of nutrients. Aquaculture, 215, 255–265.
Cho C.Y., Bayley H.S., Slinger S.J. (1974): Partial replace-ment of herring meal with soybean meal and other changes in diets for rainbow trout (Salmo gairdneri). Journal of the Fisheries Research Board of Canada, 31, 1523–1528.
on feed utilization by rainbow trout. Journal of Nutri-tion, 106, 1547–1556.
Cho C.Y., Slinger S.J., Bayley H.S. (1982): Bioenergetics of salmonid fishes: energy intake, expenditure and pro-ductivity. Comparative Biochemistry and Physiology, 73B, 25–41.
Choubert G., de la Noüe J., Luquet P. (1982): Digestibil-ity in fish: improved device for the automatic collection of faeces. Aquaculture, 29, 185–189.
Da Silva J.G, Oliva-Teles A. (1998): Apparent digestibility coefficients of feedstuffs in seabass (Dicentrarchus labrax) juveniles. Aquatic Living Resources, 11, 187–191. De Silva S.S., Shim K.F., Ong A.K. (1990): An evaluation
of the method used in digestibility estimations of a dietary ingredient and comparisons on external and internal markers, and time of faeces collection in di-gestibility studies in the fish Oreochromis aureus (Steinachner). Reproduction, Nutrition, Development, 30, 215–226.
Ebeling M.E. (1968): The Dumas method for nitrogen in feeds. Journal of the Association of Official Analytical Chemists, 51, 766–770.
Forster I. (1999): A note on the method of calculating digestibility coefficients of nutrients provided by single ingredients to feeds of aquatic animals. Aquaculture Nutrition, 5, 143–145.
Glencross B., Curnow J., Hawkins W. (2003): Evaluation of the variability in chemical composition and digest-ibility of different lupin (Lupinus angustifolis) kernel meals when fed to rainbow trout, (Oncorhynchus
mykiss). Animal Feed Science and Technology, 107,
117–128.
Glencross B.D., Evans D.R., Dods K., McCafferty P., Hawkins W.E., Maas R., Sipsas S. (2005): Evaluation of the digestible value of lupin and soybean protein concentrates and isolates when fed to rainbow trout
(Oncorhynchus mykiss), using either stripping or
set-tlement faecal collection methods. Aquaculture, 245, 211–220.
Glencross B.D., Booth M., Allan G.L. (2007): A feed is only as good as its ingredients – a review of ingredient evaluation strategies for aquaculture feeds. Aquacul-ture Nutrition, 13, 17–34.
Gomes E.F., Rema P., Kaushik S.J. (1995): Replacement of fish meal by plant proteins in the diet of rainbow trout (Oncorhynchus mykiss): digestibility and growth performance. Aquaculture, 130, 177–186.
Green J.A., Hardy R.W., Brannon E.L. (2002a): Effects of dietary phosphorus and lipid levels on utilization and excretion of phosphorus and nitrogen by rainbow trout
(Oncorhynchus mykiss). 1. Laboratory-scale study.
Aquaculture Nutrition, 8, 279–290.
Green J.A., Brannon E.L., Hardy R.W. (2002b): Effects of dietary phosphorus and lipid levels on utilization and excretion of phosphorus and nitrogen by rainbow trout
(Oncorhynchus mykiss). 2. Production-scale study.
Aquaculture Nutrition, 8, 291–298.
Grisdale-Helland B., Helland S.J. (1998): Macronutrient utilization by Atlantic halibut (Hippoglossus hippoglos-sus): diet digestibility and growth of 1 kg fish. Aquac-ulture, 166, 57–65.
Kaushik S.J., Cravedi J.P., Lalles J. P., Sumpter J., Faucon-neau B., Laroche M. (1995): Partial or total replacement of fish meal by soybean protein on growth, protein uti-lization, potential estrogenic or antigenic effects, cho-lesterolemia and flesh quality in rainbow trout,
Oncorhynchus mykiss. Aquaculture, 133, 257–274.
Kaushik S.J., Covès D., Dutto G., Blanc D. (2004): Al-most total replacement of fish meal by plant protein sources in the diet of a marine teleost, the European seabass, Dicentrarchus labrax. Aquaculture, 230, 391–404.
Kim J.-D., Tibbetts S.M., Milley J.E., Lall S.P. (2006): Ef-fect of the incorporation level of herring meal into test diet on apparent digestibility coefficients for protein and energy by juvenile haddock, Melanogrammus
aeglefinus L. Aquaculture, 258, 479–486.
Kim J.-D., Tibbetts S.M., Milley J.E., Lall S.P. (2007): Ef-fect of the incorporation level of dehulled soybean meal into test diet on apparent digestibility coefficients for protein and energy by juvenile haddock,
Melanogram-mus aeglefinus L. Aquaculture, 267, 308–314.
Köprücü K., Özdemir Y. (2005): Apparent digestibility of selected feed ingredients for Nile tilapia (Oreochromis
niloticus). Aquaculture, 250, 308–316.
Lanari D., D’Agaro E., Turri C. (1998): Use of nonlinear regression to evaluate the effects of phytase enzyme treatment of plant protein diets for rainbow trout (
On-corhynchus mykiss). Aquaculture, 161, 345–356.
Lupatsch I., Kissil G.Wm., Sklan D., Pfeffer E. (1997): Ap-parent digestibility coefficients of feed ingredients and their predictability in compound diets for gilthead sea-bream, Sparus aurata L. Aquaculture Nutrition, 3, 81–89.
Mitchell P.L. (1997): Misuse of regression for empirical validation of models. Agricultural Systems, 54, 313–326. National Research Council (1981): Nutrient
Require-ments of Coldwater Fishes. National Academy Press, Washington, USA, 63 pp.
National Research Council (1993): Nutrient Require-ments of Fish. National Academy Press, Washington, USA, 128 pp.
soy-bean meal utilization by rainbow trout, Oncorhynchus
mykiss. Aquaculture, 124, 343–349.
Pfeffer E., Kinzinger S., Rodehutscord M. (1995): Influence of the proportion of poultry slaughter by-products and of untreated or hydrothermically treated legume seeds in diets for rainbow trout, Oncorhynchus mykiss (Walbaum), on apparent digestibilities of their energy and organic compounds. Aquaculture Nutrition, 1, 111–117. Pongmaneerat J., Watanabe T. (1992): Utilization of
soy-bean meal as protein source in diets for rainbow trout. Nippon Suisan Gakkaishi, 58, 1983–1990.
Pongmaneerat J., Watanabe T. (1993): Nutritional evalu-ation of soybean meal for rainbow trout and carp. Nip-pon Suisan Gakkaishi, 59, 157–163.
Pongmaneerat J., Watanabe T., Takeuchi T., Satoh S. (1993): Use of different protein meals as partial or to-tal substitution for fish meal in carp diets. Nippon Suisan Gakkaishi, 59, 1249–1257.
Refstie S., Helland S.J., Storebakken T. (1997): Adaptation to soybean meal in diets for rainbow trout,
Oncorhyn-chus mykiss. Aquaculture, 153, 263–272.
Refstie S., Storebakken T., Roem A.J. (1998): Feed con-sumption and conversion in Atlantic salmon (Salmo
salar) fed diets with fish meal, extracted soybean meal
or soybean meal with reduced content of oligosaccha-rides, trypsin inhibitors, lectins and soya antigens. Aquaculture, 162, 301–312.
Refstie S., Svihus B., Shearer K.D., Storebakken T. (1999): Nutrient digestibility in Atlantic salmon and broiler chickens related to viscosity and non-starch polysac-charide content in different soyabean products. Animal Feed Science and Technology, 79, 331–345.
Refstie S., Korsøen ø.J., Storebakken T., Baeverfjord G., Lein I., Roem A.J. (2000): Differing nutritional re-sponses to dietary soybean meal in rainbow trout (
On-corhynchus mykiss) and Atlantic salmon (Salmo salar).
Aquaculture, 190, 49–63.
Refstie S., Storebakken T., Baeverfjord G., Roem A.J. (2001): Long-term protein and lipid growth of Atlantic salmon (Salmo salar) fed diets with partial replacement of fish meal by soy protein products at medium or high lipid level. Aquaculture, 193, 91–106.
Romarheim O.H., Skrede A., Gao Y., Krogdahl Ĺ., Den-stadli V., Lilleeng E., Storebakken T. (2006): Compari-son of white flakes and toasted soybean meal partly replacing fish meal as protein source in extruded feed for rainbow trout (Oncorhynchus mykiss). Aquaculture, 256, 354–364.
Sales J. (2008): The use of linear regression to predict digestible protein and available amino acid contents of feed ingredients and diets for fish. Aquaculture, 278, 128–142.
Sales J. (2009): Prediction of digestible protein and lipid contents of crustacean feeds. Aquaculture Nutrition. (in press) DO/: 10.1111/j.1365-2095.00685.X
Sales J., Britz P.J. (2002): Evaluation of the reference diet substitution method for determination of apparent nutrient digestibility coefficients of feed ingredients for South African abalone (Haliotis midae L.). Aqua-culture, 207, 113–123.
Smith R.R., Peterson M.C., Allred A.C. (1980): Effect of leaching on apparent digestion coefficients of feed-stuffs for salmonids. Progessive Fish-Culturist, 42, 195–199.
Sørensen M., Ljřkjel K., Storebakken T., Shearer K.D., Skrede A. (2002): Apparent digestibility of protein, amino acids and energy in rainbow trout (
Oncorhyn-chus mykiss) fed a fish meal based diet extruded at
dif-ferent temperatures. Aquaculture, 211, 215–225. Stone D.A.J., Allan G.L., Parkinson S., Rowland S.J.
(2000): Replacement of fish meal in diets for Australian silver perch, Bidyanus bidyanus III. Digestibility and growth using meat meal products. Aquaculture, 186, 311–326.
Storebakken T., Kvien I.S., Shearer K.D., Grisdale-Hel-land B., HelGrisdale-Hel-land S.J., Berge G.M. (1998): The apparent digestibility of diets containing fish meal, soybean meal or bacterial meal fed to Atlantic salmon (Salmo salar): evaluation of different faecal collection methods. Aqua-culture, 169, 195–210.
Sugiura S.H., Dong F.M., Rathbone C.K., Hardy R.W. (1998): Apparent protein digestibility and mineral availabilities in various feed ingredients for salmonid feeds. Aquaculture, 159, 177–202.
Theil H. (1966): Applied Economic Forecasting. North-Holland Publishing Company, Amsterdam, The Neth-erlands, 474 pp.
Tibbets S.M., Milley J.E., Lall S.P. (2006): Apparent pro-tein and energy digestibility of common and alternative feed ingredients by Atlantic cod, Gadus morhua (Lin-naeus, 1758). Aquaculture, 261, 1314–1327.
Toppe J., Aksnes A., Hope B., Albrektsen S. (2006): Inclu-sion of fish bone and crab by-products in diets for At-lantic cod, Gadus morhua. Aquaculture, 253, 636–645. Watanabe T., Pongmaneerat J. (1991): Quality evaluation
of some animal protein sources for rainbow trout
On-corhynchus mykiss. Nippon Suisan Gakkaishi, 57,
495–501.
Watanabe T., Pongmaneerat J., Satoh S., Takeuchi T. (1993): Replacement of fish meal by alternative protein sources in rainbow trout diets. Nippon Suisan Gakkai-shi, 59, 1573–1579.
determined with four freshwater species. Fisheries Sci-ence, 62, 278–282.
Wilson R.P., Poe W.E. (1985): Apparent digestible pro-tein and energy coefficients of common feed ingre-dients of channel catfish. Progessive Fish-Culturist, 47, 154–158.
Yamamoto T., Ikeda K., Unuma T., Akiyama T. (1997): Apparent availabilities of amino acids and minerals from several protein sources for fingerling rainbow trout. Fisheries Science, 63, 995–1001.
Yamamoto T., Akimoto A., Kishi S., Unuma T., Akiyama T. (1998): Apparent and true availabilities of amino
acids from several protein sources for fingerling rain-bow trout, common carp, and red sea bream. Fisheries Science, 64, 448–458.
Yamamoto T., Shima T., Furuita H., Suzuki N. (2002): Influence of feeding diets with and without fish meal by hand and by self-feeders on feed intake, growth and nutrient utilization of juvenile rainbow trout (
Onco-rhynchus mykiss). Aquaculture, 214, 289–305.
Received: 2009–03–24 Accepted after corrections: 2009–06–04
Corresponding Author
James Sales, University of South Bohemia in České Budějovice, Faculty of Fisheries and Protection of Waters, Research Institute of Fish Culture and Hydrobiology, Zátiší 728, 389 25 Vodňany, Czech Republic