Effect of Cooling Process on Critical Current Density of Bi-2223/Ag Superconductive
Tapes Prepared by Dip-Coating
Masaki Sumida
*, Akiyoshi Matsumoto and Hiroaki Kumakura
National Institute for Materials Science (NIMS), Superconducting Materials Center, Tsukuba 305-0047, Japan
In this paper, effect of the cooling process is examined for the superconductive properties of highTcBi-2223/Ag tapes prepared by
dip-coating. The short tapes are cooled after the isothermal heat treatment at a controlled temperature profile, which can refine the microstructure.
The cooling rate and the slow cooling range are varied, showing that the optimum condition is found where the enhancedJcis obtained
compared to that of normal furnace cooling. Contrarily,Tcdid not show an optimum under this condition but increased monotonously with a
decrease in the cooling rate and an increase in the slow cooling range. From phase identification, microscopic observation, and quantitative analysis, the microstructure formation in the polycrystalline oxide layer during this process and its relation to these properties are discussed.
(Received June 30, 2003; Accepted July 31, 2003)
Keywords: Bi-2223, superconductor, cooling process, dip-coating, critical current density
1. Introduction
Material processing of the 110 K highTcsuperconducting phase, Bi-2223 (Bi2Sr2Ca2Cu3Ox), has been intensely
con-ducted since its discovery.1) This material has a grand potential for electric current capacity at liquid nitrogen temperature. Wire applications for electric power conduction would probably bear the best engineering benefits among the potentially available applications. A powder-in-tube (PIT) technique has been widely used to fabricate Bi-2223 cables and wires,2–9)since the high critical current density,Jc, has been successfully obtained by this method and this wire-forming technique is an easy treatment for overcoming the deficit of the mechanical strength of polycrystalline oxides. Ag is often selected as a sheath material because it is mechanically soft and, thus, suitable for mechanical defor-mation, and also because its contamination does not degrade the superconductive properties. Dip-coating has been devel-oped in this institute10)to prepare tapes with an oxide layer on a metal substrate in uniform thickness and bulk density. Using this technique, the substrate is coated as it passes through a chemical organic solution with suspended oxide powders. Here the chemical organics burns easily during subsequent heat treatment. This technique ensures that there will be fewer sausaging and cracking problems during the mechanical deformation than those that occur with the PIT technique. This offers the potential for improvement inJc.
The phase relationship in the Bi–Pb–Sr–Ca–Cu–O system has been investigated and compiled into diagrams by many authors.11–15) The stability range of single Bi-2223 phase is suggested to be only within 830–845C in the presence of Ag
in air12)and is not stable at low temperature. It forms from Bi-2212 (Bi2Sr2Ca1Cu2Oy), (Ca, Sr)2CuO3, (Ca, Sr)2PbO4, (Ca, Sr)14Cu24O41, and liquid phases, and the heat treatment concentrates into this temperature range. Although this phase formation occurs peritectically, current peritectic solidifica-tion models for oxides16,17)and metals18,19)are not directly applied to it because of its complicated phase relationships and non-equilibrium phase formation behavior. However,
this phase formation takes place under the mechanism of the intercalation and the grain growth according to the reaction equation. Bi-2212 can be a preferential seed for the growth of Bi-2223, because of common components and similarity of crystal structure. Bi-2212 transforms into Bi-2223 through the intercalation of Ca–Cu–O. 2223 thickens into the Bi-2212 grains while Bi-Bi-2212 dissipates. The intercalation of Ca–Cu–O would control the rate process thus this could be very slow reaction. Bi-2223 grains surrounding Bi-2212 also grows outwards with expanding its volume. Grain growth proceeds with consuming liquid and other oxides. Because mass transportation in the mixture might control the process but that via liquid is much faster than that via solid, the amount of the liquid would determine the transformation rate. Bi-2223 volume fraction increases with evolving both inwards and outwards of Bi-2212. Bi-2223 grains evolve preferentially along its a- and b- directions so that the final grain form is plate-like. Due to incompleteness of this type of reaction, Bi-2212 and other particles remain inside and outside the Bi-2223 grains. Pb doping remarkably enhances the Bi-2223 phase formation, and its optimum content for the Jcproperty has been elucidated.20)The solid solubility of Pb in this phase is highly temperature dependent and decreases with a decrease in the temperature below 850C, and Bi-2223 can contain almost no Pb at 750C.15)
For the applications suggested above, improvement of the Jcis of central importance. Due to polycrystalline character-istics of oxide filaments, optimization of bulk density, grain alignment and connectivity, phase composition, oxygen content, and elimination of second phase particles and microcracks are regarded as the principle goal to be achieved. Microstructure control is a crucial technique for them because their final microstructure develops during the heat treatment and mechanical deformation processes.
The slow cooling technique is effective to control the final microstructure and the Jc of Bi-2223 tapes.5–9) Parrell et al.5–7)reported that theJcof the PIT processed Bi-2223 was enhanced with a decrease in the cooling rate after an isothermal heat treatment in a low oxygen partial pressure atmosphere. Tapes were slowly cooled in the high temper-ature region, yielding a better intragrain flux pinning and
*Corresponding author, E-mail: [email protected]
intergrain connectivity. TheJcincreased with a decrease in the cooling rate to 0.01C/min. Grasso et al.9) reported
similar experiments on the PIT processed Bi-2223 in air. The tapes were cooled from the isotherm to room temperature at a constant rate within 0.0033–8.3C/min, and the optimum
cooling rate was in the middle range at 0.16–1.6C/min. The
microstructure refined during slow cooling, however, its formation process is not fully understood, and the optimiza-tion of the cooling process on theJchas not been completely successful.
In this report, the slow cooling technique was applied to Bi-2223 tapes prepared by dip-coating. The objective of this research is to produce tapes with better microstructure and minimum mechanical problems. The cooling rate and the slowly cooled temperature range were optimized to enhance theJcproperty, and an optimum cooling condition on theJc was found. By means of phase identification, microscopic observation, and quantitative analyses, the microstructure formation and its effect on the properties are discussed.
2. Experimental
Bi-2223 tapes were prepared by dip-coating. Commercial powder with a nominal composition of Bi1:88Pb0:33Sr2:00Ca1:97Cu3:00Ox(Dowa co.,2mm) was used
for the starting material, which was composed mainly of Bi-2212 with minor Bi-2223, Ca2PbO4, and Ca2CuO3. An appropriate amount of this powder was mixed with a solution of trichloroethylene, polyvinyl butyral, and sorbitantrioleate to create a viscous slurry. After being dipped into it, a Ag substrate of 50mmin thickness, 20 mm in width, and about 100 cm in length was pulled out at a constant rate of 1.3 cm/s on the long axis. The mixture coated the surface of the substrate. The masking tape put on the backside of the substrate was removed after the mixture dried out in air. The oxide layer deposited finally only on one side of the substrate was 40–45mm in thickness. The tapes were divided into small pieces of5 mm30 mmand foiled by additional Ag leaves so that they would become monocore tapes. A cross section of a tape is shown schematically in Fig. 1.
Heat treatments were performed on these tapes with intermediate cold roll pressing. The entire process was completed in air. A temperature measurement in the furnace was made by a K-type thermocouple. After carefully removing the chemical organics by heat treatment at 500C for 3 hours, the tapes were first pressed (RP1) to reduce their thickness to 170mmso that the bulk density would increase. The first heat treatment (HT1) was made atT1¼842C for
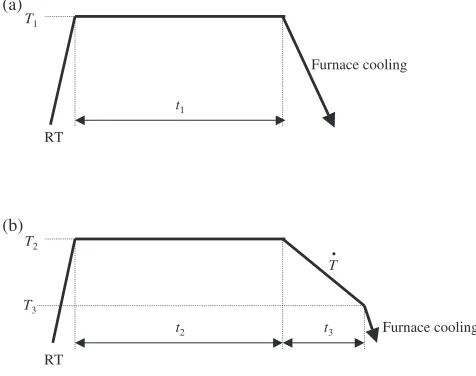
t1 ¼96h in a box furnace. After this process, the starting powder transformed mainly to Bi-2223. The second roll pressing (RP2) was made to reduce the thickness to 90mm, which was preliminarily optimized for the Jc. The cross section of an oxide core was reduced to 5–10mmin thickness and spread to 5.5 mm in width. A dense microstructure with almost no sausaging was observed in them. The second heat treatment (HT2) was made in a horizontal tube furnace with precise temperature control. This process determines mainly the final microstructure. Because the Bi-2223 property was very sensitive to T2,21) T2 was taken at 836C from the preliminary isothermal heat treatment experiments. The temperature histories in HT1 and HT2 are illustrated in Fig. 2. Further preliminary work was made ont2, and theJc increased with an increase oft2and was nearly constant over t2 ¼24h. Then t2¼96h is chosen for them. After this process, the cooling rate, TT_ð¼ ðT2T3Þ=t3Þ, and the lower limit of the slow cooling,T3, in HT2 varied.TT_varied in the range of 0.01–5C/min.T
3varied in the range of 750–100C atTT_¼0:5C/min.
The transportJcmeasurements were made by four-probe method at the liquid nitrogen temperature in the self field along with 1mV/cm criterion. At least three tapes were provided so that the scattering of the measured values was evaluated. TheJcwas defined as the critical current divided by the cross section area of the tapes determined by the microscopic observation. The onset Tc was estimated from AC susceptibility measurements in which the measurement error is assumed to be within 1 K from preliminary works. X-ray diffraction (XRD), scanning electron microscopy (SEM), and energy dispersive spectroscopy (EDS) were used for phase identification, microstructure observation, and quanti-tative analysis, respectively.
[image:2.595.306.544.76.264.2]3. Results
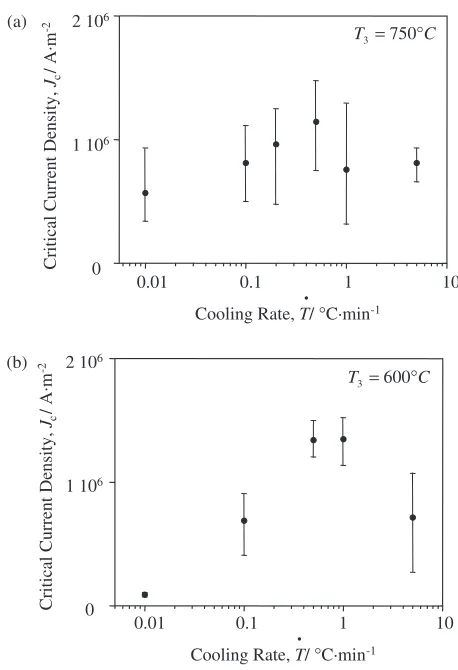
Figure 3 shows the Jc as a function of TT_. Samples processed with (a) T3¼750C and (b) T3 ¼600C are drawn. The mean values of theJcare shown along with the error width by the maximum and the minimum of measure-40-45µm
50µm
50µm 50µm
50-55mm silver foil oxide core silver substrate
Fig. 1 Schematic illustration of a cross section of a sample tape.
T1
Furnace cooling
RT
Furnace cooling
•
T
RT
T3 (a)
(b)
t1
T2
t2 t3
Fig. 2 Heat treatment processes in (a) the first heat treatment (HT1) and (b)
[image:2.595.53.277.675.770.2]ments. The measurements well scattered even though they are processed under the same condition. This could be attributed to the local inhomogeneity of the microstructure formed during the thermo-mechanical and the measurement processes. The liquid formed locally in the core reacts with Ag to form Ag-rich compound. This forms coarse particles, which partially occupy the cross section of the core and disturb the current path. The Jc shows the maximum at
_ T
T ¼0:5C/min for T
3¼750C, and TT_¼0:5{1C/min for T3 ¼600C. Figure 4 shows the onsetTcas a function ofTT_ withT3¼750C. The dotted line indicates the least square
regression. In contrast to Fig. 3, theTcincreases slightly but monotonously with decreasing TT_ besides one point atTT_¼
0:5C/min.TT_¼0:01C/min shows the highestT
cof 109.8 K in this figure. Figure 5 shows XRD patterns of oxide cores in samples of TT_¼5, 0.5, and 0.01C/min. In this figure,
intensive Bi-2223 peaks are found in all of these patterns, showing that this is the main phase in the core. Bi-2212 is also found. This phase remains through the process due to incompleteness of the reaction. Additionally, it can also be formed during cooling, thus there are two different paths to form Bi-2212. Small peaks of Ca2PbO4are found obviously at 2¼31 and 57 in the TT_¼0:01C/min sample.
Sr14Ca24O41, 3221 and some unknowns are also residual. Figure 6 shows corresponding SEM images in cross sections of the tapes. These microphotographs show a dense micro-structure. Grain alignment is, however, not well accomplish-ed, which could be attributed to little amount of liquid forming during the heat treatments. As observed in the central part of Fig. 6(c),TT_¼0:01C/min yields very coarse
[image:3.595.52.281.68.403.2]particles. At the smaller TT_, more and larger particles were found in the microstructure. These were identified as mainly (Ca, Sr)2PbO4 from the EDS analyses. The findings corre-spond with the XRD results.
Figure 7 shows the Jc as a function of T3. Samples processed withTT_¼0:5C/min are drawn. TheJ
c shows a broad maximum atT3¼450C. At this condition, supposing
_ T
T ¼5C/min in Figs. 3(a) and (b) is close to the furnace
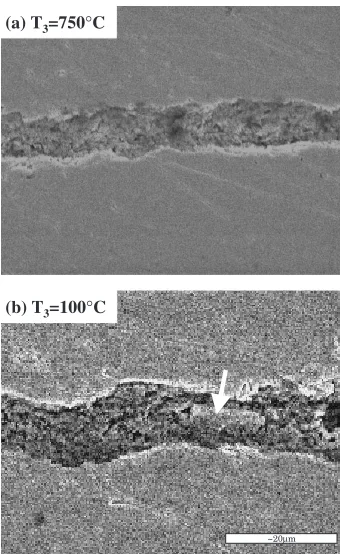
cooling rate, a Jc that was about twice larger than that of furnace cooling was obtained. Figure 8 shows the onsetTcof these samples as a function ofT3. In contrast to Fig. 7, theTc increased with decreasing T3 slightly, besides one point at T3 ¼600C.T3¼100C shows the highestTcof 109.4 K in this figure. Figure 9 shows SEM images of the cross sections ofT3 = (a) 750C and (b) 100C. A dense microstructure is observed, whereas coarse secondary particles suggested by an arrow stand out in the microstructure ofT3¼100C.
Critical Current Density,
Jc
/ A
. m
-2
0.01 0.1 1 10
0 1 106
2 106
T3= 750°C
0.01 0.1 1 10
0 1 106
2 106
T3= 600°C
Critical Current Density,
Jc
/ A
. m
-2
(b) (a)
Cooling Rate, T/ °C.min-1
Cooling Rate, T/ °C.min-1
Fig. 3 TheJcof Bi-2223 tapes as a function ofTT_with (a)T3¼750C and
(b)T3¼600C.
0.01 0.1 1 10
105 110 115
Critical Temperature,
Tc
/ K
Cooling Rate, T/ °C.min-1
Fig. 4 TheTcof Bi-2223 tapes as a function ofTT_withT3¼750C.
Int. (a.u.)
2θ
T=5 C/min
T=0.5 C/min
T=0.01 C/min
25 30 35 40 45 50 55 60
Ag
Ag
1 2 3 3
1 3
Fig. 5 XRD patterns of oxide cores in samples of TT_¼5, 0.5, and
0.01C/min withT
3¼750C.: Bi-2223,4: Bi-2212, 1: Ca2PbO4, 2:
[image:3.595.308.548.70.268.2] [image:3.595.65.272.611.767.2]4. Discussion
The Jc highly depends on the microstructure, and it is significantly determined during the cooling process. As shown in Fig. 3, the slow cooling is effective to enhance the
Jc, and there is an optimum range inTT_. Comparing between Figs. 3(a) and (b), theJcdependence onTT_is more significant at T3¼600C. Parrell et al.7)discussed the microstructure formation during slow cooling and described the factors that determine theJc. From micro- and macroscopic observations and the phase diagram, intragrain flux pinning and intergrain connectivity were specified for the Jc enhancement. Inside the grain, oxygen doping in the Bi-2223 phase, phase purification of Bi-2223, and decomposition product to arise pinning effect occur during cooling. Concerning the grain connectivity, an increment of bulk density, reduction of residual stress, fine precipitation of secondary particles for pinning effect, and grain growth with improving the interface connectivity takes place. These can occur in the dip-coated Bi-2223 tapes to explain theJcincrement with decrease inTT_ (b) T=0.5°C/min
~20µm
(c) T=0.01°C/min (a) T=5°C/min
Fig. 6 SEM images of oxide cores in samples of TT_ = (a) 5C/min,
(b) 0.5C/min, and (c) 0.01C/min withT
3¼750C.
0 200 400 600 800
0 1 106
Lower Limit of Slow Cooling, T3/ °C 2 106
T =0.5 °C/min
Critical Current Density,
Jc
/ A
. m
-2
Fig. 7 TheJcof Bi-2223 tapes as a function ofT3withTT_¼0:5C/min.
0 200 400 600 800
105 110 115
Critical Temperature,
Tc
/ K
Lower Limit of Slow Cooling, T3/ °C
Fig. 8 TheTcof Bi-2223 tapes as a function ofT3withTT_¼0:5C/min.
~20µm
(a) T3=750°C
(b) T3=100°C
Fig. 9 SEM images of oxide cores in samples ofT3 = (a) 750C and
(b) 100C withTT_¼0:5C/min. Coarse secondary particle is indicated by
[image:4.595.83.254.72.483.2] [image:4.595.323.529.74.232.2] [image:4.595.341.511.274.551.2] [image:4.595.64.276.534.694.2]in the range ofTT_¼50:5C/min in Figs. 3(a) and (b). On the other hand, with decrease inTT_, the cooling time,t3, increases. t3 takes about three hours to cool from 836 to 750C at 0.5C/min, whereas six days are required at
0.01C/min. Purification of Bi-2223 by rejection of Pb
enhances with decrease inTT_and this may cause an increase in the Tc, as shown in Fig. 5. On the other hand, because the tapes pass through the temperature range where the Bi-2223 is not stable solely, it decomposes to form the secondary phases. Bi-2212, Ca2PbO4, 3221 Ca2CuO3, Sr14Ca24O41and CuO can appear below the single phase stability range. Bi-2201 is stable at lower temperature range. Particles located at the grain boundaries are weak linkage to disturb the current path. Correspondingly, Bi-2223 volume fraction decreases due to its phase decomposition. Not all of these phases could be detected from XRD and SEM-EDS analyses, due to their small phase fraction. However, the compositional redistrib-ution, the grain growth and decomposition considerably proceed more with decrease inTT_. Regarding the XRD and SEM results shown in Figs. 5 and 6, the different behavior of theJcand theTcagainstTT_in Figs. 3 and 4 can be explained from the microstructure and composition evolution during cooling. With lowering T3, the slow cooling range and t3 increases proportionally. At T3¼600C, microstructure evolution mentioned above advances more significantly relative to T3¼750C. t3 is longer by about three times. This results in the largerTT_dependence of theJcin Fig. 3(b) than that in Fig. 3(a).
The optimum slow cooling range for theJc is found, as shown in Fig. 7, whileTcincreases with an increase in the slow cooling range, as shown in Fig. 8. The microstructure contains more secondary phases with decrease inT3. TheJc degradation at small T3 in Fig. 7 can be caused by these particles. However, as the equilibrium oxygen content in the Bi-2223 is optimum below 600C,22)
slow passage through this temperature range should be ideal for oxygen doping. Supposing oxygen incorporation into Bi-2223 takes place by diffusion through grain boundary and in the grain, this process proceeds more with the residual time below 600C.
The maximumTccould be obtained atT3¼100C due to the oxygen doping by the longest cooling time.
The residual stress is reduced, and the nucleation of the fine precipitations inside the grains was enhanced, where the phases of these precipitations are stable in this temperature range. Grain growth and connectivity may be enhanced, and these would contribute to theJcenhancement atT3¼450C. In the light of these results, it might be concluded that the optimum cooling condition is determined by a compromise of compatible positive and negative factors during cooling.
5. Summary
Applying slow-cooling techniques, microstructure control was made on high Tc superconductive Bi-2223/Ag tapes prepared by dip-coating. After the thermo-mechanical proc-ess, a cooling process in the final heat treatment was varied and its effect on the microstructure and the Jc and Tc is examined. The optimumTT_andT3locate at 0.5–1C/min and
450C, respectively. On the other hand, theTcdid not show any optimum, however, it increased monotonously with a decrease inTT_ and a decrease inT3. The enhancedJcabout twice larger than that from the normal furnace cooling was obtained under the optimum conditions.
From phase identification, microstructure observation, and quantitative analyses, the microstructure development and the consequent different behavior of the superconductive properties against TT_ and T3 were discussed. The micro-structure improves by pinning inside the Bi-2223 grains and connectivity of the grains with decrease inTT_in the largeTT_ range. In the small TT_, it degrades with decrease in TT_ by secondary particles formation and Bi-2223 decomposition. Possible phase purification proceeds simultaneously, how-ever, to enhance the Tc monotonously with decrease in TT_. With decrease in T3, oxygen doping into the Bi-2223 advances to enhance both the Jc and Tc, where the Tc increases monotonously. In the small T3, however, the Jc decreases with decrease inT3 due to the degradation of the microstructure.
REFERENCES
1) H. Maeda, Y. Tanaka, M. Fukutomi and T. Asano: Jpn. J. Appl. Phys.
27(1988) L209–210.
2) A. P. Malozemoff, W. Carter, S. Fleshler, L. Fritzemeier, Q. Li, L. Masur, P. Miles, D. Parker, R. Parrella, E. Podtburg, G. N. Riley Jr., M.
Rupich, J. Scudiere and W. Zhang: IEEE Trans. Appl. Supercond.9
(1999) 2469–2473.
3) K. Osamura, K. Ogawa, T. Thamizavel and A. Sakai: Physica C335
(2000) 65–68.
4) J. H. Ahn, H. K. Liu and S. X. Dou: Physica C351(2001) 371–378.
5) J. A. Parrell, D. C. Larbalestier and S. E. Dorris: IEEE Trans. Appl.
Supercond.5(1995) 1275–1278.
6) J. A. Parrell, D. C. Larbalestier, G. N. Riley Jr., Q. Li, R. D. Parrella and
M. Teplitsky: Appl. Phys. Lett.69(19) 4 Nov. (1996) 2915–2917.
7) J. A. Parrell, D. C. Larbalestier, G. N. Riley Jr., Q. Li, W. L. Carter,
R. D. Parrella and M. Teplitsky: J. Mater. Res.12(11) (1997) 2997–
3008.
8) J. P. Singh and N. Vasanthamohan: J. Mater. Res.13(2) (1998) 261–
268.
9) G. Grasso, F. Grilli, A. S. Siri, F. Marti, Y. Huang and R. Flu¨kiger:
Philo. Mag. B80(5) (2000) 991–996.
10) Y. S. Sung, H. Kumakura and K. Togano: Physica C331(2000) 171–
177.
11) P. Strobel, J. C. Tole´dano, D. Morin, J. Schneck, G. Vacquier, O.
Monnereau, J. Primot and T. Fournier: Physica C201(1992) 27–42.
12) W. Wong-Ng, L. P. Cook and W. Greenwood: J. Mater. Res.14(5)
(1999) 1695–1706.
13) W. Wong-Ng, L. P. Cook, A. Kearsley and W. Greenwood: J. Res.
Natl. Inst. Stand. Tech.104(1999) 277–289.
14) R. J. Moon, K. P. Trumble and K. J. Bowman: J. Mater. Res.14(3)
(1999) 652–664.
15) P. Majewski: J. Mater. Res.15(4) (2000) 854–870.
16) M. Sumida, Y. Shiohara and T. Umeda: Metall. Mater. Trans.31B
(2000) 141–149.
17) M. Sumida and T. Umeda: Metall. Mater. Trans.32A(2001) 595–604.
18) M. Sumida: J. Alloy. Compd.349(2003) 302–310.
19) M. Sumida: Mater. Trans.44(2003) 1351–1358.
20) J. W. Anderson, S. E. Dorris, J. A. Parrell and D. C. Larbalestier: J.
Mater. Res.14(2) (1999) 340–348.
21) E. A. Young, Y. Yang, C. Beduz and R. Riddle: IEEE Trans. Appl.
Supercond.11(1) (2001) 2979–2982.