Original Article
FAT1 expression in different breast lesions and
its down-regulation in breast cancer development
Xin-Hua Cao1*, Jian-Xin Lv2*, Xiao-Ying Wei3, Ercilia DGL Ltuamba1, Hao-Lin Hu2, Ya-Nan Zhang2 1Clinical Medical College, Zhongda Hospital, Southeast University, Nanjing 210009, China; 2Breast Disease
Center, Zhongda Hospital, Southeast University, Nanjing 210009, China; 3Department of Pathology, Zhongda
Hospital, Southeast University, Nanjing 210009, China. *Equal contributors.
Received February 27, 2017; Accepted May 9, 2017; Epub June 1, 2017; Published June 15, 2017
Abstract: Background: Breast cancer is one of the most common cancers in women and the mechanisms under the progression from ductal carcinoma in situ (DCIS) to invasive ductal carcinoma (IDC) remain incompletely under-stood. FAT1 is an important tumor regulatory factor. The aim of the study is to detect the possible discrepancy in their expression about FAT1 in different breast lesions and to explore the role of FAT1 in the development of breast cancer. Patients and methods: We used immunohistochemistry to detect protein expression of FAT1 in 10 patients diagnosed with breast benign disease, 5 patients diagnosed with DCIS, 5 patients diagnosed with IDC and 25 pa-tients diagnosed with invasive ductal carcinoma and accompanying ductal carcinoma in situ (IDC-DCIS). Results: FAT1 cadherin was expressed by both neoplastic and non-neoplastic mammary epithelia. FAT1 cadherin expression
was not significantly changed in DCIS group in comparison with the benign group (P=0.392). Comparing with the DCIS group, expression in the IDC group appeared to be down-regulated. There was a significant difference for the positive rate between the DCIS and IDC group (P=0.048). In the IDC-DCIS group, the total staining score of the IDC component was significantly lower than the score of DCIS component (P=0.002). Conclusions: FAT1 cadherin expression was found to be significantly decreased in IDC group compared with the DCIS group, which indicated it might have tumor suppressive function in late stage of breast cancer development. FAT1 cadherin can be identified
as a new biomarker in clinical practice.
Keywords: Ductal carcinoma in situ, invasive ductal carcinoma, FAT1, breast cancer, tumor progression
Introduction
Breast cancer is one of the most common can-cers in women in the world [1, 2]. The tradition-al model of human breast cancer progression proposes a linear multi-step process, normal epithelium develops into carcinoma in situ, which is the precursor of invasive cancer [3-5]. Carcinoma in situ is relatively common but only a small proportion appears to progress to inva-sive cancer. In tumors containing both ductal carcinoma in situ (DCIS) and invasive ductal carcinoma (IDC), DCIS is frequently an immedi-ate precursor lesion for co-existing IDC and however in tumors containing only IDC compo-nent, it is assumed that IDC arises de novo [6-9]. The mechanisms under the progression from DCIS to IDC remain incompletely under-stood. Many cancers develop because of genetic dysregulation which leads to gene mutations [10, 11] and inherited mutations in
BRCA1 or BRCA2 predispose to breast cancer [12]. Many scientists had studied the gene expression change between DCIS and IDC and had found a lot of important genes [13-15]. Identification of the altered gene and the relat -ed specific protein expression in DCIS and IDC can help us learn more about breast cancer development.
grade IV glioma cell lines and hepatocellular carcinoma cell lines but low in grade III glioma cell lines and primary human hepatocytes [22, 23]. However, loss-of-function of FAT1 cadherin contributed to the development of head and neck carcinoma and oral cancer [24, 25]. In a word, FAT1 appears to be an oncogenic or tumor suppressor in different types of tumors, but the function of this cadherin in cancer remains incompletely understood.
In the present study, we developed a clinically practical immunohistochemistry assay using Anti-FAT1 antibody produced in rabbit to exam-ine the FAT1 expression in different breast dis-eases including breast benign lesions, DCIS, invasive ductal carcinoma and accompanying ductal carcinoma in situ (IDC-DCIS) and IDC. Ductal carcinoma was divided into three groups as outlined above: DCIS, IDC and IDC-DCIS. The last one was defined as the presence of in situ component of invasive ductal carcinoma [26]. The IDC-DCIS group was set to compare the immunohistochemistry staining of the in situ component with the concurrent invasive com-ponent. We evaluate the staining intensity and percentage of stained cells and the results may show the true function of FAT1 in human breast cancer.
Materials and methods
Case selection and patient data
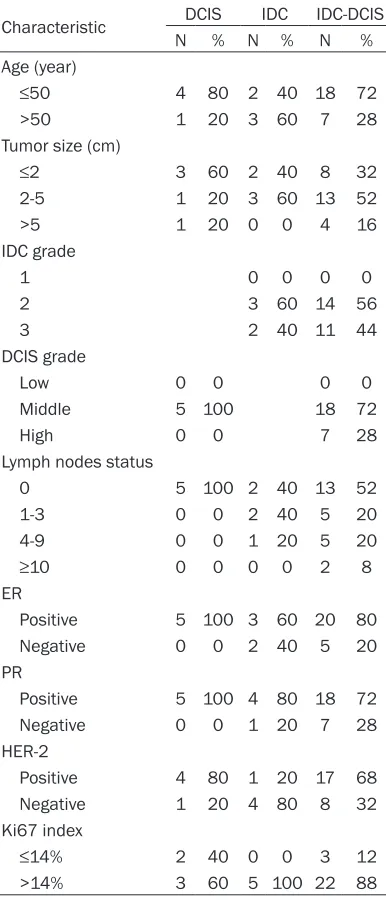
Formalin-fixed and paraffin-embedded tissue specimens from a total of 45 patients including 10 patients diagnosed with breast benign dis-ease, 5 patients diagnosed with DCIS, 5 pa- tients diagnosed with IDC and 25 patients di- agnosed with IDC-DCIS were randomly select-ed between April 2014 and December 2016 from Zhongda Hospital. All patients were women, ranging in age from 25 to 68 (mean 46.2). Every patient received operations imme-diately and none of the breast cancer patients received neoadjuvant therapy. The other char-acteristics are shown in Table 1. The diagnosis and pathological results of all cases were reviewed independently by two pathologists according to the World Health Organization classification [27] and The Nottingham com-bined histologic grade [28]. Informed consent was obtained from all patients before their sur-gery and before examination of the speci- mens.
[image:2.612.92.285.97.548.2]FAT1 cadherin was localized at filopodial tips, lamellipodial edges, and cell-cell boundaries, overlapping with dynamic actin structures and it has been demonstrated to modulate cell con-tacts and polarity in human cells [20]. The altered expression of FAT1 cadherin has been found in a number of solid tumors. In human disease, FAT1 cadherin was expressed by a range of leukemia cell lines and high FAT1 mRNA expression was predictive of shorter relapse-free and overall survival in precursor B-cell acute lymphoblastic leukemia [21]. The expression of FAT1 was found to be high in Table 1. Patient’s characteristics in DCIS, IDC and IDC-DCIS
Characteristic DCIS IDC IDC-DCIS N % N % N % Age (year)
≤50 4 80 2 40 18 72
>50 1 20 3 60 7 28 Tumor size (cm)
≤2 3 60 2 40 8 32
2-5 1 20 3 60 13 52 >5 1 20 0 0 4 16 IDC grade
1 0 0 0 0
2 3 60 14 56 3 2 40 11 44 DCIS grade
Low 0 0 0 0
Middle 5 100 18 72 High 0 0 7 28 Lymph nodes status
0 5 100 2 40 13 52 1-3 0 0 2 40 5 20 4-9 0 0 1 20 5 20
≥10 0 0 0 0 2 8
ER
Positive 5 100 3 60 20 80 Negative 0 0 2 40 5 20 PR
Positive 5 100 4 80 18 72 Negative 0 0 1 20 7 28 HER-2
Positive 4 80 1 20 17 68 Negative 1 20 4 80 8 32 Ki67 index
≤14% 2 40 0 0 3 12
scale of 0 to 4 as follows: 0. 0% of stained cells; 1. <25% of stained cells; 2. 25-49% of stained cells; 3. 50-74% of stained cells; 4. ≥75% of stained cells. The sum of the scores of staining intensity and percentage of positive cells was recorded as the total score. FAT1 was consid-ered as positive if the total score was between 5 and 7, and when the total score was between 0 and 4, we considered it as negative.
Statistical analysis
All statistical analyses were carried out using SPSS Statistics software (Version 21.0 for Windows). Chi-square test was performed for group rate comparison. The comparisons of the benign group, DCIS group and IDC group were evaluated by ANOVA. The average score of DCIS and IDC component in the IDC-DCIS group was compared by the two independent t-tests. P<0.05 was considered statistically signifi-cant.
Results
Immunoreactivity for FAT1 cadherin was local-ized on cytoplasm and/or cytomembrane of the neoplastic and non-neoplastic mammary epithelia. Table 2 summarizes the FAT1 protein expression results in different breast dise- ases.
Breast benign lesions
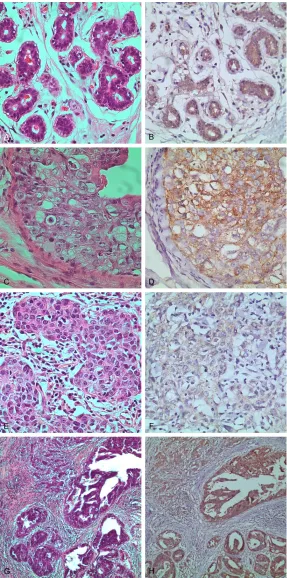
The staining result of the ten patients was almost all positive (9/10, 90%;Table 2; Figure 1A and 1B) except one patient whose patho-logical diagnosis was fibroadenoma with mu-coid degeneration. The benign lesions included intraductal papilloma, fibroadenoma, phyllodes tumor, adenosis and sclerosing adenosis. The immunohistochemistry positive specimens dis-played moderate to strong staining with more than 50% stained cells.
DCIS and IDC
As FAT1 was expressed in the cytoplasm and/or cytomembrane, staining expression was gener-ally homogenous in the cytoplasm within the same tumor when it was present. The tumors of DCIS displayed moderate to strong immunore-activity while the tumors of IDC displayed weak to moderate immunoreactivity (Figure 1C-F). Positive immunostaining for FAT1 cadherin was observed in 5 (100%) in DCIS and 1 (20%) in Immunohistochemistry
Anti-FAT1 antibody produced in rabbit was pur-chased from Sigma-Aldrich. Immunohistoche- mistry for FAT1 was performed with the stan-dard streptavidin-biotin complex method with 3,3’-diaminobenzidine (DAB) as the chromo-gen. Standard 5-μm sections were mounted on glass slides, deparaffinized and rehydrated with xylene and a series of grades of alcohol. Endogenous peroxidase was inactivated with 3% hydrogen peroxide for 5 minutes, following which the sections were washed in phosphate buffered saline (PBS) for 5 minutes. Antigen retrieval was conducted by heating in an auto-clave in citrate buffer (pH 6.0) for 4 minutes, and this was followed by cooling at room tem-perature and rinsing in PBS. Sections were blocked with 10% normal goat serum for 20 minutes and incubation with anti-FAT1 antibody (1:50 dilution; Sigma) was performed overnight at 4°C. Sections were incubated with biotin-conjugated secondary antibody for 30 minutes at 37°C, streptavidin-horseradish peroxidase for 20 minutes at 37°C, and color was devel-oped by incubation with 3,3’-diaminobenzidine (DAB). The last step was all the sections were counterstained with hematoxylin.
Staining evaluation
[image:3.612.92.288.96.207.2]The FAT1 protein expression was scored by two experienced pathologists independently, who were blinded to the clinicopathologic character-istics and in cases of disagreement, a consen-sus was reached after reviewing the staining result together. The location of immunoreactiv-ity, intensity and percentage of stained cells were determined in all cases. The staining intensity was categorized into four grades (0-3): 0. no staining; 1. weak staining; 2. moderate staining; and 3. strong staining. The percent-age of positive cells was graded on an arbitrary
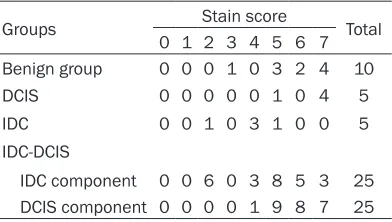
Table 2. FAT1 protein immunohistochemistry scores
Groups Stain score Total 0 1 2 3 4 5 6 7 Benign group 0 0 0 1 0 3 2 4 10 DCIS 0 0 0 0 0 1 0 4 5 IDC 0 0 1 0 3 1 0 0 5 IDC-DCIS
IDC, respectively. Fisher’s ex- act test revealed that the pos-itive proportion rate was sig-nificantly higher in DCIS group than in IDC group (P=0.048; Table 3).
Comparison between benign breast lesions and DCIS or IDC
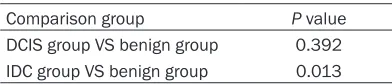
The scoring system incorpo-rating the percentage of posi-tive-staining tumor cells and the intensity of staining was applied to calculate the total score. Using ANOVA, we found that there was no significantly difference between the ben- ign group and the DCIS group (P=0.392; Table 4) and the FAT1 staining score was sig-nificantly lower in IDC group comparing with the benign group (P=0.013; Table 4).
DCIS-IDC
The DCIS components of the IDC-DCIS tumors displayed moderate to strong immuno-reactivity while the IDC com-ponents displayed weak to moderate immunoreactivity (Figure 1G and 1H). Positive result was observed in 25 (100%) in DCIS components and in 19 (76%) in IDC compo-nents. However, the total staining score between the two components was signifi -cantly different (P=0.002). Discussion
The FAT1 protein is one of the members of the Ca2+-depen- dent adhesion superfamily and it appears to have a dual role as both an oncogene as well as a tumor suppressor in different types of tumors [21-25]. In the present study, we used a specific anti-FAT1 anti -body to analyze the FAT1 ex- pression in benign and malig-Figure 1. (A) Shows the HE staining in breast benign lesions and (B) shows
the Immunohistochemical staining of FAT1 in breast benign lesions. Magnifi -cation: 400×. (C) Shows the HE staining in DCIS and (D) shows the
Immuno-histochemical staining of FAT1 in DCIS. Magnification: 400×. (E) Shows the
HE staining in IDC and (F) shows the Immunohistochemical staining of FAT1
[image:4.612.90.377.70.648.2]FAT1 gene in cancer development and progres-sion directly. Our findings demonstrated FAT1 protein was down-regulated from DCIS to IDC in concordance with another previous study [13]. As FAT1 gene is a protein coding gene, the protein level change represents the genetic change. All the results may be explained by the tumor suppressive function of FAT1. Morris et al. predicted that the inactivation of FAT1 may converge to uncheck Wnt/b-catenin signaling which can drive cancer development [30]. Ne- vertheless, what makes the FAT1 protein down-regulated and by which the Wnt/β-catenin pathway is activated are still unknown. We acknowledge that our current study has several limitations and the most prominent problem is the small data set. Because of the small data, we also didn’t find any relationship between FAT1 expression level and clinicopathologic characteristics such as ER, PR, HER2, Ki67, lymph node involvement and so on. The next steps what we should take include collecting more patients and creating an animal model to figure out the function of FAT1.
Breast cancer is acknowledged as a heteroge-neous disease [31] and DCIS is the most com-mon non-invasive type of breast cancer. Until now, it is unclear when and how the DCIS will develop into IDC at the molecular level. The pur-pose of treating DCIS is to prevent it evolving into IDC. Wong et al. thought IDC co-existing with DCIS was characterized by lower prolifera-tion and metastatic potential than size-matched pure IDC [27]. Similarly, Dieterich et al. made a conclusion that IDC accompanied by DCIS was associated with lower local recurrence than IDC alone [26]. From the above studies, we can say IDC-DCIS tends to have lower disease aggres-siveness than pure IDC. Notwithstanding, the current systemic treatment of IDC-DCIS de- pends entirely on the pathological and molecu-lar characteristics of IDC. As IDC-DCIS doesn’t behave identically to pure IDC, the disparity between the two groups may have significant influence on the systematic adjuvant treat -ment. DCIS is also a heterogeneous disease like invasive breast cancer, the same type of DCIS must possess potential biological differ-ences which make some to remain stable and the others to progress. Our study showed a general decrease tendency from benign lesions and DCIS to IDC about FAT1 expression and FAT1 cadherin can be identified as a new bio -we found that FAT1 cadherin was expressed by
both neoplastic and non-neoplastic mammary epithelia. The breast benign lesions group and DCIS group all showed moderate to strong expression intensity and high staining score. FAT1 cadherin expression was found to be not significantly changed in DCIS group in compari -son with the benign group (P=0.392). Com-paring with the DCIS group, expression in the IDC group appeared to be down-regulated. The staining intensity and the percentage of posi-tive cells in the IDC group was both apparently inferior to the DCIS group with a significant dif -ference for the positive rate between the two groups (P=0.048). In the IDC-DCIS group, the positive rate of IDC component (16/25) was much higher than the pure IDC group (1/5). Nevertheless, the total staining score of the IDC component was significantly lower than the score of the DCIS component (P=0.002).
[image:5.612.91.293.96.151.2]FAT1 expression was found to be not signifi -cantly changed in DCIS group compared with the benign group, which represented the pro-tein didn’t change in early stage of breast can-cer development. But the high levels of protein expression in samples of DCIS versus low lev-els of expression in IDC indicated that the FAT1 protein changed in late stage of breast cancer development. In the previous study of FAT1 cad-herin immunoexpression in human breast tis-sues [29], the authors compared the different expressions only between the pure IDC and pure DCIS group. However, our study also included non-malignant breast lesions and the tumors which had the DCIS and IDC component simultaneously. Comparing the FAT1 cadherin expression between DCIS and IDC in the same tumor can help us learn more about the role of
Table 3. FAT1 protein immunohistochemistry results in DCIS and IDC
FAT1
immunohistochemistry
DCIS IDC P Value NO % N0 %
[image:5.612.90.286.195.237.2]Positive 5 100 1 20 0.048 Negative 0 0 4 80
Table 4. Comparison between Benign breast lesions and DCIS or IDC
the emergence of diversity during breast can-cer evolution. Clin Cancan-cer Res 2008; 14: 370-378.
[5] Allred DC, Mohsin SK and Fuqua SA. Histologi-cal and biologiHistologi-cal evolution of human prema-lignant breast disease. Endocr Relat Cancer 2001; 8: 47-61.
[6] Steinman S, Wang JM, Bourne P, Yang Q and Tang P. Expression of cytokeratin markers, ER-alpha, PR, HER-2/neu, and EGFR in pure duc-tal carcinoma in situ (DCIS) and DCIS with co-existing invasive ductal carcinoma (IDC) of the breast. Ann Clin Lab Sci 2007; 37: 127-134. [7] Alexe G, Dalgin GS, Ganesan S, Delisi C and
Bhanot G. Analysis of breast cancer progres-sion using principal component analysis and clustering. J Biosciences 2007; 32: 1027-1039.
[8] Iakovlev VV, Arneson NC, Wong V, Wang CJ, Leung S, Iakovleva G, Warren K, Pintilie M and Done SJ. Genomic differences between pure ductal carcinoma in situ of the breast and that associated with invasive disease: a calibrated aCGH study. Clin Cancer Res 2008; 14: 4446-4454.
[9] Wong H, Lau S, Yau T, Cheung P and Epstein RJ. Presence of an in situ component is associ-ated with reduced biological aggressiveness of size-matched invasive breast cancer. Brit J Cancer 2010; 102: 1391-1396.
[10] Hollstein M, Sidransky D, Vogelstein B and Har-ris CC. p53 mutations in human cancers. Sci-ence 1991; 253: 49-53.
[11] Koboldt DC, Fulton RS, McLellan MD, Schmidt H, Kalicki-Veizer J, McMichael JF, Fulton LL, Dooling DJ, Ding L, Mardis ER, Wilson RK, Ally
A, Balasundaram M, Butterfield YS, Carlsen R,
Carter C, Chu A, Chuah E, Chun HJ and Coope RJ; Cancer Genome Atlas Network. Compre-hensive molecular portraits of human breast tumours. Nature 2012; 490: 61-70.
[12] Venkitaraman AR. Cancer review: cancer sus-ceptibility and the functions of BRCA1 and BRCA2. Cell 2002; 108: 171-182.
[13] Lee S, Stewart S, Nagtegaal I, Luo JQ, Wu Y, Colditz G, Medina D and Allred DC. Differen-tially expressed genes regulating the progres-sion of ductal carcinoma in situ to invasive breast cancer. Cancer Res 2012; 72: 4574-4586.
[14] Hou L, Chen M, Wang M, Cui X, Gao Y, Xing T, Li J, Deng S, Hu J, Yang H and Jiang J. Systematic analyses of key genes and pathways in the de-velopment of invasive breast cancer. Gene 2016; 593: 1-12.
[15] Gao YX, Niu Y, Wang XW, Wei L and Lu S.
Ge-netic changes at specific stages of breast can -cer progression detected by comparative ge-nomic hybridization. J Mol Med 2009; 87: 145-152.
marker in clinical practice. It is possible that through further study of FAT1 genetic muta-tions and the related altered pathways we can identify some specific defects which can be used as a potential therapeutic target spot for breast cancer.
In conclusion, this study tries to make it clear the role of FAT1 gene in breast cancer develop-ment. As the tumor occurrence is mainly caused by the dysregulation of some important genes, it is popular to study the gene mutations in can-cer development. FAT1 gene is one of the key genes which had been found. Considering the small data set of our study, we can add the FAT1 cadherin into the conventional biomark-ers like ER, PR, Ki67 and HER2 to get more information about the expression in different breast lesions. Future work is needed to iden-tify the critical genes and biological processes specifically or commonly changed in DCIS and IDC.
Acknowledgements
This work was supported by the National Na- tural Science Foundation of China (grant num-ber 81502287).
Disclosure of conflict of interest
None.
Address correspondence to: Ya-Nan Zhang, Breast Disease Center, Zhongda Hospital, Southeast Uni- versity, 87 Ding Jia Qiao, Nanjing 210009, China. Tel: +86 25 83262313; E-mail: zhangyanan79@126. com
References
[1] Cheng WQ, Zheng RS, Baade PD, Zhang SW, Zeng HM, Bray F, Jemal A, Yu XQ, He J. Cancer statistics in China, 2015. CA Cancer J Clin 2016; 66: 115-132.
[2] DeSantis CE, Fedewa SA, Sauer AG, Kramer JL, Smith RA, Jemal A. Breast cancer statistics, 2015: convergence of incidence rates bet- ween black and white women. CA Cancer J Clin 2016; 66: 31-42.
[3] Allred DC and Mohsin SK. Biological features of premalignant disease in the human breast disease. J Mammary Gland Biol 2000; 5: 351-364.
[24] Cancer Genome Atlas Network. Comprehen-sive genomic characterization of head and neck squamous cell carcinomas. Nature 2015; 517: 576-582.
[25] Nakaya K, Yamagata HD, Arita N, Nakashiro Ki,
Nose M, Miki T and Hamakawa H. Identifica -tion of homozygous dele-tions of tumor sup-pressor gene FAT in oral cancer using CGH-ar-ray. Oncogene 2007; 26: 5300-5308.
[26] Dieterich M, Hartwig F, Stubert J, Klocking S, Kundt G, Stengel B, Reimer T and Gerber B. Accompanying DCIS in breast cancer patients with invasive ductal carcinoma is predictive of improved local recurrence-free survival. Breast 2014; 23: 346-351.
[27] WHO classification of tumours of the breast.
4th edition. In: Lakhani SR, Ellis IO, Schnitt SJ, Tan PH, van de Vijver MJ, editors. IARC Press; 2012.
[28] Singletary SE, Allred C, Ashley P, Bassett LW, Berry D, Bland KI, Borgen PI, Clark CG, Edge SB, Hayes DF, Hughes LL, Hutter RV, Morrow M, Page DL, Recht A, Theriault RL, Thor A, Weaver DL, Wieand HS and Greene FL. Revi-sion of the American joint committee on can-cer staging system for breast cancan-cer. J Clin Oncol 2002; 20: 3628-3636.
[29] Wang L, Lyu S, Wang S, Shen H, Niu F, Liu X, Liu J and Niu Y. Loss of FAT1 during the progres-sion from DCIS to IDC and predict poor clinical outcome in breast cancer. Exp Mol Pathol 2016; 100: 177-183.
[30] Morris LG, Kaufman AM, Gong YX, Ramaswami D, Walsh LA, Turcan S, Eng S, Kannan K, Zou YL, Peng LK, Banuchi VE, Paty P, Zeng ZS, Vaki-ani E, Solit D, Singh B, Ganly I, Liau L, Clough-esy TC, Mischel PS, Mellinghoff IK and Chan TA. Recurrent somatic mutation of FAT1 in mul-tiple human cancers leads to aberrant Wnt ac-tivation. Nat Genet 2013; 45: 253-261. [31] Polyak K. Heterogeneity in breast cancer. J Clin
Invest 2011; 121: 3786-3788. [16] Mahoney PA, Weber U, Onofrechuk P,
Biess-mann H, Bryant PJ and Goodman CS. The fat tumor suppressor gene in drosophila encodes a novel member of the cadherin gene super-family. Cell 1991; 67: 853-868.
[17] Katoh M. Function and cancer genomics of FAT family genes (review). Int J Oncol 2012; 41: 1913-1918.
[18] Katoh Y and Katoh M. Comparative integromics on FAT1, FAT2, FAT3 and FAT4. Int J Mol Med 2006; 18: 523-528.
[19] Dunne J, Hanby AM, Poulsom R, Jones TA, Sheer D, Chin WG, Ming Da S, Zhao Q, Beverley PCL and Owen MJ. Molecular cloning and tis-sue expression offat, the human homologue of thedrosophila fatgene that is located on chro-mosome 4q34-q35 and encodes a putative adhesion molecule. Genomics 1995; 30: 207-223.
[20] Tanoue T and Takeichi M. Mammalian Fat1 cadherin regulates actin dynamics and cell-cell contact. J Cell Biol 2004; 165: 517-528. [21] de Bock CE, Ardjmand A, Molloy TJ, Bone SM,
Johnstone D, Campbell DM, Shipman KL, Yeadon TM, Holst J, Spanevello MD, Nelmes G, Catchpoole DR, Lincz LF, Boyd AW, Burns GF and Thorne RF. The Fat1 cadherin is overex-pressed and an independent prognostic factor for survival in paired diagnosis-relapse sam-ples of precursor B-cell acute lymphoblastic leukemia. Leukemia 2012; 26: 918-926. [22] Dikshit B, Irshad K, Madan E, Aggarwal N,
Sarkar C, Chandra PS, Gupta DK, Chattopad-hyay P, Sinha S and Chosdol K. FAT1 acts as an
upstream regulator of oncogenic and inflam -matory pathways, via PDCD4, in glioma cells. Oncogene 2013; 32: 3798-3808.