JOURNAL OF FOREST SCIENCE, 63, 2017 (6): 275–281 doi: 10.17221/138/2016-JFS
Variability in leaf and crown morphology correlated
with light availability in five natural populations of
Quercus castaneifolia C.A. Mey
Fariba BABAEI
1, Seyed Gholamali JALALI
1*, Hormoz SOHRABI
1,
Anoshirvan SHIRVANY
21 Department of Forestry, Faculty of Natural Resources and Marine Sciences,
Tarbiat Modares University, Nour, Iran
2Department of Forestry, Faculty of Natural Resources, University of Tehran, Karaj, Iran
*Corresponding author: [email protected]
Abstract
Babaei F., Jalali S.G., Sohrabi H., Shirvany A. (2017): Variability in leaf and crown morphology correlated with light availability in five natural populations of Quercus castaneifolia C.A. Mey. J. For. Sci., 63: 275–281.
In this study, we investigate seedlings of Quercus castaneifolia C.A. Mey, from five different provenances for the research on leaf and crown morphological variations in relation to a light gradient under controlled conditions in a greenhouse. The results show that significant variations occurred in many parameters due to the effects of light availability. The seedling responses to low light include the proportional allocation of more biomass to leaves, leading to higher leaf mass, leaf area, crown area, specific leaf area and leaf area ratio, in contrast, the seedlings grown in high irradiance faced a high temperature resulting in higher transpiration. At this period, seedlings alter their leaf and crown size to prevent overheating. In this experiment, in spite of the same treatments in controlled conditions in a greenhouse, the seedlings from different provenances indicate different responses to light levels. It seems that the seedlings try to maximize their surface area for the intake of light as the most limiting resource in wet provenances. Such responses under the same treatment are adaptive strategies which allow oak seedlings to have the best function under stressed conditions. For Q. castaneifolia as a species with broad fundamental niches in Hyrcanian forests, these variations may be achieved by a combination of genotypic differentiation and phenotypic plasticity.
Keywords: plasticity; Hyrcanian forest; controlled conditions; leaf mass; leaf area; leaf area ratio
Leaves are important organs for photosynthesis and play an important role in survival and growth of a plant. Leaves react most sensitively to envi-ronmental factors such as soil moisture, nutrients and light (Roche et al. 2004; Sugiura, Tateno 2011); subsequently, the causal relationships be-tween leaf traits and various environmental factors can be recognized. The leaf shape and structure are defined mainly in a brief period of primary mor-phogenesis based on the possible role of reaction-diffusion systems and can be altered by the allome-tric expansion (Franks, Britton 2000; Dengler, Kang 2001).
Phenotypic plasticity also occurs to produce a range of leaf traits that are environmentally af-fected. Many previous studies have revealed that leaf physiognomy is an excellent tool for ecological studies and geometric measurement of leaf mor-phology is easy and interpretable, then it should receive much attention in future.
re-source, so in order to enhance light capture, more biomass is allocated proportionally to leaves, lead-ing to a higher leaf mass ratio, specific leaf area, leaf area ratio but less to roots. Wide crowns with a high leaf area are an effective strategy to reduce self-shading (Poorter 1999). In high irradiance, the radiation load is increased. Thus, a high tem-perature resulting in higher transpiration is a seri-ous problem for the seedlings. At this period, they invest more biomass into root mass to facilitate water uptake and to alter their leaf size to prevent overheating. The requirements for optimal leaf functioning often change in accordance with irra-diance. It is assumed that leaf traits with high plas-ticity to irradiance are more important for plant functioning in different light environments than traits with little or no plasticity (Rice, Bazzaz 1989; Rozendaal et al. 2006). Plasticity is usually defined as the differential response of a genotype to different environmental conditions (Rozendaal et al. 2006). The importance of plasticity also dif-fers among leaf traits. It was found that physiologi-cal traits show higher plasticity than morphologi-cal traits (Valladares et al. 2000; Bloor, Grubb 2004; Rozendaal et al. 2006).
In this study, we chose leaves from Quercus
casta-neifolia C. A. Mey, the chestnut oak from five
differ-ent provenances for the research of leaf morphologi-cal variations to a light gradient. Chestnut oak is one of the most valuable species in Hyrcanian forests (Sabeti 1994). These forests with a very unique cli-matic variation are a green belt stretching over the northern range of Alborz Mountain to the coast of the Caspian Sea (Rouhi-Moghaddam et al. 2008). It is characterized by various ecological conditions from 213 to 2,200 mm precipitation, zero to 5,671 m elevation. Precipitation decreases climatically zone-wise regularly from west to east (Domoers et al. 1998). This species is a light demanding decidu-ous tree, distributed either in pure or mixed popula-tions with hornbeam from the coastal plains to the highlands along the southern shore of the Caspian Sea from west to east (Sabeti 1994).
In this study, we want to answer these questions: how do chestnut oak leaves respond to a light gra-dient? Can seed provenance affect leaf light re-sponses? The experiment was conducted in con-trolled conditions in a greenhouse.
MATERIAL AND METHODS
Descriptions of collected provenances. To
con-duct this study, five provenances of chestnut oak were collected in the form of seeds along the pre-cipitation gradient from west to east of the Hyrca-nian forests (from 2,045 mm in the west to 488 mm in the east). The general characteristics of the stud-ied sites are shown in Table 1. This experiment was conducted in a greenhouse at the Faculty of Natural Resources and Marine Sciences of Tarbiat Modares University, situated within the Hyrcanian forests (36°34'54''N, 52°2'32''E, mean sea level: –22 m) in Mazandaran province (North of Iran).
Light regime treatment. To study the leaf
mor-phological response of chestnut oak seedlings to a light regime, seven different irradiances, i.e. 10, 20, 30, 50, 60, 70 and 100%, were considered. The in-ner space of the greenhouse was divided into six parts (as shade houses). Each part was approxi-mately 3.5 m long by 1.5 m wide and 2.2 m high. Then, the six specified irradiances were provided by covering the walls of the shade houses using lay-ers of neutral plastic, polyethylene, which transflay-ers 90% of full light, and covering the roofs with an increasing number of layers of neutral shade. Each extra layer intercepted 10% of the incoming light. Seedlings grown in the open area received a 100% irradiance level. Each irradiance level contained 150 oak seedlings from five provenances (30 seed-lings were placed randomly in the treatment for each provenance), plus 40 cm buffer at either of the northern and southern end to avoid edge effects. Photosynthetically active radiation measurements were done in the shade houses based on compari-sons of treatment vs. open sky instantaneous
read-Table 1. Characteristics of studied ecotypes (Pilembera – western provenance, Kelardasht, Lajim – central provenances, Kordkûy, Loveh – eastern provenances)
Province Provenances Altitude (m a.s.l) Coordinates Temperature* (°C) Rainfall* (mm)
Guilan Pilembera 650 37°34'25''N 49°01'40''E 15.1 2,045
[image:2.595.62.532.671.747.2]ings performed at noon at seedling height with an “SA” quantum sensor (LI-COR Biosciences, USA) (Bloor, Grubb 2004) (Table 2).
Growth treatment. Chestnut oak seeds were
collected from about 10 to 15 mature healthy trees with a diameter range of 40–50 cm, located in five provenances. Seeds were sown in plastic pots (15 × 10 cm) filled with one-third of forest top soil and two-thirds of river sand. The oak forest region near the study site was a source of the forest soil. The forest soil was used to provide a substrate with natural composition of macro- and micronutrients and the river sand provided a texture with adequate drainage, which allowed for daily watering of the seedlings and facilitated the harvest of the whole root system, including fine roots. After germina-tion in spring, in late March to early April, seedlings were positioned at a 10% irradiance level. Moving the seedlings to higher irradiance levels was car-ried out gradually to avoid bleaching or wilting in response to the transfer, and they were left to grow, and were watered twice weekly.
Sampling was carried out once the seedlings had been growing for nine months since germination (21 to 23 November). The crown length at two per-pendicular directions and the height of the inser-tion point of the lowest leaf were measured. The leaf size (area, perimeter, length, width, length to width ratio) in three seedlings was determined for all leaves along the stem with a CI-202 portable laser leaf area meter (CID, Inc., USA). After sam-pling, the seedling leaves were removed and oven-dried at 70°C for at least 48 h for estimating the leaf dry weight (Poorter 1999). Sampling was carried out from three randomly selected individuals of ev-ery provenance from evev-ery shade house. Detailed
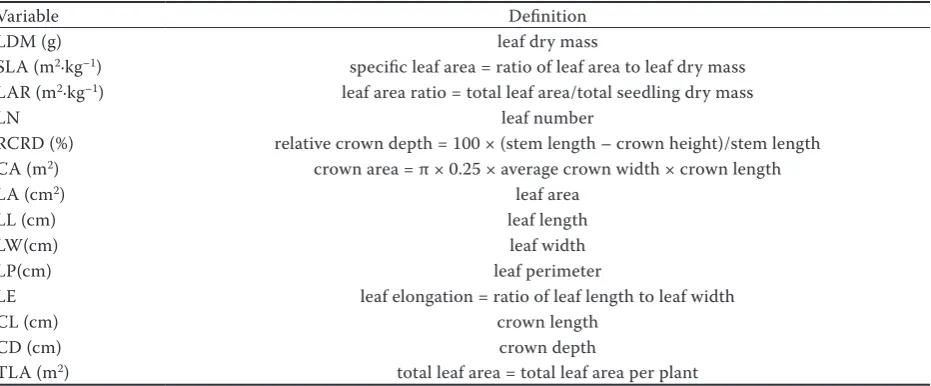
information on morphological parameter measure-ments and definitions is shown in Table 3.
Statistical analysis. Two-way ANOVA was used
to test the differences between the gradients of light and provenances in morphological parame-ters, using light treatment and provenances as fixed factors. All dependent variables were transformed to natural logarithms before analyses (Poorter 1999). Plasticity was calculated as the absolute dif-ference between the maximum trait value at one of the light levels and the minimum trait value at the other light level divided by the maximum value and multiplied by 100 (Valladares et al. 2000; Rozendaal et al. 2006). Total plasticity per prov-enance was expressed as the averaged plasticity of all leaf traits. Plasticity (Pl) was calculated by Eq. 1:
max trait value min trait value
Pl 100
max trait value
(1)
[image:3.595.305.531.99.203.2]All statistical analyses were performed by the SPSS software package (Version 17.0, 2008).
Table 3. Leaf morphological parameters and their definitions
Variable Definition
LDM (g) leaf dry mass
SLA (m2·kg–1) specific leaf area = ratio of leaf area to leaf dry mass LAR (m2·kg–1) leaf area ratio = total leaf area/total seedling dry mass
LN leaf number
RCRD (%) relative crown depth = 100 × (stem length – crown height)/stem length CA (m2) crown area = π × 0.25 × average crown width × crown length
LA (cm2) leaf area
LL (cm) leaf length
LW(cm) leaf width
LP(cm) leaf perimeter
LE leaf elongation = ratio of leaf length to leaf width
CL (cm) crown length
CD (cm) crown depth
[image:3.595.66.532.564.757.2]TLA (m2) total leaf area = total leaf area per plant
Table 2. Rank order of the treatment based on comparisons of treatment vs. open sky instantaneous readings made at noon at seedling height with a quantum sensor
Irradiance treatment (%) PAR (% of full daylight ± SE)
100 100.00* ± 0.00
70 70.40 ± 2.29
60 57.19 ± 2.21
50 49.12 ± 2.39
30 31.17 ± 3.42
20 19.62 ± 3.23
10 11.02 ± 0.56
RESULTS
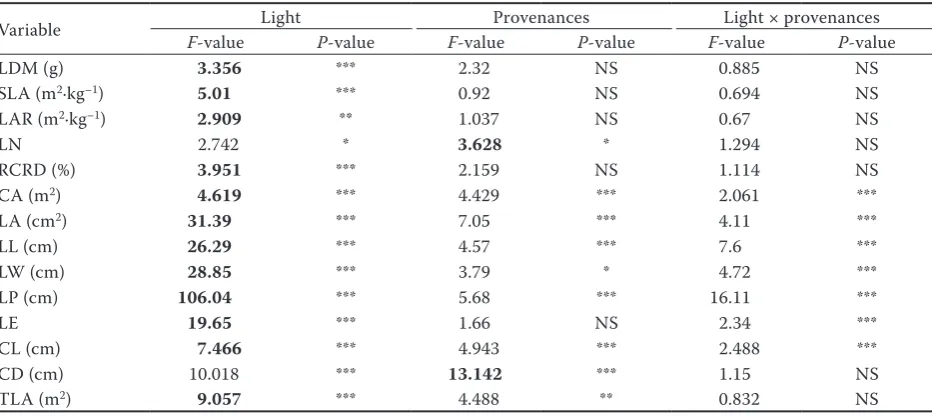
The results of the two-way ANOVA are given in Table 4 showing the effects of different gradients of light availability and provenances on leaf morpho-logical parameters. There was a significant varia-tion between provenances and light levels at the end of the experiment. Most parameters are influ-enced by light and provenances but, as indicated by the high F-values, the light levels were the most im-portant determinant of variation in leaf morphol-ogy. All parameters were significantly influenced by light levels except leaf number (LN) and crown depth (CD).
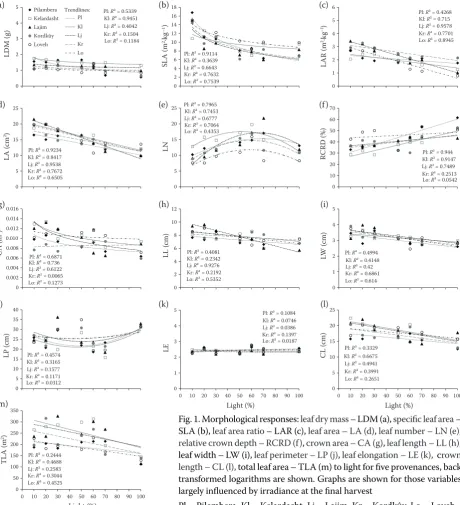
Graphs are shown of the corrected values for those variables largely influenced by light (Fig. 1). Most leaf morphological parameters were nega-tively correlated with light except relative crown depth (RCRD), other parameters such as leaf pe-rimeter (LP), leaf area (LA), leaf area ratio (LAR), leaf length (LL), leaf width (LW), crown length (CL) and total leaf area (TLA) decreased with light in a linear way, in contrast RCRD increased with light. Leaf dry mass (LDM), specific leaf area (SLA), crown area (CA), leaf elongation (LE) responses to light were logarithmic and LP showed a polynomial response to light.
In wet provenances the variations in LDM, LA, CA, RCRD, and CL were strongly correlated with light, but in dry provenances this relation gradually disappeared (refer to the coefficient of
determina-tion R2 in Fig. 1). In contrast, the relationship
be-tween light and LW was weak in wet provenances and became gradually stronger in dry ones.
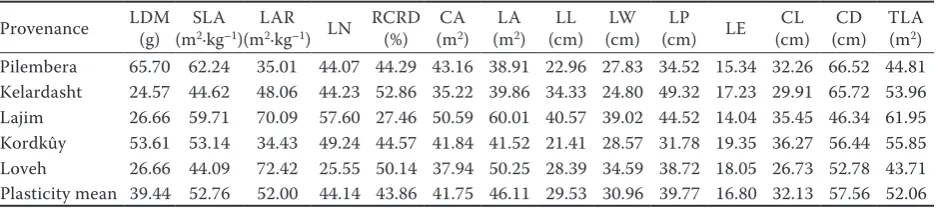
As Table 5 indicates, CD (Pl: 57.56%), SLA (Pl: 52.76%), TLA (Pl: 52.06%) and LAR (Pl: 52%) showed the highest plasticity and the lowest plas-ticity belonged to LE (Pl: 16.8%), LL (Pl: 29.53%) and LW (Pl: 30.96%).
DISCUSSION
[image:4.595.65.532.497.705.2]As the results show, most of the investigated vari-ables are strongly influenced by the light environ-ment (Table 4), indicating the importance of the irradiance effects on variables related to the varia-tion in leaf characteristics. Light is highly variable in the forest understorey (Bloor, Grubb 2004; Rozendaal et al. 2006) and the ability to respond to different light levels may be critical to seedling growth success. From many studies, leaves are very sensitive to changes in light levels and as re-sponding to it (Poorter 1999; James, Bell 2000; Bloor, Grubb 2004; Rozendaal et al. 2006; Xu et al. 2008; Kelly et al. 2009; Delagrange 2011). Seedling responses to low light include the propor-tional allocation of more biomass to leaves, leading to higher LDM, LA, SLA and LAR. By increasing the area of a given unit of leaf biomass, the inter-ception of light is increased under low-light condi-tions. Wide crowns with a large leaf area are also an
Table 4. Two-way ANOVA with light (n = 7) and provenances (n = 5) as fixed factors
Variable Light Provenances Light × provenances
F-value P-value F-value P-value F-value P-value
LDM (g) 3.356 *** 2.32 NS 0.885 NS
SLA (m2·kg–1) 5.01 *** 0.92 NS 0.694 NS
LAR (m2·kg–1) 2.909 ** 1.037 NS 0.67 NS
LN 2.742 * 3.628 * 1.294 NS
RCRD (%) 3.951 *** 2.159 NS 1.114 NS
CA (m2) 4.619 *** 4.429 *** 2.061 ***
LA (cm2) 31.39 *** 7.05 *** 4.11 ***
LL (cm) 26.29 *** 4.57 *** 7.6 ***
LW (cm) 28.85 *** 3.79 * 4.72 ***
LP (cm) 106.04 *** 5.68 *** 16.11 ***
LE 19.65 *** 1.66 NS 2.34 ***
CL (cm) 7.466 *** 4.943 *** 2.488 ***
CD (cm) 10.018 *** 13.142 *** 1.15 NS
TLA (m2) 9.057 *** 4.488 ** 0.832 NS
LDM – leaf dry mass, SLA – specific leaf area, LAR – leaf area ratio, LN – leaf number, RCRD – relative crown depth, CA – crown area, LA – leaf area, LL – leaf length, LW – leaf width, LP – leaf perimeter, LE – leaf elongation, CL – crown length, CD – crown depth, TLA – total leaf area, F values of factors having the largest effect on leaf variables are in bold,
effective strategy to reduce self-shading. Seedlings grown in high irradiance faced a high temperature resulting in higher transpiration which is a serious problem for their survival. At this period, seedlings alter their leaf size and RCRD to prevent overheat-ing leadoverheat-ing to a decrease in LA, TLA, LL, LW and LN. Leaf perimeter increased in high light to ex-change water vapour. These results are in line with Poorter (1999) and Fila and Sartorato (2011) studies.
Although all seedlings were exposed to the same treatments in controlled conditions in a green-house, as presented by R2, the variations in LDM,
LA, CA, RCRD, and CL were strongly correlated with light in wet provenances compared with the seedlings of the dry ones. In contrast, the rela-tionship between light and LW was weak in wet provenances and became gradually stronger in the dry ones. Changes in leaf and crown size as ma-jor factors dictating the light interception could be helpful for understanding seedling strategies in natural ecosystems. In general, plants growing in low-light environments have higher LA, LDM, CA and CL and lower RCRD than those growing in high-light environments regardless of func-tional groups. This issue could be explained by a
0 1 2 3 4 5 LD M (g ) Pilambera Kelardasht Lajim Kordkûy Loveh Pl Kl Lj Kr Lo 0 2 4 6 8 10 12 14 16 18 SL A (m
2·kg –1) 0 1 2 3 4 5 6 LA R (m 2·k g –1) 0 5 10 15 20 25 LA (c m 2) 0 5 10 15 20 25 LN 0 10 20 30 40 50 60 70 RC RD (%) 0 0.002 0.004 0.006 0.008 0.010 0.012 0.014 0.016 C A (m 2) 0 2 4 6 8 10 12 LL (c m ) 0 1 2 3 4 5 LW (c m ) 0 5 10 15 20 25 30 35 40 LP (c m ) 0 1 2 3 4 5
0 10 20 30 40 50 60 70 80 90 100
LE Light (%) 0 5 10 15 20 25
0 10 20 30 40 50 60 70 80 90 100
C L (c m ) Light (%) 0 50 100 150 200 250 300 350
0 10 20 30 40 50 60 70 80 90 100
TL
A
(m
2)
Light (%)
Trendlines: Pl: R² = 0.5339 Kl: R² = 0.9451 Lj: R² = 0.4042 Kr: R² = 0.1504 Lo: R² = 0.1184
Pl: R² = 0.9114 Kl: R² = 0.3639 Lj: R² = 0.6643 Kr: R² = 0.7632 Lo: R² = 0.7539
Pl: R² = 0.4268 Kl: R² = 0.715 Lj: R² = 0.9578 Kr: R² = 0.7701 Lo: R² = 0.8945
Pl: R² = 0.9234 Kl: R² = 0.8417 Lj: R² = 0.9538 Kr: R² = 0.7672 Lo: R² = 0.6505
Pl: R² = 0.7965 Kl: R² = 0.7453 Lj: R²= 0.6777 Kr: R² = 0.7064 Lo: R² = 0.4353
Pl: R²= 0.944 Kl: R² = 0.9147 Lj: R² = 0.7489 Kr: R² = 0.2513 Lo: R² = 0.0542
Pl: R² = 0.6871 Kl: R² = 0.736 Lj: R² = 0.6122 Kr: R² = 0.0065 Lo: R² = 0.1273
Pl: R² = 0.4081 Kl: R² = 0.2342 Lj: R² = 0.9276 Kr: R² = 0.2192 Lo: R² = 0.5352
Pl: R² = 0.4994 Kl: R² = 0.4148 Lj: R² = 0.42 Kr: R² = 0.6861 Lo: R² = 0.614
Pl: R² = 0.4574 Kl: R² = 0.3165 Lj: R² = 0.1577 Kr: R² = 0.1171 Lo: R² = 0.0312
Pl: R² = 0.1084 Kl: R² = 0.0746 Lj: R² = 0.0386 Kr: R² = 0.1397 Lo: R² = 0.0187
Pl: R² = 0.3329 Kl: R² = 0.6675 Lj: R² = 0.4941 Kr: R² = 0.3991 Lo: R² = 0.2651
[image:5.595.69.530.55.561.2]Pl: R² = 0.2444 Kl: R² = 0.4688 Lj: R² = 0.2583 Kr: R² = 0.3044 Lo: R² = 0.4525
Fig. 1. Morphological responses: leaf dry mass – LDM (a), specific leaf area – SLA (b), leaf area ratio – LAR (c), leaf area – LA (d), leaf number – LN (e), relative crown depth – RCRD (f), crown area – CA (g), leaf length – LL (h), leaf width – LW (i), leaf perimeter – LP (j), leaf elongation – LE (k), crown length – CL (l), total leaf area – TLA (m) to light for five provenances, back transformed logarithms are shown. Graphs are shown for those variables largely influenced by irradiance at the final harvest
Pl – Pilembera, Kl – Kelardasht, Lj – Lajim, Kr – Kordkûy, Lo – Loveh (a) (b) (c)
(d) (e) (f)
(g) (h) (i)
(j) (k) (l)
balanced growth hypothesis which predicts that, under a given regime of stresses, plants maximize their surface area for the intake of the most limit-ing resource (Markesteijn, Poorter 2009) such as water in dry provenances and irradiance in wet provenances. Adaptive strategies allow chestnut oak seedlings to have the best function under stressed conditions. For chestnut oak as a species with broad fundamental niches in Hyrcanian for-ests, variations in adaptive characteristics may be achieved by a combination of genotypic differen-tiation and phenotypic plasticity.
Plasticity was high (between 16.8 and 57.56%) for all morphological traits, and CD, SLA, TLA and LAR had the highest plasticity among all traits (Ta-ble 5). It was suggested that the leaf traits showing high plasticity in response to irradiance are more important to plant functioning in different light en-vironments than the traits that show low or no plas-ticity (Rice, Bazzaz 1989; Rozendaal et al. 2006). In our experiment, CD and LE indicated the highest and the lowest plasticity, respectively. This suggests that CD, SLA, TLA and LAR with high plasticity are most important for light acclimation compared to LE. Poorter (1999) and Bloor and Grubb (2004) reported high plasticity in leaf traits in response to irradiance in their studies on morphological plas-ticity and on growth responses to an irradiance gradient, in shade-tolerant tropical rainforest tree seedlings exposed to light changes, and in 15 rain forest tree species, respectively. Similar results have been reported in other studies (James, Bell 2000; Rozendaal et al. 2006; Davi et al. 2008; Xu et al. 2008; Kelly et al. 2009; Delagrange 2011). SLA is one of the main leaf traits that characterize the spe-cies adaptation to environmental conditions (Davi et al. 2008). Similar trends have been found for leaf morphological responses to irradiance in similar ex-periments (Bloor, Grubb 2004; Rozendaal et al. 2006; Fila, Sartorato 2011).
CONCLUSIONS
This paper has presented the data on the response of morphological characters of leaves and crowns
of Q. castaneifolia C.A. Mey seedlings originating
from five provenances to different light availability. Our experiment revealed that in spite of the same treatments in controlled conditions in a green-house, the seedlings from different provenances indicate different morphological responses to light levels. It seems that phenotypic plasticity helps this species to adapt itself and grow under different ecological conditions. Future work could investi-gate light availability and other environmental fac-tors in species with broad fundamental niches. This would allow the managers to plan applications of nature-based management of forests.
Acknowledgment
We are grateful to S. Azizi, and S. Gharemah-modli, for their help with harvesting and support-ing. B. Naseri is acknowledged for his help in col-lecting seeds.
References
Bloor J.M.G., Grubb P.J. (2004): Morphological plasticity of shade-tolerant tropical rainforest tree seedlings exposed to light changes. Functional Ecology, 18: 337–348. Davi H., Barbaroux C., Dufrêne E., Françoisa C., Montpied
P., Bréda N. (2008): Modelling leaf mass per area in for-est canopy as affected by prevailing radiation conditions. Ecological Modelling, 211: 339–349.
[image:6.595.64.533.73.177.2]Delagrange S. (2011): Light- and seasonal-induced plasticity in leaf morphology, N partitioning and photosynthetic ca-pacity of two temperate deciduous species. Environmental and Experimental Botany, 70: 1–10.
Table 5. Plasticity of estimated parameters in five different provenances
Dengler N., Kang J. (2001): Vascular patterning and leaf shape. Current Opinion in Plant Biology, 4: 50–56.
Domoers M., Kaviani M., Schaefer D. (1998): An analysis of regional and intra-annual precipitation variability over Iran using multivariate statistical methods. Theoretical and Applied Climatology, 61: 151–159.
Fila G., Sartorato I. (2011): Using leaf mass per area as pre-dictor of light interception and absorption in crop/weed monoculture or mixed stands. Agricultural and Forest Meteorology, 151: 575–584.
Franks N.R., Britton N.F. (2000): The possible role of reaction-diffusion in leaf shape. Proceedings of the Royal Society B: Biological Sciences, 267: 1295–1300.
James S.A., Bell D.T. (2000): Influence of light availability on leaf structure and growth of two Eucalyptus globulus ssp.
globulus provenances. Tree Physiology, 20: 1007–1018. Kelly J., Jose S., Nichols J.D., Bristow M. (2009): Growth and
physiological response of six Australian rainforest tree species to a light gradient. Forest Ecology and Manage-ment, 257: 287–293.
Markesteijn L., Poorter L. (2009): Seedling root morphology and biomass allocation of 62 tropical tree species in rela-tion to drought and shade tolerance. Journal of Ecology, 97: 311–325.
Poorter L. (1999): Growth response of 15 rain-forest tree species to a light gradient: The relative importance of morphological and physiological traits. Functional Ecol-ogy, 13: 396–410.
Rice S.A., Bazzaz F.A. (1989): Growth consequences of plasticity of plant traits in response to light conditions. Oecologia, 78: 508–512.
Roche P., Diaz-Burlinson N., Gachet S. (2004): Congruency analysis of species ranking based on leaf traits: Which traits are the more reliable? Plant Ecology, 174: 37–48.
Rouhi-Moghaddam E., Hosseini S.M., Ebrahimi E., Tabari M., Rahmani A. (2008): Comparision of growth, nutrition and soil properties of pure stand of Quercuscastaneifolia and mixed with Zelkova carpinifolia in the Hyrcanian forests of Iran. Forest Ecology and Management, 255: 1149–1160. Rozendaal D.M.A., Hurtado V.H., Poorter L. (2006): Plastic-ity in leaf traits of 38 tropical tree species in response to light; relationships with light demand and adult stature. Functional Ecology, 20: 207–216.
Sabeti H. (1994): Forests, Trees and Shrubs of Iran. Yazd, Yazd University Press: 886.
Sugiura D., Tateno M. (2011): Optimal leaf-to-root ratio and leaf nitrogen content determined by light and nitrogen availabilities. PLoS ONE, 6: e22236.
Valladares F., Martinez-Ferri E., Balaguer L., Perez-Corona E., Manrique E. (2000): Low leaf-level response to light and nutrients in Mediterranean evergreen oaks: A conserva-tive resource-use strategy? New Phytologist, 148: 79–91. Xu F., Guo W., Xu W., Wang R. (2008): Habitat effects on
leaf morphological plasticity in Quercus acutissima. Acta Biologica Cracoviensia Series Botanica, 50: 19–26.