Using the Loess Method to Describe the effect
of Temperature on Development Rate
Junhe Liu 1, Yan Yan 2, Mingfu Yu 1, Megha n. ParaJuLee 3 †, Peijian Shi 4*, Jiayang Liu 1* and Zihua Zhao 5*
1Department of Biological engineering, huanghuai university, Zhumadian, henan, P.r. China; 2Landscape research institutes of Zhumadian, Zhumadian, henan, China; 3Texas a & M agriLife
research and extension Center, Lubbock, Texas, uSa; 4Collaborative innovation Center of Sustainable Forestry in Southern China of Jiangsu Province, nanjing Forestry university, Xuanwu District nanjing, P.r. China; 5Department of entomology, College of Plant Protection,
China agricultural university, Beijing, P.r China
*Corresponding authors: [email protected]; [email protected]; [email protected]
Abstract
Liu J., Yan Y., Yu M., Parajulee† M.N., Shi P., Liu J., Zhao Z.(2017): Using the LoeSS method to describe the effect of temperature on development rate. Plant Protect. Sci., 53: 226–231.
Temperature has a significant influence on development rates of insects and mites. Many parametric models were built to describe the temperature-dependent development rates. However, these models provided different shapes of the curves of development rate versus temperature. For different datasets, investigators have to spend much time on considering which the parametric model is the best for describing the temperature-dependent development rates. In the present study, we encourage investigators to use an important non-parametric model, the LoeSS method, which belongs to local regression methods. The LoeSS method is used to fit some published data on the development rate of aphids to check the goodness-of-fit. We find that the LoeSS method is very flexible for fitting the given datasets. Thus, we consider that the LoeSS method can be used to describe the effect of temperature on the development rate of insects or mites.
Keywords: non-parametric model; local regression; weighted least squares; Aphididae
In general, one insect or mite species needs to expe-rience different developmental stages in its lifecycle. Completing each developmental stage requires a period of time, which is referred to as development time (or development duration). The reciprocal characteristic of development time is referred to as development rate. It has been demonstrated that temperature has a strong influence on development rate (Campbell et al. 1974; Taylor 1981). Development rate is regarded as a linear function of temperature over the range of moderate temperatures (Campbell et al. 1974; Zhao
et al. 2012). However, this linear relationship between development rate and temperature does not fit if tem-peratures were not in this range. Several non-linear models have been developed for describing the effect
of temperature on development rate (e.g., Logan et al. 1976; Sharpe & DeMichele 1977; Schoolfield
et al. 1981; Taylor 1981; Wang et al. 1982; Lactin
et al. 1995; Brière et al. 1999; Ikemoto 2005, 2008; Shi et al. 2011a, b). These non-linear models are like a two-sided sword: (1) they represent abundant tools for describing the temperature-dependent development rates; (2) it takes to spend much time on choosing one among so many models. Although some comparative studies were done to recommend the best of these models (e.g., Smits et al. 2003; Kontodimas et al. 2004; Kim et al. 2009; Shi & Ge 2010), these studies did not draw a corresponding conclusion yet.
rates of different insects and mites. That is, a single universal non-linear model used to describe the temperature-dependent development rates of all species of insects and mites might be impossible. The majority of the investigators usually choose models based on the data in practice. It is necessary to point out that all the non-linear models built for describ-ing the temperature-dependent development rates are parametric models. The shape of the curve of a parametric model is known when its formulation is given. However, sometimes these models do not fit the experimental development rate data very well. It seems that those data are authentic although there are probably some small experimental errors. For example, it is found that the aforementioned non-linear parametric models are not applicable to the development rate data of the cabbage beetle, Colap-hellus bowringi Baly (Coleoptera: Chrysomelidae), at eight temperatures ranging from 16°C to 30°C (Kuang et al. 2011). The mortality of this insect species at every temperature excluding 30°C is low (lower than 50% for the egg, pupal and larval stage). However, temperature dependent development models are not intended to predict or account for mortality, only the rate of development with respect to tempera-ture. Since all non-linear models are chosen mainly according to whether they can fit the data well, some non-parametric fitting methods, such as local regres-sion models (Cleveland et al. 1991; Loader 1999; Zhao et al. 2013) and generalised additive models (Hastie & Tibshirani 1990), can reflect the rela-tionship between development rate and temperature. We need not know the strict formulation before using these models to fit the data. And these models will provide the fitted results only according to the data themselves. Thus, non-parametric models are in fact considered to let the data speak. It indicates that we need not to know the complex mechanism of the effect of temperature on development rate but we can use a non-parametric model to reflect the relationship between development data and temperature very well. Frankly speaking, although the Sharpe-School-field-Ikemoto model (Sharpe & DeMichele 1977; Schoolfield et al. 1981; Ikemoto 2005, 2008; Shi
et al. 2011b) and another model proposed recently by Ratkowsky et al. (2005) based on thermodynamics have perfectly combined the temperature-dependent development rates to the probability of an enzyme be-ing in the active state, the mechanisms of temperature
on the enzymes that control development and the types of these controlling enzymes are still unknown. Therefore, it is necessary to use a non-parametric fitting method. In the present study, we employ an important local regression model, LoeSS (Cleveland 1979; Cleveland et al. 1991; Jacoby 2000), to depict the effect of temperature on development rate.
MATeRiAL AnD MeThoDs(1)
The LoeSS method was pioneered by Cleveland (1979), Cleveland et al. (1988), Cleveland and Grosse (1991). Suppose ri for i = 1 to n are observed development rates. Suppose Ti for i = 1 to n are observed temperatures. The local regression model related to the temperature-dependent development rates can be described as:
ri = g (Ti) + εi (1)
where: g(•) – smooth function of T; εi – random variables with mean 0 and variance σ2
Let ˆri represent an esti≤mate of ri , Ti is the daily average temperature, i is daily temperature.
Let Δk(Ti)denote the euclidean distance of Ti to
Tk. Let Δ(k)(Ti) denote the values of these distances ordered from smallest to largest, and let
T(u) =
{
(1 – u3)3 for 0 ≤ u < 1 (2) 0 for u ≥ 1denote the weight function.
Local regression requires a smoothing parameter,
α (α ≤1). And the integer obtained from truncating
α•n represents the number of points used to perform each local regression. obviously, the parameter, α, limits the proportion of observations that is to be used in each local regression. Let q be that integer. We define a weight for (Tk, rk) by
wk(Ti) = T
(
Δk(Ti))
(3) Δ(q)(Ti)It decreases or remains constant as Tk increases in distance from Ti.
(1) For each i compute the estimates, ˆβij, j = 0 to d, of the parameters in a polynomial regression of degree d
of ri on Ti, which is fitted by weighted least squares with weight wk(Ti) for (Tk, rk), i.e., minimising:
n
Σ
wk(Ti)(
rk –Σ
d(
ˆβijTkj)
)
(4)k=1 j=0
Then we compute ˆri by
ˆ
ri =
Σ
d(
ˆβijT ij) =
Σ
n(
iik rk
)
(5)j=0 k=1
(2) Let B denote the bisquare weight function that is defined by
B(v) =
{
(1 – v2)2 for |v| < 1 (6) 0 for |v| ≥ 1Let
ei = ri – ˆri (7)
be the residuals from the current fitted values. Let s
be the median of the |ei|. Define robustness weights by
ζk = B(ek/6s) (8)
(3) Compute new ˆri for each i by fitting a dth degree polynomial using weighted least squares with weight ζk•wk(Ti) at (Tk, rk).
(4) Repeatedly execute steps 2 and 3 a total of t times. The final ˆri are robust locally weighted regres-sion fitted values.
We use the R package (http://www.r-project.org/) to carry out the LoeSS fitting. There are two outputs needed to explain in detail: equivalent number of parameters and residual standard error.
Let ˆ
r = Lr (9)
and let
δ1 = Trace (i – L)T (i – L) (10)
The definitions of these two outputs are:
equivalent number of parameters = Trace (LTL) (11) Residual standard error = (RSS/δ1)1/2 (12)
ResULTs AnD DiscUssion
In the present study, we used the LoeSS meth-od to fit some published development rate data of
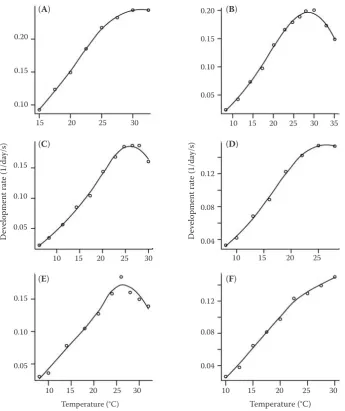
Aphididae (Table 1 and Figure 1). The LoeSS model can fit the data well, and it does not need a strict formulation before fitting the data. The coefficients of determination (i.e., r2) from sample A to sample F were 0.9993, 0.9971, 0.9967, 0.9980, 0.9851, and 0.9960, respectively. The curve shapes produced by the LoeSS method can be different. The curve shapes cannot be produced by a single parametric model, such as the logistic model or the performance model. We append the program for investigators to execute the LoeSS fitting. Just to use this program, we can use the LoeSS method to accurately describe the temperature-dependent development rates.
The advantages have been mentioned above for using the LoeSS method to describe the effect of temperature on development rate. The disadvan-tages of using it are two aspects: (1) it is easy to lead to the overfitting, i.e., it is very flexible that it can also fit some data with experimental errors; (2) it cannot be used to predict the lower developmental threshold (hereafter read as LDT) and the sum of effective temperatures (hereafter read as SeT) which are often estimated by a classical linear model. The classical linear model for describing the temperature-dependent development rates is:
r = a + bT + ε (13)
where: r – development rate; T – constant temperature;
a and b – constants; ε – random error item
The estimates of the LDT and SeT are defined by:
{
LˆDT = – ˆa / ˆb (14) SˆeT = – 1/ ˆbwhere: the letter ‘a’ with a ‘hat’ represents the estimate of respective lettering
The LDT denotes the temperature below which development rate equals zero. There is another tem-perature concept known as upper developmental threshold (UDT) beyond which development rates also equal zero, and that is similar to the LDT. Insects are supposed to develop between LDT and UDT. However, the LoeSS method based on the
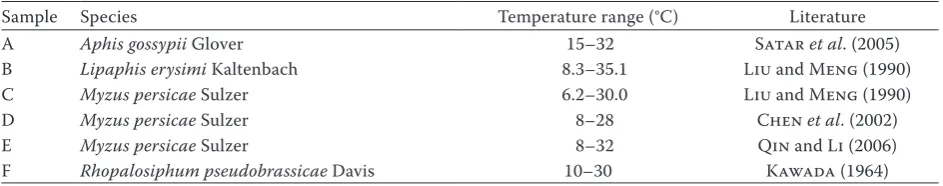
experi-Table 1. Summary of the cited data
Sample Species Temperature range (°C) Literature
A aphis gossypii Glover 15–32 Satar et al. (2005)
B Lipaphis erysimi Kaltenbach 8.3–35.1 Liu and Meng (1990)
C Myzus persicae Sulzer 6.2–30.0 Liu and Meng (1990)
D Myzus persicae Sulzer 8–28 Chen et al. (2002)
e Myzus persicae Sulzer 8–32 Qin and Li (2006)
[image:3.595.56.528.666.759.2]mental data cannot obtain these three parameters which are often used in entomology. It is necessary to point out that not all investigators believe in the existence of LDT, SeT, and UDT. And some believe only in one or two. We can find the evidence from the non-linear models. The Logan model assumes only the existence of UDT. If the investigators want to calculate the LDT, they have to use the linear model for its estimation (e.g., Bonato et al. 2007; eliopoulos et al. 2010). The Sharpe-Schoolfield-Ikemoto model assumes only the existence of LDT (Ikemoto 2005, 2008; Shi et al. 2011b). The Wang-Lan-Ding model (Wang et al. 1982), Lactin (Lactin
et al. 1995), and performance models (Shi & Ge 2010; Shi et al. 2011a) are models whereas the existence
of both LDT and UDT is assumed. In addition, the data presented in Figure 1 could conform well to other models, particularly those evaluated by Shi and Ge (2010).
[image:4.595.120.466.91.503.2]In summary, there are two debates about the exist-ence of LDT, SeT, and UDT. Then we cannot reject the use of the LoeSS method though it cannot be used to predict these three parameters (or theo-retical concepts in a sense). Investigators had better deliberately design the temperature range to make these temperatures meaningful for experiments. In this case, the LoeSS method can thoroughly show its advantages. For example, Liu and Meng (1990) carried out an experiment to explore the effect of temperature on the development of two species of
Figure 1. Comparison between the observations and predicted values by the loess method. Data source is shown in Table 1. The open circles represent the observations; and the solid lines represent the predicted values by the loess method. The smoothing parameter is defined as 0.75 for each sample
D
eve
lopmen
t ra
te (1/d
ay/s)
0.20
0.15
0.10
0.05
0.12
0.08
0.04
0.12
0.08
0.04 0.15
0.10
0.05 0.20
0.15
0.10
0.15
0.10
0.05
D
eve
lopmen
t ra
te (1/d
ay/s)
Temperature (°C) Temperature (°C)
10 15 20 25 30 35
10 15 20 25 30 10 15 20 25 30
10 15 20 25 30 15 20 25 30
10 15 20 25
(A)
(c)
(e)
(B)
(D)
aphids (Lipaphis erysimi Kaltenbach, Myzus persi-cae Sulzer). They set the temperature range from 6.2°C to 37.0°C. That should be enough, because the suitable temperatures for these two species of aphids to develop in nature should be in this tem-perature range. As an important non-parametric fitting method, it should be reasonable and feasible for us to use the LoeSS method to describe the effect of temperature on the development rate of insects or mites.
Acknowledgements. We thank Dr Takaya Ikemoto for providing us with one useful reference.
Appendix
Before using this program, we need to download the R package from http://www.r-project.org/. Then we type the following code in the R Console: T <- c(15, 17.5, 20, 22.5, 25, 27.5, 30, 32.5) D <- c(10.8, 8.1, 6.7, 5.4, 4.6, 4.3, 4.1, 4.1) T <- T[!is.na(T)]
D <- D[!is.na(D)] r <- 1/D
plot(T,r,xlab=expression(paste(“Temperature (“,degr ee,”C)”)),ylab=c(“Development rate (1/days)”),pch=1) r.loess <- loess(r~T,span=0.75,data.frame(T=T,r=r)) r.hat <- predict(r.loess,data.frame(T=T))
Rsquare <- 1-sum((r-r.hat)^2)/sum((r-mean(r))^2) T.predict <- seq(min(T),max(T),by=0.001)
r.predict <- predict(r.loess,data.frame(T=T.predict)) lines(T.predict,r.predict,col=1)
Here, T is a vector that is used to save the data of experimental temperatures; D is a vector that is used to save the data of development times. We take the data of Satar et al. (2005) as an example. Users can replace T and D with other data needed to be analysed. r is a vector that is used to save the observed development rates; r.hat is a vector that is used to save the predicted development rates by the LoeSS method at T; Rsquare is the coefficient of determination, as an indicator of goodness-of-fit; T.predict is a vector that is used to save the tempera-tures given by the users if they want to predict the development rates at these temperatures. Default of T.predict is the range from the lowest experimental temperature to the highest experimental tempera-ture by an increment of 0.001°C. r.predict is a vec-tor that is used to save the predicted development rates at T.predict.
References
Brière J.F., Pracros P., Le Roux A.Y., Pierre J.S. (1999): A novel rate model of temperature-dependent development for arthropods. environmental entomology, 28: 22–29. Bonato o., Lurette A., Vidal C., Fargues J. (2007):
Model-ling temperature-dependent bionomics of Bemisia tabaci (Q-biotype). Physiology entomology, 32: 50–55.
Campbell A., Frazer B.D., Gilbert N., Gutierrez A.P., Mackauer M. (1974): Temperature requirements of some aphids and their parasites. Journal of Applied ecology, 11: 431–438. Chen W., Cui Z., Li B. (2002): effect of temperature on
popu-lation parameters of Myzus persicae (Sulzer) (Homoptera: Aphididae). Hubei Agricultural Science,2: 68–69. (in Chi-nese)
Cleveland W.S. (1979): Robust locally weighted regression and smoothing scatterplots. Journal of the American Satistical Association, 74: 829–836.
Cleveland W.S., Grosse e. (1991): Computational methods for local regression. Statistics and Computing, 1: 47–62. Cleveland W.S., Devlin S.J., Grosse e. (1988): Regression by
local fitting: methods, properties, and computational algo-rithms. Journal of econometrics, 37: 87–114.
Cleveland W.S., Grosse e., Shyu W.M. (1991): Local regres-sion models. In: Chambers J.M., Hastie T.J. (eds): Statistical Models. London, Chapman & Hall: 309–376.
eliopoulos P.A., Kontodimas D.C., Stathas G.J. (2010): Temper-ature-dependent development of Chilocorus bipustulatus (Coleoptera: Coccinellidae). environmental entomology, 39: 1352–1358.
Hastie T.J., Tibshirani R.J. (1990): Generalized Additive Mod-els. London, Chapman & Hall.
Ikemoto T. (2005): Intrinsic optimum temperature for devel-opment of insects and mites. environmental entomology, 34: 1377–1387.
Ikemoto T. (2008): Tropical malaria does not mean hot en-vironments. Journal of Medical entomology, 45: 963–969. Jacoby W.G. (2000): Loess: a nonparametric, graphical tool
for depicting relationships between variables. electoral Studies, 19: 577–613.
Kawada K. (1964): The influence of constant temperature on the development, longevity and reproduction of the turnip aphid, rhopalosiphum pseudobrassicae Davis. Berichte des ohara Institutes für landwirtschaftliche Biologie, 12: 243–250.
Kim T., Ahn J., Lee J.H. (2009): Temperature-dependent de-velopmental model of neoseiulus californicus (McGregor) (Acari, P
hytoseiidae). Journal of Applied entomology, 133: 284–291. Kontodimas D.C., eliopoulos P.A., Stathas G.J, economou
devel-opment of nephus includens (Kirsch) and nephus bisig-natus (Boheman) (Coleoptera: Coccinellidae) preying on Planococcus citri (Risso) (Homoptera: Pseudococcidae): evaluation of a linear and various nonlinear models using specific criteria. environmental entomology, 33: 1–11. Kuang X., Parajulee M.N., Shi P., Ge F., Xue F. (2011):
Test-ing the rate isomorphy hypothesis usTest-ing five statistical methods.Insect Science,19: 121–128.
Lactin D.J., Holliday N.J., Johnson D.L., Craigen R. (1995): Improved rate model of temperature-dependent devel-opment by arthropods. environmental entomology, 24: 68–75.
Liu S., Meng X. (1990): The relationships between tempera-ture and development rates of Myzus persicae and Lipa-phis erysimi. Acta Phytophylacica Sinica, 17: 169–175. (in Chinese)
Loader C. (1999): Local Regression and Likelihood. New York, Springer.
Logan J.A., Wollkind D.J., Hoyt S.C., Tanigoshi L.K. (1976): An analytic model for description of temperature de-pendent rate phenomena in arthropods. environmental entomology, 5: 1133–1140.
Qin X., Li Z. (2006): effect of temperature on growth, de-velopment, reproduction and survival of Myzus persicae. Chinese Agricultural Science Bulletin, 22: 365–370. (in Chinese)
Ratkowsky D.A., olley J., Ross T. (2005): Unifying tem-perature effects on the growth rate of bacteria and the stability of globular proteins.Journal of Thermal Biology, 233: 351–362.
Satar S., Kersting U., Uygun N. (2005): effect of temperature on development and fecundity of aphis gossypii Glover (Homoptera: Aphididae) on cucumber. Journal of Pest Science, 78: 133–137.
Schoolfield R.M., Sharpe P.J.H., Magnuson C.e. (1981): Non-linear regression of biological
temperature-depend-ent rate models based on absolute reaction-rate theory. Journal of Thermal Biology, 88: 719–731.
Sharpe P.J.H., DeMichele D.W. (1977): Reaction kinetics of poikilotherm development. Journal of Thermal Biology, 64: 649–670.
Shi P., Ge F. (2010): A comparison of different thermal performance functions describing temperature-depend-ent developmtemperature-depend-ent rates. Journal of Thermal Biology, 35: 225–231.
Shi P., Ge F., Sun Y., Chen C. (2011a): A simple model for describing the effect of temperature on insect develop-ment rate. Journal of Asia-Pacific entomology, 14: 15–20. Shi P., Ikemoto T., egami C., Ge F., Sun Y., Cao H. (2011b):
A modified program for estimating the parameters of the SSI model. environmental entomology,40: 462–469. Smits N., Brière J.F., Fargues J. (2003): Comparison of non-linear temperature-dependent development rate models applied to in vitro growth of entomopathogenic fungi. Mycological Research, 107: 1476–1484.
Taylor F. (1981): ecology and evolution of physiological time in sects. American Naturalist, 117: 1–23.
Wang R.S., Lan Z.X., Ding Y.Q. (1982): Studies on math-ematical models of the relationship between insect de-velopment and temperature. Acta ecologica Sinica, 2: 47–57. (in Chinese)
Zhao Z.H., He D.H., Hui C. (2012): From the inverse den-sity-area relationship to the minimum patch size of a host-parasitoid system. ecological Research, 27: 303–308. Zhao Z.H., Guan X.Q., He D.H., Ge F. (2013): Species com-position and diversity of parasitoids and hyper-parasi-toids in different wheat agro-farming systems. Journal of Insect Science, 13 (162): 1–8. doi: 10.1673/031.013.16201