CGH-based microarray detection of cryptic and novel
copy number alterations and balanced translocations
in cytogenetically abnormal cases of b-cell all
Roger A. Schultz1*, Karen Tsuchiya2, Aubry Furrow1, Marilyn L. Slovak3, Lisa D. McDaniel1, Meaghan Wall4, Eric Crawford5, Yi Ning6, Reza Saleki7, Min Fang8, Victoria Cawich1,
Caitlin E. Johnson1, Sara L. Minier1, Nicholas J. Neill9, S. Annie Morton1, Steve Byerly10, Urvashi Surti11,Theresa C. Brown12, Blake C. Ballif10, Lisa G. Shaffer10
1Signature Genomic Laboratories, PerkinElmer, Inc., Spokane, USA; *Corresponding Author: [email protected] 2Seattle Children’s Hospital, Seattle, USA
3Sonora Quest Laboratories, Tempe, USA
4Victorian Cancer Cytogenetics Service, St. Vincent’s Hospital Melbourne, Fitzroy, Australia 5Genetics Associates, Inc., Nashville, USA
6Johns Hopkins University School of Medicine, Baltimore, USA 7Pathology Associates Medical Laboratories (PAML), Spokane, USA 8Fred Hutchinson Cancer Research Center, Seattle, USA
9Department of Molecular and Human Genetics, Baylor College of Medicine, Houston, USA 10Paw Print Genetics, Genetic Veterinary Sciences, Inc., Spokane, USA
11Magee-Womens Hospital, University of Pittsburgh Medical Center, Pittsburgh, USA 12Empire Genomics, Buffalo, USA
Received 14 March 2013; revised 2 April 2013; accepted 15 May 2013
Copyright © 2013 Roger A. Schultz et al. This is an open access article distributed under the Creative Commons Attribution License, which permits unrestricted use, distribution, and reproduction in any medium, provided the original work is properly cited.
ABSTRACT
Acute lymphoblastic leukemia (ALL) is the most common malignancy in children, with the ma- jority of cases being of precursor B-cell phenol- type. Conventional cytogenetic analysis plays an important role in the diagnosis of B-cell ALL, identifying characteristic chromosomal abnor- malities associated with a given prognosis there- in facilitating optimized treatment. The more re- cent introduction of microarray technology to the analysis of B-cell ALL has afforded both higher resolution for the detection of known ab- normalities and an ability to identify novel copy number abnormalities (CNAs) with potential cli- nical relevance. In the current study, microarray analysis was performed on 20 cytogenetically abnormal B-cell ALL cases (10 pediatric and 10 adult), while a novel microarray-based balanced- translocation detection methodology (transloca- tion CGH or tCGH) was applied to that subset of cases with a known or suspected recurrent balan- ced translocation. Standard microarray analysis identified that CNAs was not detected by previ- ous conventional cytogenetics in 75% (15/20)
cases. tCGH identified 9/9 (100%) balanced tran- slocations defining BCR/ABL1 (x4), ETV6/RUNX1 (x3), and MLL/AFF1 (x2) breakpoints with high re- solution. The results illustrate the improved mo- lecular detail afforded by these technologies and a comparison of translocation breakpoints, CNAs and patient age offers new insights into tumor biology with potential prognostic significance.
Keywords:Acute Lymphoblastic Leukemia;
B-Cell ALL; Microarray; Balanced Translocation; Translocation CGH; Hematologic Malignancies
1. INTRODUCTION
rearrangements, and hypodiploidy are associated with a poor prognosis [8]. In contrast, hyperdiploidy, particu- larly involving gains of chromosomes 4 and 10, and the t (12;21) (p13;q22) resulting in ETV6/RUNX1 fusion, are
associated with a good prognosis [8]. However, some cases of B-cell ALL lack alterations detectable by con- ventional cytogenetics and, importantly, some patients with favorable cytogenetic alterations still relapse, which may indicate that that there are additional undetected chro- mosome aberrations [9].
In recent years, genomic profiling of B-cell ALL using newer technologies has uncovered additional genetic al- terations that cannot be detected by conventional cytoge- netics [10-12]. Common alterations include genes invol- ved in the regulation of B-cell development and differen- tiation (PAX5, IKZF1, EBF1, LEF1 and TCF3), cell cy-
cle regulation and tumor suppression (CDKN2A, RB1
and PTEN), and lymphoid signaling (CD200, BTLA, and CRLF2) [10-16]. Many of these alterations are submit-
croscopic deletions that can be identified using high- density oligonucleotide comparative genomic hybridiza- tion (CGH)-based microarrays (aCGH) and single nucle- otide polymorphism (SNP) microarrays. These novel fin- dings have not only led to insights concerning the boil- ogy of B-cell ALL, but some have also been shown to be predictors of high-risk disease and have potential as fu- ture therapeutic targets. For example, deletions of IKZF1,
often too small to be detected by fluorescence in situ
hybridization (FISH), have been found to be a strong predictor of relapse [13,17]. Thus, it will be important in the clinical laboratory to employ technology with the capacity to identify these submicroscopic alterations that are below the resolution level of conventional cytoge- netics.
Microarray-based detection of copy number alterations (CNAs) has become standard of care for the diagnosis of most constitutional chromosomal imbalances in children with developmental disabilities [18], but its potential for the evaluation of neoplasia in the clinical laboratory has been compromised by the inability to detect balanced re- arrangements, which are important recurrent diagnostic and prognostic markers. To circumvent the limitation of balanced translocation detection, traditional microarray may be supplemented with routine karyotyping, selected FISH studies, targeted rtPCR analysis when appropriate, or a broader and more recently described technique of translocation array (tCGH)] [19,20]. This novel tech- nique couples linear amplification of genomic DNA us- ing multiplexed primer sets targeted to a set of transloca- tion breakpoint intervals with microarray analysis, per- mitting diagnostic detection of balanced translocations with unprecedented genomic resolution of the break- points. In the study presented here we characterize 20 cases of cytogenetically abnormal B-cell ALL by micro-
array analysis, including microarray analysis of putative translocations in 10 cases using a single tCGH assay de- signed to interrogate genomic DNA for the presence of 8 distinct translocations common in B-cell ALL. Joint ana- lysis of aCGH and tCGH results provides detailed reso- lution of CNAs and genomic breakpoints offering poten- tial new insights into tumor biology and prognostic sig- nificance.
2. MATERIALS AND METHODS
2.1. Specimen AscertainmentResidual bone marrow or leukemic peripheral blood was obtained after routine testing from seven clinical cytogenetic laboratories for DNA extraction. Routine G- banded chromosome analysis was performed in the re- ferring laboratories on all samples, and many cases were also analyzed by FISH as directed by standard clinical practice. The cases consisted of 13 bone marrow and four leukemic peripheral blood specimens at the time of initial diagnosis, one bone marrow three weeks after ini- tial diagnosis, and two bone marrow specimens at relapse. Ten cases were from pediatric patients (1 - 18 years old), and ten cases were from adults (25 - 73 years old). Sam- ples were de-identified for all information other than B-cell ALL indication for study, age, sex and prior cyto- genetic findings. Except as otherwise indicated, addi- tional specimen was not available for any post-analysis confirmatory studies. This study was conducted in ac- cordance to Signature Genomics’ Spokane-IRB approved protocol.
2.2. DNA Extraction
Genomic DNA was extracted from unenriched blood and bone marrow specimens using the Gentra Puregene Blood Kit (Qiagen, Germantown, MD) according to the manufacturer’s instructions. Two million cells or 150 µl (if cell counts were unavailable) of blood or bone mar- row were used as starting material. Additional Cell Lysis Solution (Gentra Puregene Blood Kit) was added to sam- ples with high viscosity to ensure complete lysis. Sam- ples were stabilized in Cell Lysis Solution within 24 to 48 hours of specimen receipt, when possible, to ensure high-quality DNA for use on the microarray.
2.3. Oligonucleotide Microarray Labeling Hybridization and Analysis
Array CGH for copy number analysis was performed using a 135K-feature whole-genome oligonucleotide mi- croarray (aCGH) (Signature OncoChip®, designed by
Signature Genomics, Spokane, WA; manufactured by Roche NimbleGen, Madison, WI). When compared to probe coverage over the rest of the genome, this micro- array has denser oligonucleotide coverage over 1893 cancer features, including genes with known roles in hematologic malignancies or solid tumors in which dele- tions or mutations had been previously reported, genes with suspected roles in cancer based on prior expression studies without specific evidence of genomic copy changes, genes with previously speculated roles based solely on association with a biological pathway or gene family, and genes involved in protein and microRNA (miRNA) coding. The microarray has an average coverage of one oligonucleotide per 0.2 - 7.0 kb for the targeted cancer features and genomic backbone coverage of one oligo- nucleotide per 35 kb. Labeling, hybridization, and wash- ing were performed using previously published methods [21]. Data were analyzed and displayed using custom oligonucleotide aCGH data analysis and visualization
software (Oncoglyphix®; Signature Genomics) as previ-
ously described [22]. Variants were identified based on the number of consecutive oligonucleotides involved and the magnitude in shift for the log2 ratio, with 5 - 99 oli- gonucleotides requiring a shift ≥ 0.300, 100 - 999 a shift ≥ 0.200, and a ≥ 1000 a shift ≥ 0.100.
2.4. Translocation CGH
For 10 of the 20 cases, prior chromosome and/or FISH analysis revealed evidence of a clinically relevant bal- anced translocation. For eight of those cases, transloca- tions were identified by karyotypes only, for one case by both FISH and karyotype, and for one case by FISH only. Nine of those 10 cases had sufficient DNA to be assessed by both aCGH and the translocation CGH array (tCGH). For one additional case (Case 10), aCGH revealed a break- point for a genomic copy gain within the MLL gene,
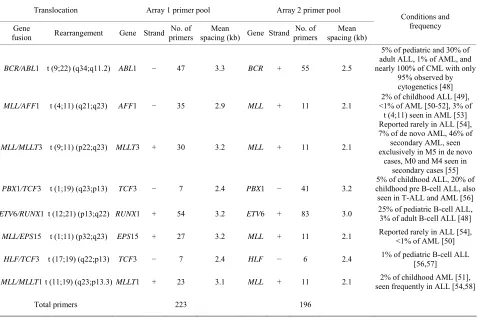
[image:3.595.60.537.420.740.2]raising suspicion of a putative translocation. Thus, case 10 was also evaluated by the tCGH technique, a micro- array strategy is based on linear amplification of the jun- ction between partner genes involved in balanced trans- locations [19,20]. For tCGH, cases were analyzed using a single multiplexed assay designed to detect eight possi- ble translocations (Table 1) that are all recurrent in B-cell
Table 1. Primer coverage in the multiplex tCGH assay designed to simultaneously detect eight different balanced translocations as- sociated with B-cell ALL.
Translocation Array 1 primer pool Array 2 primer pool
Gene
fusion Rearrangement Gene Strand primersNo. of spacing (kb)Mean Gene StrandprimersNo. of spacing (kb) Mean
Conditions and frequency
BCR/ABL1 t (9;22) (q34;q11.2) ABL1 − 47 3.3 BCR + 55 2.5
5% of pediatric and 30% of adult ALL, 1% of AML, and nearly 100% of CML with only
95% observed by cytogenetics [48]
MLL/AFF1 t (4;11) (q21;q23) AFF1 − 35 2.9 MLL + 11 2.1
2% of childhood ALL [49], <1% of AML [50-52], 3% of t (4;11) seen in AML [53]
MLL/MLLT3 t (9;11) (p22;q23) MLLT3 + 30 3.2 MLL + 11 2.1
Reported rarely in ALL [54], 7% of de novo AML, 46% of secondary AML, seen exclusively in M5 in de novo
cases, M0 and M4 seen in secondary cases [55]
PBX1/TCF3 t (1;19) (q23;p13) TCF3 − 7 2.4 PBX1 − 41 3.2
5% of childhood ALL, 20% of childhood pre B-cell ALL, also seen in T-ALL and AML [56]
ETV6/RUNX1 t (12;21) (p13;q22) RUNX1 + 54 3.2 ETV6 + 83 3.0 25% of pediatric B-cell ALL, 3% of adult B-cell ALL [48]
MLL/EPS15 t (1;11) (p32;q23) EPS15 + 27 3.2 MLL + 11 2.1 Reported rarely in ALL [54], <1% of AML [50]
HLF/TCF3 t (17;19) (q22;p13) TCF3 − 7 2.4 HLF − 6 2.4 1% of pediatric B-cell ALL [56,57]
MLL/MLLT1t (11;19) (q23;p13.3) MLLT1 + 23 3.1 MLL + 11 2.1 seen frequently in ALL [54,58]2% of childhood AML [51],
ALL. For each specimen tested, two separate linear am- plification reactions were performed using multiplex pri- mer pools designed to amplify one partner of each of the eight targeted balanced translocations (Table 1).
Unique DNA primers for genes of interest were de- signed using MacVector V11.1 (MacVector, Inc., Cary, NC) software with an average spacing of one primer every 2000 to 3500 bp. Primers were mixed into gene- specific and multiplexed reactions at a final concentra- tion of 200 nM for each primer. Linear amplification re- actions using 600 ng genomic DNA were performed us- ing the FailSafe PCR System with PreMix Choice using a single buffer (FailSafe PCR 2X PreMix D, Epicentre, Madison, WI) as described by the manufacturer, with 5% DMSO and a final reaction volume of 50 µl. After an initial denaturation at 94˚C for 2 minutes, reactions were amplified for 10 cycles with denaturation at 94˚C for 10 seconds, annealing at 62˚C for 30 seconds, and elonga- tion at 68˚C for 20 minutes. This was followed by an- other 10 cycles with the same conditions except the de- naturation time was increased to 15 seconds and the elongation time was extended by an additional 20 sec- onds on each successive cycle. The QuickStep 2 PCR Purification Kit (EdgeBio, Gaithersburg, MD) was used according to manufacturer’s specifications to purify sam- ples after the linear amplification reactions and prior to labeling.
Microarray analysis was performed using the follow- ing methods. Amplified DNA (40 µl of the purified, lin- ear amplification product) and 600 ng of non-amplified, genomic control DNA were labeled with Cyanine dyes (Cy5 for the specimen and Cy3 for the control) using the NimbleGen Dual-Color DNA Labeling Kit (Roche Nim- bleGen) and purified as described by the manufacturer. Labeled specimen and control DNA were quantified us- ing the NanoDrop 8000 Spectrophotometer (Thermo Sci- entific), combined (31 µg each), and coprecipitated with 50 µg of Human Cot-1 DNA (Invitrogen, Carlsbad, CA) in isopropanol. Co-precipitated DNAs were hybridized to the arrays at 42˚C for 40 - 72 hours and then washed as described by the manufacturer (Roche NimbleGen). Ar- rays were scanned at 2 µm using a Roche NimbleGen MS 200 Microarray Scanner and the data were analyzed with NimbleScan 2.6 software. Results were displayed and analyzed with Oncoglyphix®.
2.5. Affymetrix SNP 6.0 Array Analysis
For Case 2, SNP microarray analysis was performed using the Affymetrix SNP Array 6.0 (Affymetrix, Santa Clara, CA) according to manufacturer’s instructions. Da- ta were analyzed using Affymetrix Chromosome Analy- sis Suite (ChAS) software also in accordance with the ma- nufacturer’s instructions and visualized with Oncogly- phix®.
3. RESULTS
3.1. Detection of Balanced Translocations by TCGH
Prior chromosome analysis and/or FISH indicated the presence of a clinically relevant balanced translocation in 10 of 20 cases (Tables 2 and 3) and aCGH results identi- fied a potential additional case (case 10) with a CNA within the MLL gene indicative of a possible transloca-
tion. Of the 11 cases of interest, 10 had sufficient DNA to perform the tCGH assay (Table 3). Of these, all nine cases that revealed evidence of a translocation by karyo- types or FISH analysis demonstrate translocations by tCGH. These included four cases of t (9;22), three cases of t (12;21), and two cases of t (4;11) (Figure 1). Case 10, which revealed a breakpoint for a genomic copy gain by aCGH, did not exhibit any translocation when analy- zed with the tCGH assay. Results provided high resolu- tion mapping of the breakpoints, with precise definition dependent on the oligonucleotide coverage present on the tCGH arrays (Figure 1, Table 3). All translocation break- points were confirmed by PCR using individual primers flanking breakpoints defined by tCGH and standard PCR techniques (data not shown).
3.2. Detection of CNAs
In 15 of the 20 cases (75%), CNAs that were not iden- tified by G-banded analysis or FISH were detected by microarray (Table 2). These alterations ranged from fo- cal intragenic imbalances to gains or losses of many me- gabases of DNA. Focal CNAs, predominantly deletions, involving genes that have previously been described in ALL included PAX5 (6 cases), BTG1 (4 cases), IKZF1 (6
cases), TOX (3 cases), EBF1 (2 cases), LEF1 (1 case), BTLA (1 case), NR3C1 (1 case), FOXP1 (1 case), and TBL1XR1 (1 case). Of the six cases with PAX5 CNAs,
four consisted of heterozygous deletions (~200 to 250 kb) involving one or more exons at the 5’ end of the gene (Cases 6, 9, 12, and 19; Table 2 and Figure 2(a)), one case showed both a focal intronic loss and a multicopy gain involving exons 2 - 5 in PAX5(Case 13; Table 2 and Figure 2(b)) and another case demonstrated ampli- fication within PAX5 that included exons 2 - 5 (Case 1,
Table 2 and Figure 2(b)). In addition to the six cases with focal PAX5 CNAs, one additional case (Case 5; Ta- ble 2) had heterozygous loss of PAX5 as the result of loss
of 9p from a dic (9;20). Note that for TBL1XR1, the sin-
gle observed deletion (Case 8) ends 37 kb distal to the 5’-end of the gene and may not impact expression.
All four cases with t (9;22) had loss of IKZF1 includ-
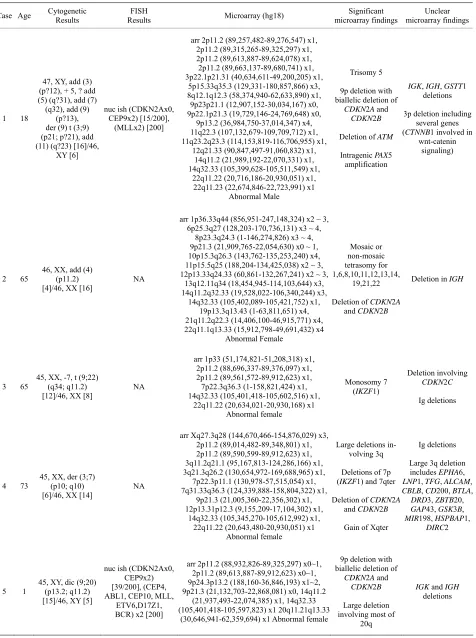
Table 2. Summary of microarray and other cytogenetic results for 20 B-cell ALL cases.
Case Age Cytogenetic Results Results FISH Microarray (hg18) microarray findings Significant microarray findingsUnclear
1 18
47, XY, add (3) (p?12), + 5, ? add (5) (q?31), add (7) (q32), add (9)
(p?13), der (9) t (3;9) (p21; p?21), add (11) (q?23) [16]/46,
XY [6]
nuc ish (CDKN2Ax0, CEP9x2) [15/200],
(MLLx2) [200]
arr 2p11.2 (89,257,482-89,276,547) x1, 2p11.2 (89,315,265-89,325,297) x1, 2p11.2 (89,613,887-89,624,078) x1, 2p11.2 (89,663,137-89,680,741) x1, 3p22.1p21.31 (40,634,611-49,200,205) x1,
5p15.33q35.3 (129,331-180,857,866) x3, 8q12.1q12.3 (58,374,940-62,633,890) x1, 9p23p21.1 (12,907,152-30,034,167) x0, 9p22.1p21.3 (19,729,146-24,769,648) x0,
9p13.2 (36,984,750-37,014,347) x4, 11q22.3 (107,132,679-109,709,712) x1, 11q23.2q23.3 (114,153,819-116,706,955) x1,
12q21.33 (90,847,497-91,060,832) x1, 14q11.2 (21,989,192-22,070,331) x1, 14q32.33 (105,399,628-105,511,549) x1,
22q11.22 (20,716,186-20,930,051) x1, 22q11.23 (22,674,846-22,723,991) x1
Abnormal Male
Trisomy 5
9p deletion with biallelic deletion of
CDKN2A and
CDKN2B
Deletion of ATM
Intragenic PAX5
amplification
IGK, IGH, GSTT1
deletions
3p deletion including several genes (CTNNB1 involved in
wnt-catenin signaling)
2 65 46, XX, add (4) (p11.2)
[4]/46, XX [16]
NA
arr 1p36.33q44 (856,951-247,148,324) x2 ~ 3, 6p25.3q27 (128,203-170,736,131) x3 ~ 4,
8p23.3q24.3 (1-146,274,826) x3 ~ 4, 9p21.3 (21,909,765-22,054,630) x0 ~ 1, 10p15.3q26.3 (143,762-135,253,240) x4, 11p15.5q25 (188,204-134,425,038) x2 ~ 3, 12p13.33q24.33 (60,861-132,267,241) x2 ~ 3,
13q12.11q34 (18,454,945-114,103,644) x3, 14q11.2q32.33 (19,528,022-106,340,244) x3,
14q32.33 (105,402,089-105,421,752) x1, 19p13.3q13.43 (1-63,811,651) x4, 21q11.2q22.3 (14,406,100-46,915,771) x4, 22q11.1q13.33 (15,912,798-49,691,432) x4
Abnormal Female Mosaic or non-mosaic tetrasomy for 1,6,8,10,11,12,13,14, 19,21,22
Deletion of CDKN2A
and CDKN2B
Deletion in IGH
3 65
45, XX, -7, t (9;22) (q34; q11.2) [12]/46, XX [8]
NA
arr 1p33 (51,174,821-51,208,318) x1, 2p11.2 (88,696,337-89,376,097) x1, 2p11.2 (89,561,572-89,912,623) x1, 7p22.3q36.3 (1-158,821,424) x1, 14q32.33 (105,401,418-105,602,516) x1,
22q11.22 (20,634,021-20,930,168) x1 Abnormal female
Monosomy 7
(IKZF1)
Deletion involving
CDKN2C
Ig deletions
4 73
45, XX, der (3;7) (p10; q10) [6]/46, XX [14]
NA
arr Xq27.3q28 (144,670,466-154,876,029) x3, 2p11.2 (89,014,482-89,348,801) x1, 2p11.2 (89,590,599-89,912,623) x1, 3q11.2q21.1 (95,167,813-124,286,166) x1, 3q21.3q26.2 (130,654,972-169,688,965) x1,
7p22.3p11.1 (130,978-57,515,054) x1, 7q31.33q36.3 (124,339,888-158,804,322) x1,
9p21.3 (21,005,360-22,356,302) x1, 12p13.31p12.3 (9,155,209-17,104,302) x1,
14q32.33 (105,345,270-105,612,992) x1, 22q11.22 (20,643,480-20,930,051) x1
Abnormal female
Large deletions in-volving 3q
Deletions of 7p
(IKZF1) and 7qter
Deletion of CDKN2A
and CDKN2B
Gain of Xqter
Ig deletions
Large 3q deletion
includes EPHA6,
LNP1, TFG, ALCAM, CBLB, CD200, BTLA,
DRD3, ZBTB20, GAP43, GSK3B,
MIR198, HSPBAP1,
DIRC2
5 1 45, XY, dic (9;20) (p13.2; q11.2)
[15]/46, XY [5]
nuc ish (CDKN2Ax0, CEP9x2) [39/200], (CEP4, ABL1, CEP10, MLL,
ETV6,D17Z1, BCR) x2 [200]
arr 2p11.2 (88,932,826-89,325,297) x0~1, 2p11.2 (89,613,887-89,912,623) x0~1, 9p24.3p13.2 (188,160-36,846,193) x1~2, 9p21.3 (21,132,703-22,868,081) x0, 14q11.2
(21,937,493-22,074,385) x1, 14q32.33 (105,401,418-105,597,823) x1 20q11.21q13.33
(30,646,941-62,359,694) x1 Abnormal female
9p deletion with biallelic deletion of
CDKN2A and
CDKN2B
Large deletion involving most of
20q
IGK and IGH
[image:5.595.64.540.100.738.2]Continued
6 8
46, XY, del (1) (p34p36.1), del (6)
(q13q21), del (9) (q13q22), add (10)
(p11.2), t (12;15) (p13;q11.2), add (20) (q11.2) [8]/46,sl, del (1)
(q32q42), t (6;21) (p21;q22) [cp7]/46,
XY[5]
NA
arr Xp21.1 (32,857,314-33,252,699) x0, 1p36.32p35.1 (4,617,997-33,430,623) x1, 1q42.13q42.2 (226,166,028-231,338,987) x1,
2p11.2 (88,814,253-89,348,801) x1, 2p11.2 (89,590,599-89,912,416) x1, 4q21.3q22.1 (88,176,109-88,211,992) x1,
5q31.3 (142,709,231-142,776,040) x1, 5q35.1 (170,669,914-170,671,184) x1, 6p22.2p22.1 (25,011,637-26,167,410) x1, 6q16.3q21 (104,163,415-112,301,878) x1, 6q22.31 (125,873,889-126,139,853) x1, 6q23.3q25.1 (137,784,022-151,883,174) x1,
9p21.3p21.2 (20,101,054-26,709,187) x1, 9p21.3 (21,492,342-22,054,630) x0, 9p13.2 (37,018,557-37,223,691) x1, 9q22.2q33.2 (91,719,661-123,306,663) x1,
14q11.2 (21,943,554-22,052,134) x1, 14q32.33 (105,401,418-106,005,780) x1,
20p12.2 (10,369,721-10,400,575) x1, 21q22.3 (41,576,548-42,780,374) x1, 22q11.22 (20,716,186-20,852,537) x1
Abnormal male
Deletion of: AFF1,
NR3C1, TLX3, PAX5,
C20orf94
Biallelic deletion of
CDKN2A
DMD deletion
Ig and TCR deletions
1p deletion with large number of cancer
features
1q deletion (WNT3A
and EGLN1)
4q deletion (AFF1)
7 3
46, XX, del (12) (p11.2p13), der (12) (12pter- >
12p13::21q22-> 21q11.2::12p13- 12p13::21q22-> 12qter), der (21) (21pter-> 21q11.2::12p13::21q22 - > 21qter) [4]/46, X [18]
NA
arr 2p11.2 (88,932,826-89,294,676) x1, 2p11.2 (89,653,265-89,740,401) x1, 3q26.2 (170,532,557-170,862,897) x1,
7q34 (141,848,384-142,230,606) x1, 12p13.31p11.1 (7,183,961-34,107,615) x1,
14q32.33 (105,402,089-105,592,918) x1, 22q11.22 (21,570,725-21,577,402) x1
Abnormal female
MECOM deletion
ETV6 deletion
Ig and TCR deletions
8 3
46, XY, der (12) (21pter-> 1p12::12p13- (21pter-> 12qter),der(19) (19pter->
19q13.1::12p13::21q22 ->21qter), der(21)(19qter->19q13.1: :21p12-> 21q22::12p13->
12pter)[8]/46, XY[12]
NA
arr 2p11.2 (88,932,826-89,912,901) x1, 3q26.32 (178,434,828-179,384,704) x0, 12p13.2 (11,789,624-11,810,529) x1, 12p13.2p12.1 (11,920,600-21,600,799) x1,
14q11.2 (21,978,139-22,054,108) x1, 14q32.33 (105,402,089-105,588,340) x1
Abnormal male
Biallelic deletion abutting 5’end of
TBL1XR1
ETV6 deletion
IGK and IGH
deletions
TRA/D deletion
9 52
46, XX, t (9;22) (q34; q11.2), add (20) (q11.2), del (21) (q21q22.3) [19]
NA
arr 2p11.2 (88,966,582-89,912,901) x1, 3p14.1 (71,174,477-71,536,728) x1, 3q13.2 (113,612,958-113,698,834) x1, 4q25 (109,187,792-109,298,195) x1, 6q21 (109,346,113-109,434,527) x1,
7p12.2 (50,214,532-50,444,361) x1, 9p21.3 (21,854,404-22,229,673) x1, 9p13.2 (37,003,771-37,259,921) x1, 14q11.2 (21,978,139-22,078,275) x1, 14q32.33 (105,346,465-105,550,411) x1, 14q32.33 (105,780,835-106,261,145) x1, 15q21.3 (55,091,960-55,138,547) x1, 17q21.1 (35,496,033-35,597,274) x1, 20q11.22q13.32 (33,293,965-56,987,158) x1,
22q11.22 (20,643,540-21,094,301) x1 Abnormal female
Deletions involving:
FOXP1, BTLA, IKZF1, CDKN2A/B,
and PAX5
Large deletion of 20q
Deletions of: LEF1,
SESN1, TCF12and CASC3
IGH, IGL and
TCRA/D deletions
10 52
48, XY, + 19, + mar [1]/51, idem, + 6, + 13, + 21 [18]/46,
XY [1]
NA
arr 3q27.3 (188,938,761-188,946,429) x1, 6p25.3q27 (1-170,899,992) x3, 8q24.21 (128,815,237-128,819,784) x1, 11q14.2q14.3 (85,873,769-89,596,519) x4, 11q22.1q22.3 (97,609,686-108,855,018) x4, 11q23.3 (116,666,706-117,858,516) x4, 11q23.3q24.1 (119,339,943-122,322,820) x4,
11q24.2q25 (125,708,527-134,425,038) x4, 13q12.11q34 (18,454,945-114,103,644) x3,
19p13.3q13.43 (1-63,811,651) x3, 21q11.2q22.3 (14,406,100-46,915,771) x3,
22q11.23 (21,888,154-21,893,301) x1 Abnormal male
Continued
11 66
42, XY, del (3) (p13), del (4) (q21), add (5) (q10), -7, -9, -10, del (11)
(q24), + der (11) ? dic r (11;11) (q10;q10) trp ~ qdp (11)
(q23q23), -16,-17 [10]/46, XY[5]
NA
arr 3p22.2p12.1 (36,729,918-84,568,449) x1, 4q21.1q35.2 (77,873,417-191,152,793) x1, 5p13.2q35.3 (37,218,239-180,619,169) x1, 7p21.3q36.3 (8,233,377-158,804,322) x1, 9q13q31.3 (70,222,356-110,957,883) x1, 9q31.3q33.2 (112,622,698-123,571,177) x1, 10q11.21q23.31 (45,473,706-92,230,997) x1,
11p15.5 (188,204-674,923) x1, 11p15.5p15.1 (734,095-17,733,802) x3, 11p15.1p13 (19,677,938-31,108,639) x3, 11q13.2q14.1 (67,520,607-78,308,080) x3,
11q14.1q21 (80,148,837-93,138,032) x3, 11q21 (93,170,146-93,502,521) x1, 11q21 (94,786,412-95,754,049) x1, 11q21q23.3 (95,810,329-117,493,384) x3, 11q23.3 (117,516,396-118,565,878) x3~4, 11q23.3 (118,577,948-119,462,138) x1, 11q23.3q25 (119,499,554-134,425,038) x3,
16p13.3q24.3 (35,819-88,657,641) x1, 17p13.3p13.1 (1-7,574,347) x1
Abnormal male
Complex result
Monosomy 16
Deletions including:
TP53, HRAS, IKZF1 and many more
Highly rearranged chromosome 11
12 5
47, XY, + del (X) (q13q24), del (12) (p12p13) [4]/46,
XY, + del (X) (q10), del (12) (p12p13), -13 [5]/46,
XY [11]
nuc ish (ETV6x2, RUNX1x3) (ETV6 con RUNX1x1) [199/200], (CEP4, CEP10, CEP17)x2[500], (P16, ASS, ABL1,MLL, BCR)x2[200]
arr Xp22.33p11.21 (3,905,651-56,085,692) x2, Xq26.2q28 (130,503,588-154,584,236) x2,
Xq28 (154,584,237-154,876,029) x2, 2p11.2 (88,932,826-89,188,304) x1, 9p13.2 (36,917,532-37,148,414) x1, 12p13.2p12.1 (11,924,656-23,155,752) x1,
13q11q34 (18,347,178-114,103,644) x1, 14q11.2 (21,937,493-22,074,385) x1, 14q32.33 (105,402,089-106,245,460) x1,
16p11.2 (30,798,095-31,840,945) x1, 20p12.2 (10,369,721-10,470,986) x1, 22q11.22 (20,848,203-21,608,981) x1
Abnormal male
Deletion of PAX5,
C20orf94, ETV6
Monosomy 13
Large gain on Xp
Ig and TCRA/D
deletions
FUS and MYST1
deletion
13 6
46, XY, r (9) (p? 13q? 33) [12]/46, XY [18]
ish r (9) (CDKN2A-, CEP9+, ASS-, ABL1-). nuc ish
(CEP4x2, CEP10x2, D17Z1x1) [24/200], CDKN2Ax0, CEP9x2) [120/200], (ASSx1, ABL1x1, BCRx2) [153/200], MLL,ETV6, RUNX1)x2
arr 7p14.1 (38,286,931-38,343,558) x1, 7q34 (141,693,456-141,719,136) x1, 8q12.1 (59,952,847-60,820,059) x1, 9p24.3p21.2 (188,160-27,486,736) x1,
9p21.3 (21,233,696-22,229,673) x0, 9p13.2 (36,965,324-36,969,492) x1, 9p13.2 (36,972,327-37,012,379) x3, 9q33.2q34.3 (123,131,618-140,130,559) x1,
12q21.33 (90,774,706-91,060,832) x1, 14q11.2 (21,309,211-22,080,207) x1, 14q32.33 (105,401,418-105,481,976) x1
Abnormal male
9p deletion with biallelic deletion of
CDKN2A and
CDKN2B and
terminal loss of 9qter
PAX5 deletion and
duplication
Deletion involving
BTG1
Ig and TCR deletions
TOX deletion
14 25
46, XY, t (2;12) (p15;q24.3), I (7) (q10),
t (9;22) (q34;q11.2) [9]/47, sl, +8 [2]/48, sdl1, + der (22) t (9;22) [1]/46,
XY[11]
NA
arr 2p11.2 (88,932,826-89,912,416) x1, 7p22.3p11.1 (171,273-57,515,054) x1,
7p12.2 (50,381,509-50,429,675) x0, 7q11.21q36.3 (62,030,364-158,821,424) x3,
9p21.3 (21,822,754-21,994,012) x1, 9p21.3 (21,964,305-21,994,012) x0, 12q21.33 (90,847,497-91,060,832) x1,
14q11.2 (21,989,192-22,099,342) x1, 14q32.33 (105,219,696-106,181,548) x1,
20p12.2 (10,369,721-10,400,575) x1, 22q11.22 (20,847,781-20,852,477) x1
Abnormal male
Gain of 7q/loss of 7p, consistent with i(7q)
Homozygous
CDKN2A/B deletion
Deletions involving
IKZF1, BTG1 and
C20orf94
Continued
15 7
58,XY,+X,+4,+5,+6,+9,+ 10,+11,+14,+16,+17,+18,
+21
NA
arr Xp22.33q28 (1-154,913,754) x2, 2p11.2 (89,257,482-89,277,059) x1, 4p16.3q35.2 (45,627-191,152,793) x3, 5p15.33q35.3 (129,331-180,619,169) x3,
6p25.3q27 (128,203-170,736,131) x3, 7p14.1 (38,259,152-38,373,349) x1, 9p24.3q34.3 (188,160-140,130,559) x3,
10p15.3q26.3 (1-135,374,737) x3, 11p15.5q25 (1-134,452,384) x3, 14q11.2 (21,962,291-22,052,074) x1, 14q11.2q32.33 (19,528,022-106,340,244) x3,
14q32.33 (105,402,089-105,481,650) x1,
16p13.3q24.3 (35,819-88,657,641) x3, 17p13.3q25.3 (49,128-78,612,915) x3, 18p11.32q23 (123,388-76,100,854) x3, 21q11.2q22.3 (14,406,100-46,915,771) x3
Abnormal male
Trisomy 4, 5, 6, 9, 10, 11, 14, 16, 17,
18, 21, X
Ig and TCR deletions
16 52
46, XY, t (9;22) (q34;q11.2) [4]/46, idem, t (5;8) (q33;q13) [10]/46,
XY [4]
NA
arr 5q33.3 (158,197,556-158,228,953) x1, 7p12.2 (50,381,509-50,444,361) x1, 8q12.1 (60,057,422-60,217,721) x1, 14q32.33 (105,400,678-105,481,976) x1
Abnormal male
Deletions of EBF1
and IKZF1
TOX deletion
IGH deletion
17 37
46, XX, t (4;11) (q21;q23) [8]/46,
XX [13]
nuc ish MLLx2) (5’MLLsep3’ MLLx1) (181/248)
nuc ish (ABL1, BCR) x2 [212]
arr 14q32.33 (105,400,678-105,466,992) x1, 19p13.2 (7,847,230-7,895,398) x1
Deletions involving
IGH and MAP2K7
18 52
46, XY, t (4;11) (q21;q23) [16]/46,
XY [2]
NA
arr 8q24.3 (145,486,837-145,741,796) x1, 9p21.3 (21,909,765-21,964,305) x1, 14q32.33 (105,387,659-105,481,976) x1
Abnormal female
Deletion involving
CDK2NA
8q deletion involving several genes
including CYHR1,
KIFC2, FOXH1,
PPP1R16A,
RECQL4, LRRC14, LRRC24
IGH deletion
19 <18 NA
nuc ish (TELx2), (AML1x3), (TELconAML1x1)
[186/200] or t (12; 21) (p13; q22)
arr Yq11.21q12 (12,808,314-57,443,437) x0, Yq12 (57,443,438-57,735,230) x0, 1p35.1 (32,264,901-32,617,308) x1, 2p11.2 (85,092,808-86,895,965) x1, 2p11.2 (88,932,826-89,233,635) x1, 2p11.2 (89,315,265-89,327,175) x0, 5q33.3 (158,373,309-158,465,259) x1, 6p22.1 (26,191,062-26,350,720) x1, 6q14.1q27 (81,894,370-170,736,131) x1 ~ 2,
8q24.21 (128,815,674-128,821,325) x1, 9p13.2 (36,917,532-37,020,544) x1, 10p15.3q26.3 (172,285-135,099,923) x3,
12p13.2 (11,696,155-11,820,208) x1, 12q21.33 (90,690,181-91,060,832) x1, 14q11.2 (21,945,491-22,064,305) x1, 14q32.33 (105,371,094-106,245,460) x1, 15q12q21.2 (24,919,738-48,645,080) x1,
19q13.31 (49,947,625-49,951,395) x1, 20p13p12.3 (16,653-8,652,488) x1
Abnormal male
Large deletions of 6qter, 15q12q21.2
and 20pter
Deletions of EBF1,
MYC, PAX5, ETV6
Trisomy 10
Deletions of LCK,
HFE, BCL3 and Yqter
Ig and TCR deletions
20 13
54, XY, + X, + 4, + 6, + 14, + 17, + 18, + 21,
+ 21 [9]
nuc ish (4p11-q11x3) [174/223], D17Z1x3)
[188/223], (10p11.1-q11.1x2)
nuc ish (ETV6x2, RUNX1x3-4) [223/225] nuc ish (ABL1, BCR) x2 nuc
ish (MLLx2) [200]
arr Xp22.33q28 (1-154,913,754) x2, 4p16.3q35.2 (45,627-191,152,793) x3, 6p25.3q27 (1-170,899,992) x3, 14q11.2q32.33 (19,528,022-106,368,585) x3,
arr 14q32.33 (105,402,089-105,481,770) x1, 17p13.3q25.3 (1-78,774,742) x3, 18p11.32q23 (123,388-76,100,854) x3, 21q11.2q22.3 (14,406,100-46,915,771) x4
Abnormal male
Trisomy 4, 6, 14, 17,
18, X; Tetrasomy 21 IGH deletion
Table 3. Translocation microarray analysis (tCGH) for cases of B-cell ALL with known or suspected balanced translocations.
Case Translocation seen by karyotype, FISH and/or aCGH Detection by tCGH Breakpoints (hg18) Breakpoint Distinction
chr9:132598080-132598270 5’-end ABL1
3 t (9;22) (q34;q11.2) BCR/ABL1
chr22:21889002-21889168 Central m-BCR
chr12:11921539-11921655 3’-end ETV6
7
del (12) (p11.2p13), der (12) (12pter- > 12p13::21q22- > 21q11.2::12p13- > 12qter), der (21)
(21pter- > 21q11.2::12p13::21q22- > 21qter)
ETV6/RUNX1
chr21:35330287-35331177 5’-end of intron 1 in RUNX1
chr12:11920600-11920834 near 3’-end ETV6
8
der (12) (21pter- > 21p12::12p13- > 12qter), der (19) (19pter- > 19q13.1::12p13::21q22- > 21qter),
der (21) (19qter- > 19q13.1::21p12- > 21q22::12p13- > 12pter)
ETV6/RUNX1
chr21:35204437-35204739 3’-end of intron 1 in RUNX1
chr9:132582114-132583554 5’-end ABL1
9 t (9;22) (q34;q11.2) BCR/ABL1
chr22:21961745-21961958 Central M-BCR
10 Aneuploidy by karyotypes; Possible MLL gene breakpoint by aCGH None Detected
chr12:11924656-11924849 most 3-end ETV6
12
del (12) (p12p13) nuc ish(ETV6 × 2, RUNX1 × 3) (ETV6 con RUNX1x1) [199/200], (CEP4, CEP10, CEP17) × 2 [500], (P16, ASS, ABL1, MLL, BCR) × 2 [200]
ETV6/RUNX1
chr21:35266695-35266968 center of intron 1 in RUNX1
chr9:132635298-132635731 Central intron 1
14 t (9;22) (q34;q11.2) BCR/ABL1
chr22:21922842-21923078 Terminal mBCR
chr9:132651461-132651567 Central intron 1
16 t (9;22) (q34;q11.2) BCR/ABL1
chr22:21908588-21908773 Central m-BCR
chr4:88216921-88217006 Major brpt clustŦ
17 t (4;11) (q21;q23) MLL/AFF1
chr11:117860758-117860864 Major brpt clustŦ
chr4:88214869-88215163 Major brpt clustŦ
18 t (4;11) (q21;q23) MLL/AFF1
chr11:117860648-117860758 Major brpt clustŦ
19 (TELconAML1 × 1) [186/200] or t (12;21) (p13;q22)nuc ish (TEL × 2), (AML1 × 3), N/DϮ
ϮN/D = Not determined due to insufficient DNA; Ŧ = Major breakpoint cluster [59].
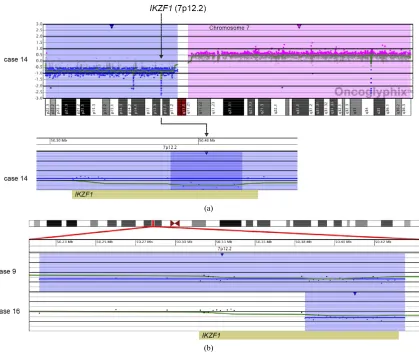
and an additional 48.2-kb deletion within the remaining
IKZF1allele (Case 14; Table 2 and Figure 3(a)). An- other case showed focal heterozygous loss of the entire
IKZF1gene, but not flanking genes (Case 9; Table 2 and Figure 3(b)), and a third case had a heterozygous dele- tion, approximately 60 kb in size, involving only the 3’ end of IKZF1(Case 16; Table 2 and Figure 3(b)).
In addition to focal CNAs, gains and losses involving many megabases of DNA, which were only sometimes identified by conventional cytogenetic analysis, were de- tected by microarray (Table 2). Some of these alterations involved genes or regions previously known to be invol- ved in ALL, such as deletions of 9p including CDKN2A
and deletions of 12p including ETV6. Nine cases had
losses involving CDKN2A that ranged from intragenic
deletions to deletions of many megabases. Three of these cases had heterozygous deletions ranging from 145 kb to 1.4 Mb (Cases 4, 9, and 18; Table 2) and six had homo- zygous deletions (Cases 1, 2, 5, 6, 13, and 14; Table 2
and Figure 4). In case 6, biallelic loss of CDKN2A, in-
cluding a 6.6-Mb loss of 9p21.3p21.2, was not seen by conventional cytogenetics. Of note, for case 14 deletion of one of the CDKN2A alleles that was detected by mi-
croarray was below the level of resolution of FISH (~30 kb) (Figure 4). In Case 14, homozygous deletion of
CDKN2A was likely to be detectable only by microarray
as the lesion (~30 kb) on one allele was likely below the level of resolution of standard CDKN2A FISH probes
(150 kb - 190 kb) (Figure 4).
Losses involving ETV6 were seen in all three ETV6/RUNX1 fusion cases (Cases 7, 8, and 12; Table 2, Figure 1) and in one case that did not have a t (12;21) (Case 19; Table 2). Case 8 demonstrated a loss in ETV6
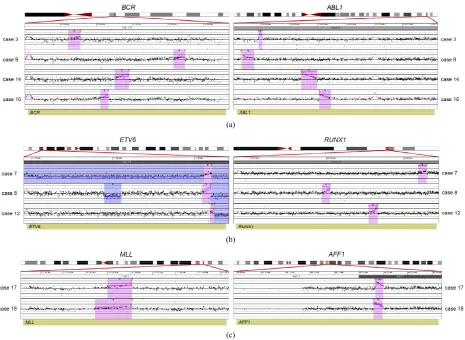
(a)
(b)
[image:10.595.67.532.83.423.2](c)
Figure 1. Balanced translocations detected by tCGH in B-cell ALL cases. The probes (pink dots) form a peak, indicating the am-plification leading up to the breakpoint region (thin, green triangles). Copy gains (pink shaded regions) and copy losses (blue shaded regions) are also shown. (a) BCR/ABL1 translocations seen in cases 3, 9, 14, and 16. (b) ETV6/RUNX1 translocations seen in cases 7, 8, and 12. (c) MLL/AFF1 translocations seen in cases 17 and 18. For (a)-(c), probes are ordered on the x-axis according to physical mapping positions, and values along the y-axis represent log2 ratios of patient:control signal intensities. Results are visualized using Oncoglyphix (Signature Genomics).
gain in 11q 23.3 with a break in the MLL gene. Although
one cell in this case was noted to have a marker chro- mosome by G-banding that could conceivably consist of 11q material, the presence of a single cell finding is not considered clonal. Even if the marker is part of the leu- kemic clone, the gains of 11q could not have easily been determined in this case, even by FISH. Incases that had chromosome abnormalities identified by G-banded anal- ysis, microarray findings frequently resulted in more pre- cise characterization of the genomic imbalances. For exa- mple, in case 11, abnormalities of chromosome 11 were noted by G-banded analysis; however, the complex pat- tern of chromosome 11 gains and losses detected by mi- croarray could not be deduced from the karyotype.
Consistent with previous literature [23], cases with
MLL gene rearrangements (Cases 17 and 18; Table 2) had only a few CNAs each. In contrast, cases with t (9;22) or t (12;21) frequently showed multiple CNAs. With the ex- ception of case 3 that had a t (9;22) and only two CNAs, the remainder of cases with either a BCR/ABL1 (Cases 9,
14, 16, Table 2) or ETV6/RUNX1 (Cases 7, 8, and 12;
Table 2) fusion had 4 to 17 CNAs.
3.3. Detection of Hypodiploidy/ Near-Haploidy
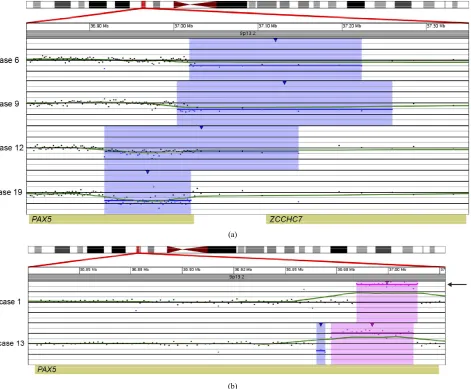
(a)
[image:11.595.65.536.87.476.2](b)
Figure 2. Copy number gains and losses of the gene PAX5 at 9p13.2 detected by microarray analysis. PAX5is involved in the regula- tion of B-cell development and differentiation. (a) Cases with deletions including one or more exons at the 5’ end of PAX5: Case 6 has a 205-kb loss, Case 9 has a 256-kb loss, Case 12 has a 231-kb loss, and Case 19 has a 103-kb loss. (b) Intragenic copy number alterations of PAX5: Case 1 has a two-copy gain of 30 kb within PAX5 (arrow) and case 13 has a 4-kb loss and a 40-kb gain within PAX5. For A and B, probes are ordered on the x-axis according to physical mapping positions, and values along the y-axis represent log2 ratios of patient:control signal intensities. Results are visualized using Oncoglyphix (Signature Genomics).
3.4. Discrepancies between G-Banded Chromosome and Microarray Results
Although it was expected that many CNAs detected by microarray would be missed by G-banded analysis as noted above, there were a few cases in which alterations identified by G-banded analysis could not be substanti- ated by the microarray results. Some cases were noted to have chromosomes with additional material of unknown origin by G-banding (Cases 1, 2, 6, 9, and 11). If these were true “add” abnormalities, they would be expected to show a deletion distal to the breakpoint of the “add” chromosome and gain of the additional chromosomal material. These imbalances were not seen by microarray. It is unlikely that these abnormalities were missed by the
(a)
[image:12.595.89.508.82.436.2](b)
Figure 3. Copy number losses of IKZF1 at 7p12.2 detected by microarray analysis. IKZF1is involved in the regulation of B-cell development and differentiation. (a) Microarray results for case 14, showing a copy number loss of the entire p-arm of chromosome 7 (shaded in blue) and a copy number gain of the entire q-arm (shaded in pink). The zoomed-in view of IKZF1at 7p12.2 for case 14 shows an intragenic, biallelic 48.2 kb loss of part of IKZF1 (shorter arrow). (b) Mi-croarray results for cases 9 and 16 with copy number losses (shaded in blue) of 7p12.2 that include IKZF1.Case 9 has a 320-kb deletion that includes the entire gene, and case 16 has a 62-kb deletion of the 3’-end of the gene. For a and b, probes are ordered on the x-axis according to physical mapping positions, and values along the y-axis represent log2 ra- tios of patient: control signal intensities. Results are visualized using Oncoglyphix (Signature Genomics).
[image:12.595.90.507.532.680.2](a)
(b) (c) (d) (e)
Figure 5. Copy number and SNP microarray analysis of Case 2. (a) aCGH microarray analysis of Case 2 with the Signature OncoChip. Microarray probes are ordered on the x-axis according to physical mapping positions, with data for chromosomes 1 - 22, X, and Y being displayed from left to right, and values along the y-axis represent log2 ratios of patient: control signal intensities. Copy gains are shown as pink shaded regions. Variations in log2 ratios suggest different clones are present in this patient sample. The presence of four copies of many chromosomes and two of others was suggestive of doubling of a hypo-diploid clone. (b)-(e) Affymetrix SNP 6.0 analysis of Case 2. The allelic difference for the SNP probes is shown at the top of each panel with the log ratio for the copy number probes shown at the bottom. (b) Data for chromosome 3 are shown as a representative example for chromosomes X, 2, 3, 4, 5, 7, 9, 15, 16, 17, 18, and 20, which showed identical patterns. These data are consistent with a copy number of 2 and loss of heterozygosity with the presence of only two genotypes (AA and BB). (c) Data for chromosome 6 are shown as a representative example for chromosomes 6, 8, 10, 14, 19, 21, and 22, which showed identical patterns. These data are consistent with a copy number of 4 and no loss of heterozygosity with the presence of only three genotypes (AAAA, AABB, and BBBB). (d) Data for chromosome 11 are shown as a representative example for chromosomes 1, 11, and 12, which showed identical patterns. These data are consistent with a copy number of three chro-mosomes and no loss of heterozygosity with the presence of four genotypes (AAA, AAB, BBA, and BBB). (e) Data for chromosome 13 are shown, the only chromosome in this patient sample with this pattern. These data are consistent with a copy number of three chromosomes and loss of heterozygosity with the presence of only two genotypes (AAA and BBB). The presence of homozygosity in the chromosomes with two copies as well as the presence of heterozygosity in the chromo-somes with four copies is consistent with doubling of a hypodiploid clone. For (a)-(e), results are visualized using On-coglyphix (Signature Genomics).
rangement, with 21q material missing from one chromo- some 21 homologue but inserted elsewhere in the ge- nome. In case 11, monosomy 7, 9, and 10 were reported by G-banded analysis. The microarray results for this case showed loss of most of chromosome 7 but normal copy number from 7p21.3 to the terminus, an interstitial loss of 9q but normal copy number for the remainder of chromosome 9, and an interstitial deletion of 10q with normal copy number for the rest of chromosome 10. As this case had a complex karyotype, it is not surprising that the retained segments of chromosomes 7, 9, and 10 could be present in a rearranged form that was not iden- tifiable by G-banding. These cases illustrate that mi- croarray analysis can clarify the karyotype results and provide a more accurate and unbiased assessment of im- balances in the cancer genome.
4. DISCUSSION
[image:13.595.66.530.86.329.2]Hyperdiploidy and ETV6/RUNX1 translocations were
seen exclusively in pediatric cases, while BCR/ABL1 fu-
sions were restricted to adults.
In this study, microarray analysis allowed for the iden- tification of CNAs below the resolution of chromosome analysis and FISH in 75% of cases. Furthermore, a novel application of linear amplification prior to aCGH, termed tCGH, identified all known translocations in nine speci- mens. In addition, the translocation breakpoints were identified to within a few hundred base pairs, and in some cases submicroscopic deletions at the translocation breakpoints were evident by the microarray analysis.
Most cases in our study also had additional CNAs de- tected by microarray, some of which are known to be prognostically significant as summarized below. Similar to other recent studies, CNAs in genes that are involved in B-cell development and differentiation were frequen- tly detected in ALL. Other less frequent deletions in genes involved in B-cell development and differentiation that we detected have been reported in other studies of ALL and include LEF1, BTLA, and EBF1 [27].
PAX5, one of the most frequent targets of alterations
in ALL, encodes a transcription factor required for B- lineage commitment and maturation [28]. Consistent with recent array studies [10-12], PAX5 losses or gains
were present in 33% of the ALL cases tested here (Fig- ure 3). Not including a case with loss of the entire 9p due to a dicentric (9;20), all other cases with CNAs in- volving PAX5 were either intragenic or only a few
hun-dred kilobases in size. For the current study, cases 9 and 12 showed PAX5 CNAs and were BCR/ABl1 and ETV6/ RUNX1 positive, respectively, with the remaining 4 cases
being translocation negative. The PAX5 CNAs consisted
of both deletions and amplifications. Mutations in PAX5,
including intragenic amplification as seen in case 1, have been previously described in B-cell ALL, although such alterations appear not to be correlated with a particular outcome [16,29].
Also consistent with recent literature, all cases with a t (9;22) in our study were found to have loss of IKZF1
[30]. In one of these cases (Case 16), the deletion was only 63 kb in size, which is below the resolution of FISH probes that are typically used by clinical laboratories. Deletions of IKZF1, which encodes the early lymphoid
transcription factor IKAROS, have been found in 84% of
BCR/ABL1-positive and 28% of BCR/ABL1-negative
ALL [17,30]. IKZF1 alterations have been shown to be
associated with poor outcome both in BCR/ABL1-posi-
tive and BCR/ABL1-negative ALL [13,27,31]. Thus, the
ability to detect IKZF1 deletions is critical for appropri-
ate risk stratification.
Deletions in 8q12, ranging from 160 kb to 4.3 Mb, were detected by microarray in three of our cases. All three of these deletions included or partially overlapped
TOX (KIAA080). This gene has been proposed as one of
two candidate genes in recurring 8q12.1 deletions that are present in approximately 4% of ALL [32]. TOX,
originally shown to play a role in T-cell development, has recently been found to be involved in the develop- ment of many cell lineages of the immune system [33]. In Case 16, the 160-kb deletion of 8q12.1 includes the first 5’ exon of TOX and does not involve any other
genes; therefore, our results further support TOX as a
significant candidate gene within these 8q12.1 deletions. The microarray results also identified deletions of genes involved in glucocorticoid resistance. Synthetic gluco- corticoids are used in the treatment of pediatric ALL due to their ability to induce apoptosis in leukemic blasts; re- sistance to glucocorticoids is predictive of poor therapy outcome [34]. Focal deletions of BTG1 were present in
four of our cases. Deletion of BTG1 is frequently seen in
ALL, and loss of BTG1 expression has been shown to
result in glucocorticoid resistance [35]. One case in our study demonstrated a deletion within NR3C1 (Case 6),
and another had a biallelic loss within GSTT1 (Case 1).
Germline mutations in NR3C1 have been found in pa-
tients with glucocorticoid resistance, and deletions of this gene have also been described in ALL [27]. Polymorphi- sms in the glutathione S-transferase (GST) genes have been implicated in glucocorticoid resistance. Inherited homozygous deletions of GSTT1 have been associated
with an initial good response to prednisone, although the association between GST polymorphisms and relapse is controversial [36-39].
Other CNAs of interest detected in the cases studied here include frequent CDKN2A losses (9/20; 45%) rang-
ing from small intragenic deletions to many megabases in size (Figure 4). The frequency of losses seen here was higher than that reported in some previous studies [40, 41], although our findings agreed with others [17,42]. Six of the CDKN2A deletions appeared homozygous by
array, while the remaining cases may reflect either hete- rozygosity or homozygosity in a subclone of cells, given the inherent non-cellular limitations of array technology. In a previous study of childhood ALL, CDKN2A deletion
was found more frequently in cases with t (9;22) (61%) than with t (12;21) (15%) or MLL gene rearrangements
(13%) [40]. The present study showed similar results with CDKN2A deletion found in 2/4 cases with t (9;22),
1/2 cases with a MLL gene rearrangements (Case 18) and
in none of the cases with t (12;21).
Cases 17 and 18 exhibited MLL/AFF1 translocations
and represent cases with the least number of CNAs de- tected by aCGH. This is consistent with the notion that
MLL gene rearrangement is a potent and sufficient on-
cogenic driver mutation. Of those cases exhibiting
CDKN2A deletion, case 18 exhibited deletion of CDKN
cally significant finding in addition to the MLL/AFF1
translocations in the case. In contrast, all three cases with a t (12;21) cases showed intermediate levels of instability as measured by CNAs, including loss of or deletion in
ETV6. In addition, one t (12;21) case showed biallelic
loss at the 5’-end of TBL1XR1, which has also been
found to be a recurrent event in this ALL subtype [43]. The cases showing the greatest number of CNAs were those that did not exhibit recurrent translocations, per- haps a consequence of cellular evolution in search of an oncogenic threshold (e.g., Cases 1, 6, 10, 11, and 13). Of these, Case 1 exhibited a substantial number of CNAs that included both homozygous deletion of CDKN2A and
a two-copy gain within the PAX5locus. As both abnor-
malities reside on chromosome 9p and are homozygous, the results are suspicious for copy neutral loss of het- erozygosity event, although confirmatory SNP analysis was not performed. As shown in Figure 2, the PAX5
two-copy duplication occurs within the gene. Although duplications in PAX5 have previously been thought to
result in loss-of-function alleles [12], this duplication in- volves exons 2-5 that encode the Paired box DNA bind- ing domain that potentially produces an in-frame product. A similar duplication involving the same specific exons was seen in case 13 (Figure 4), a case that also exhibited homozygous deletion of CDKN2A. Thus, a novel PAX5
function related to paired box duplication may be related to greater instability, homozygous CDKN2A mutation
and lack of translocation, features shared by these two cases.
In the current study, copy number variation of the im- munoglobulin and T-cell receptor genes were noted due to high-density coverage within these genes (see Table 2). Such alterations may also be observed in normal in-dividuals due to somatic rearrangement; however, in hematological malignancies, these copy number changes can be indicative of clonal cell populations (see Table 2). Clonality, if present, may be related to viral infection, immunodeficiency, or neoplasia [44]. Thus, gains and losses of these regions present a unique challenge in the analysis and interpretation of oncology aCGH cases. Fur- ther studies employing additional clinical information and a standardized statistical means of analysis will be required for interpreting copy number variation in these regions and ascertaining potential clinical significance of these alterations.
It is important to note that although the aCGH analysis in Case 2 was suggestive of the doubling of a hypodip- loid/near-haploid clone, the confirmation of this abnor- mality was only made possible by subsequent SNP mi- croarray analysis. This information is critical to this case in order to distinguish apparent hyperdiploidy that is as- sociated with a good prognosis from true hypodiploidy that is associated with a poor prognosis.
The tCGH technology offers unprecedented resolution of translocation breakpoints affording a new opportunity to explore the potential clinical and biological value of such data. To this end, Case 9 is of potential interest. Of the BCR/ABL1 positive cases, Case 9 had the most CNAs
detected by aCGH and represented newly diagnosed dis-ease. The current data provide high-resolution analysis of the genomic breakpoints for each recurrent translocation. Relative to the other BCR/ABL1 positive cases in this
study, for Case 9 those breakpoints map to the furthest 3’-end of intron 1 for BCR and the furthest 5’-end of
intron 1 for ABL1, yielding a genomic fusion gene larger
than for other BCR/ABL1 translocations. Although all
four BCR and ABL1 breakpoints occurs within the first
introns of those genes, it is interesting to speculate that regulatory and/or cryptic alternative splice sites might in- fluence the oncogenic potential for the specific fusions. The additional genomic landscape included in the fusion for Case 9 may necessitate the acquisition of additional driver mutations (e.g., deletions of CDKN2A, PAX5, IKZF1) to produce disease. A similar albeit less dramatic
example comes from data comparison for Cases 17 and 18. Cases 17 and 18 exhibited MLL/AFF1 translocations
and represent cases with the least number of CNAs de- tected by aCGH. This is consistent with the notion that
MLL gene rearrangement is a potent and sufficient on-
cogengic driver. Consistent with that assumption these cases show minimal CNAs. As determined by tCGH the cases share nearly identical MLL gene breakpoints within
the common cluster region (Case 17 = chr11:117860758- 117860864; Case 18 = chr11:1178606 48-117860758), with AFF1 breakpoints separated by only a few kb (case
17 = chr4:88216921-88217006; case 18 = chr4:882148 69-88215163). Once again, one could speculate that the precise sequence context of the breakpoints or specific elements contained in the sequences of difference ob- served (several kb on chromosome 4) was a contributing factor for Case 18 acquiring the additional oncogenic lesion at CDKN2A. Similar proposals could be generated
for the significance of ETV6/RUNX1 breakpoints. Obvi-
ously a much larger study would be required to discern to what degree breakpoints correlate with presence of ad- ditional oncogene CNAs.
The current study was completed with cases all previ- ously analyzed by chromosome and/or FISH analysis. One potential limitation of microarray-based analysis for leukemia is that separate clones cannot be distinguished; however, current studies indicate that the presence or absence of certain CNAs at diagnosis, such as IKZF1
ventional cytogenetic methods that allow visualization of the chromosomes. For example, microarray results on case 5 showed loss of 9p and 20q that would suggest the presence of a dic (9;20), although confirmation of this finding requires visualization of the metaphase cells by G-banding or FISH. However, if the loss of genetic ma- terial is the prognostically significant finding, which it appears to be in the case of the dic (9;20) [46,47], then the specific mechanism of loss is probably not as impor- tant as the genetic content of the altered region. Another issue that clinical laboratories will need to address is the potential of uncovering germline CNAs during the course of testing neoplastic specimens for acquired al- terations. For example, deletions in the DMD gene have
been uncovered in studies of ALL [27] (see also our case 6). Other examples are given in the study performed by Dougherty et al., 2011) [3]. A non-neoplastic source of
DNA from the patient may be required to determine if these are acquired or germline alterations and families would ideally receive appropriate pre-test counseling for these scenarios.
Despite the aforementioned issues, the ability to detect diagnostically and prognostically significant transloca- tions and CNAs by microarray has significant advantages over conventional cytogenetics, with the ability to detect deletions below the resolution of FISH. Thus, arrays will be an important adjunct to conventional cytogenetics, and may eventually become the standard for first-tier testing. The ability to detect both prognostically signifi- cant balanced rearrangements and genomic imbalances is a major step toward implementing arrays in the clinical laboratory for evaluation of ALL and other forms of ne- oplasia.
5. ACKNOWLEDGEMENTS
We thank Erin Dodge (Signature Genomics) for figure creation and critical editing of the tables and manuscript and A. Michelle Caldwell (Signature Genomics) for critical editing of the manuscript.
REFERENCES
[1] Pui, C.H., Pei, D., Sandlund, J.T., Ribeiro, R.C., Rubnitz, J.E., Raimondi, S.C., et al. (2010) Long-term results of St Jude Total Therapy Studies 11, 12, 13A, 13B, and 14 for childhood acute lymphoblastic leukemia. Leukemia, 24, 371-382. doi:10.1038/leu.2009.252
[2] Pui, C.H., Campana, D., Pei, D., Bowman, W.P., Sand- lund, J.T., Kaste, S.C., et al. (2009) Treating childhood acute lymphoblastic leukemia without cranial irradiation. The New England Journal of Medicine, 360, 2730-2741. doi:10.1056/NEJMoa0900386
[3] Dougherty, M.J., Wilmoth, D.M., Tooke, L.S., Shaikh, T.H., Gai, X., Hakonarson, H., et al. (2011) Implementa- tion of high resolution single nucleotide polymorphism array analysis as a clinical test for patients with hema-
tologic malignancies. Cancer Genetics, 204, 26-38. doi:10.1016/j.cancergencyto.2010.10.007
[4] Fielding, A.K., Richards, S.M., Chopra, R., Lazarus, H.M., Litzow, M.R., Buck, G., et al. (2007) Outcome of 609 adults after relapse of acute lymphoblastic leukemia (ALL); an MRC UKALL12/ECOG 2993 study. Blood, 109, 944-950. doi:10.1182/blood-2006-05-018192 [5] Nguyen, K., Devidas, M., Cheng, S.C., La, M., Raetz,
E.A., Carroll, W.L., et al. (2008) Factors influencing sur- vival after relapse from acute lymphoblastic leukemia: A Children’s Oncology Group study. Leukemia, 22, 2142- 2150. doi:10.1038/leu.2008.251
[6] Pui, C.H., Relling, M.V. and Downing, J.R. (2004) Acute lymphoblastic leukemia. The New England Journal of Medicine, 350, 1535-1548. doi:10.1056/NEJMra023001 [7] Malempati, S., Gaynon, P.S., Sather, H., La, M.K. and
Stork, L.C. (2007) Outcome after relapse among children with standard-risk acute lymphoblastic leukemia: Chil- dren’s Oncology Group study CCG-1952. Journal of Clinical Oncology, 25, 5800-5807.
doi:10.1200/JCO.2007.10.7508
[8] Pui, C.H., Robison, L.L. and Look, A.T. (2008) Acute lymphoblastic leukaemia. Lancet, 371, 1030-1043. doi:10.1016/S0140-6736(08)60457-2
[9] Mullighan, C.G. (2011) New strategies in acute lym- phoblastic leukemia: Translating advances in genomics into clinical practice. Clinical Cancer Research, 17, 396- 400. doi:10.1158/1078-0432.CCR-10-1203
[10] Kawamata, N., Ogawa, S., Zimmermann, M., Kato, M., Sanada, M., Hemminki, K., et al. (2008) Molecular al- lelokaryotyping of pediatric acute lymphoblastic leuke- mias by high-resolution single nucleotide polymorphism oligonucleotide genomic microarray. Blood, 111, 776-784. doi:10.1182/blood-2007-05-088310
[11] Kuiper, R.P., Schoenmakers, E.F., van Reijmersdal, S.V., Hehir-Kwa, J.Y., Van Kessel, A.G., Van Leeuwen, F.N., et al. (2007) High-resolution genomic profiling of child- hood ALL reveals novel recurrent genetic lesions affect- ing pathways involved in lymphocyte differentiation and cell cycle progression. Leukemia, 21, 1258-1266. doi:10.1038/sj.leu.2404691
[12] Mullighan, C.G., Goorha, S., Radtke, I., Miller, C.B., Cou- stan-Smith, E., Dalton, J.D., et al. (2007) Genomewide analysis of genetic alterations in acute lymphoblastic leu- kaemia. Nature, 446, 758-764.
doi:10.1038/nature05690
[13] Kuiper, R.P., Waanders, E., Van Der Velden, V.H., Van Reijmersdal, S.V., Venkatachalam, R., Scheijen, B., et al. (2010) IKZF1 deletions predict relapse in uniformly trea- ted pediatric precursor B-ALL. Leukemia, 24, 1258-1264. doi:10.1038/leu.2010.87
[14] White, M.K. and McCubrey, J.A. (2001) Suppression of apoptosis: Role in cell growth and neoplasia. Leukemia, 15, 1011-1021. doi:10.1038/sj.leu.2402143
phoblastic leukemia. Blood, 114, 2688-2698.
[16] Mullighan, C.G. (2010) Genetic Alterations in High-Risk B-Progenitor Acute Lymphoblastic Leukemia, in SIOP Education Book 2010: 42nd Congress of the International Society of Paediatric Oncology, Boston, USA, October 21-24, 2010, Agarwal, B.R., et al. Ed., International So- ciety of Paediatric Oncology, SIOP (International Society of Paediatric Oncology), Eindhoven, 77-87.
[17] Mullighan, C.G., Su, X., Zhang, J., Radtke, I., Phillips, L.A., Miller, C.B., et al. (2009) Deletion of IKZF1 and prognosis in acute lymphoblastic leukemia. The New England Journal of Medicine, 360, 470-480.
doi:10.1056/NEJMoa0808253
[18] Miller, D.T., Adam, M.P., Aradhya, S., Biesecker, L.G., Brothman, A.R., Carter, N.P., et al. (2010) Consensus statement: chromosomal microarray is a first-tier clinical diagnostic test for individuals with developmental dis- abilities or congenital anomalies. The American Journal of Human Genetics, 86, 749-764.
doi:10.1016/j.ajhg.2010.04.006
[19] Shaffer, L.G., Schultz, R.A. and Ballif, B.C. (2012) The use of new technologies in the detection of balanced translocations in hematologic disorders. Current Opinion in Genetics & Development, 22, 264-271.
doi:10.1016/j.gde.2012.01.005
[20] Greisman, H.A., Hoffman, N.G. and Yi, H.S. (2011) Rapid High-Resolution Mapping of Balanced Chromo- somal Rearrangements on Tiling CGH Arrays. The Jour- nal of Molecular Diagnostics, 13, 621-633.
doi:10.1016/j.jmoldx.2011.07.005
[21] Yu, L., Slovak, M.L., Mannoor, K., Chen, C., Hunger, S.P., Carroll, A.J., et al. (2011) Microarray detection of multiple recurring submicroscopic chromosomal aberra- tions in pediatric T-cell acute lymphoblastic leukemia. Leukemia, 25, 1042-1046. doi:10.1038/leu.2011.33 [22] Kolquist, K.A., Schultz, R.A, Furrow, A., Brown, T.C.,
Han, J.Y., Campbell, L.J., et al. (2011) Microarray-based comparative genomic hybridization of cancer targets re- veals novel, recurrent genetic aberrations in the myelo- dysplastic syndromes. Cancer Genetics, 204, 603-628. doi:10.1016/j.cancergen.2011.10.004
[23] Mullighan, C.G. and Downing, J.R. (2009) Global ge- nomic characterization of acute lymphoblastic leukemia. Seminars in Hematology, 46, 3-15.
doi:10.1053/j.seminhematol.2008.09.005
[24] Charrin, C., Thomas, X., Ffrench, M., Le, Q.H., Andrieux, J., Mozziconacci, M.J., et al. (2004) A report from the LALA-94 and LALA-SA groups on hypodiploidy with 30 to 39 chromosomes and near-triploidy: 2 possible expres- sions of a sole entity conferring poor prognosis in adult acute lymphoblastic leukemia (ALL). Blood, 104, 2444- 2451. doi:10.1182/blood-2003-04-1299
[25] Moorman, A.V., Richards, S.M., Robinson, H.M., Stref- ford, J.C., Gibson, B.E., Kinsey, S.E., et al. (2007) Prog- nosis of children with acute lymphoblastic leukemia (ALL) and intrachromosomal amplification of chromo- some 21 (iAMP21). Blood, 109, 2327-2330.
doi:10.1182/blood-2006-08-040436
[26] Moorman, A.V. (2012) The clinical relevance of chro-
mosomal and genomic abnormalities in B-cell precursor acute lymphoblastic leukaemia. Blood Reviews. 26, 123- 135. doi:10.1016/j.blre.2012.01.001
[27] Mullighan, C.G. and Downing, J.R. (2009) Genome-wide profiling of genetic alterations in acute lymphoblastic leukemia: Recent insights and future directions. Leuke- mia, 23, 1209-1218. doi:10.1038/leu.2009.18
[28] Nutt, S.L., Eberhard, D., Horcher, M., Rolink, A.G. and Busslinger, M. (2001) Pax5 determines the identity of B cells from the beginning to the end of B-lymphopoiesis. International Reviews of Immunology, 20, 65-82. doi:10.3109/08830180109056723
[29] Nebral, K., Denk, D., Attarbaschi, A., Konig, M., Mann, G., Haas, O.A., et al. (2009) Incidence and diversity of PAX5 fusion genes in childhood acute lymphoblastic leukemia. Leukemia, 23, 134-143.
doi:10.1038/leu.2008.306
[30] Mullighan, C.G., Miller, C.B., Radtke, I., Phillips, L.A., Dalton, J., Ma, J., et al. (2008) BCR-ABL1 lymphoblastic leukaemia is characterized by the deletion of Ikaros. Na- ture, 453, 110-114. doi:10.1038/nature06866
[31] Martinelli, G., Iacobucci, I., Storlazzi, C.T., Vignetti, M., Paoloni, F., Cilloni, D., et al. (2009) IKZF1 (Ikaros) dele- tions in BCR-ABL1-positive acute lymphoblastic leuke- mia are associated with short disease-free survival and high rate of cumulative incidence of relapse: A GIMEMA AL WP report. Journal of Clinical Oncology, 27, 5202- 5207. doi:10.1200/JCO.2008.21.6408
[32] Bardet, V., Couque, N., Cattolico, L., Hetet, G., Devaux, I., Duprat, S., et al. (2002) Molecular analysis of nonran- dom 8q12 deletions in acute lymphoblastic leukemia: Identification of two candidate genes. Genes Chromo- somes Cancer, 33, 178-187. doi:10.1002/gcc.10014 [33] Aliahmad, P., de la Torre, B. and Kaye, J. (2010) Shared
dependence on the DNA-binding factor TOX for the de- velopment of lymphoid tissue-inducer cell and NK cell lineages. Nature Immunology, 11, 945-952.
doi:10.1038/ni.1930
[34] Tissing, W.J., Meijerink, J.P., den Boer, M.L. and Pieters, R. (2003) Molecular determinants of glucocorticoid sen- sitivity and resistance in acute lymphoblastic leukemia. Leukemia, 17, 17-25. doi:10.1038/sj.leu.2402733
[35] Van Galen, J.C., Kuiper, R.P., Van Emst, L., Levers, M., Tijchon, E., Scheijen, B., et al. (2010) BTG1 regulates glucocorticoid receptor autoinduction in acute lympho- blastic leukemia. Blood, 115, 4810-4819.
doi:10.1182/blood-2009-05-223081
[36] Davies, S.M., Bhatia, S., Ross, J.A., Kiffmeyer, W.R., Gaynon, P.S., Radloff, G.A., et al. (2002) Glutathione S-transferase genotypes, genetic susceptibility, and out- come of therapy in childhood acute lymphoblastic leuke- mia. Blood, 100, 67-71. doi:10.1182/blood.V100.1.67 [37] Takanashi, M., Morimoto, A., Yagi, T., Kuriyama, K.,
Kano, G., Imamura, T., et al. (2003) Impact of glutathione S-transferase gene deletion on early relapse in childhood B-precursor acute lymphoblastic leukemia. Haemato- logica, 88, 1238-1244.