http://www.scirp.org/journal/ajps ISSN Online: 2158-2750
ISSN Print: 2158-2742
Response of Yield and Related Attributes
of Upland Cotton to Weather Variables
Kalim Ullah
1, Muhammad Idrees Khan
2, Zahid Mahmood
2, Toheed Iqbal
3, Saeed Muhammad
2,
Hafiz Abdul Haq
2, Aftab Ahmad
4, Sabahat Hussain
21The PCCC, Cotton Research Station, Dera Ismail Khan, Pakistan 2The PCCC, Central Cotton Research Institute, Multan, Pakistan
3Agricultural Research Institute, Ratta Kulachi, Dera Ismail Khan, Pakistan 4Global Change Impact Study Centre Islamabad, Islamabad, Pakistan
Abstract
Cotton growth and development is effected by various ecological issues like temperature fluctuations, distribution and quantity of rainfall, relative humid-ity and winds which are the climate change attributes. A field experiment was carried out to find out the response of cotton to weather variables in terms of total variation in yield and quality. The effect of planting times and thermal temperatures (cumulative heat units) on yield of 4 cotton cultivars viz; CIM- 600, CIM-616, CIM-622 & CRIS-641 was evaluated. Plants were sown on 6 planting times during the year 2015-2016 and 2016-2017 in an experiment conducted in randomized complete block design having three replications. Cotton cultivars depicted significant variances for number of bolls plant−1,
boll weight and seed cotton yield. The cultivar CIM-616 depicted the highest seed cotton yield of 2083.60 kg∙ha−1 on interpretation of highest bolls and boll
weight. Maximum seed cotton yield was noted in planting time from 1st April
to 15th April whereas early and late planting decreases the seed cotton yield on
account of less accretion of cumulative heat units. Regression analysis de-picted that rise of one unit (15 days) from early to optimal date (15th March to
15th April) enhanced the seed cotton yield by 93.76 kg∙ha−1 (y = −93.764x2 +
521.04x + 1364). Delayed planting also reduces the seed cotton yield with the same ratio. It is therefore established that cotton must be cultivated from 1st
April to 1st May to harvest good production in this type of climate.
Keywords
G. hirsutum, Planting Time, Cumulative Heat Units, Cotton Cultivars
1. Introduction
The global climate has not only changed due to the increase in 30% of the
Car-How to cite this paper: Ullah, K., Khan, M.I., Mahmood, Z., Iqbal, T., Muhammad, S., Haq, H.A., Ahmad, A. and Hussain, S. (2017) Response of Yield and Related Attri- butes of Upland Cotton to Weather Va-riables. American Journal of Plant Sciences, 8, 1711-1720.
https://doi.org/10.4236/ajps.2017.87118
Received: May 29, 2017 Accepted: June 25, 2017 Published: June 29, 2017
Copyright © 2017 by authors and Scientific Research Publishing Inc. This work is licensed under the Creative Commons Attribution International License (CC BY 4.0).
bon dioxide (CO2) which is a major greenhouse effecting increase in
tempera-ture from 0.3˚C - 0.6˚C [1]. The agriculture sector has the potential to take the edge off climate change mainly by increasing the carbon rate at which it is stored in the soil. In case of climate change, in 21st century we are expecting important
changes in crop production. If the temperature on the global surface is changed with radioactive, it will change in environment with physiological effect [2]. The meteorologist in the current scenario predicts the increase in global mean tem-perature from 0.9˚C to 3.5˚C up to the year 2100. Therefore, food and fibre production in such high-temperature and humid environments may be more limited. And this will be inadequate to vegetative structures as well as to the animals that consume these vegetative structures if, global climate has changed as predicted [2]. Lower emission of the CO2 and greenhouse gas will lessen
the magnitude of climate change, its impact and the rate at which they ap-pears [3].
Cotton crop is more sensitive to environmental stresses result in progressive decrease in yield on the temperature above the optimum. Moreover in most of the cotton belts during the flowering stage and boll formation the temperature is already above the optimum and further increase will cause reduction in the yield of this crop [4]. Furthermore, moisture deficits can also depressed the lint of cotton in majority of the cotton producing areas [5].
Pakistanis likely to be the country that will suffer most from climate change as far as agriculture and cotton production are concerned. On the bases of cotton production and consumption Pakistan placed 4th and 3rd each with a 10% share
respectively in the world. The main cotton producing provinces are the Punjab with a share of about 79% and Sindh having an area of 20% under cotton culti-vation. The cotton belt prolongs about 1200 km along the Indus River and its offshoots [6]. The Indus River is very important to agriculture in Pakistan and cotton production is totally dependent on irrigation with water from this river. But due to the lessening in the size of the Himalayan and Tibetan glaciers and snowfields, it will carry less water which will automatically cause in the reduc-tion of cotton yield. Furthermore, with respect to high temperatures cotton production in this region already takes place in sub-optimal conditions. Further increases in temperature will disheartened the seed cotton yield during the growing season [6]. In Pakistan cotton crop is growing mostly in low rainfall and high temperature under semi-arid and irrigated conditions. This crop due to its vertical tap root system is mostly tolerant to high temperature but very high temperature makes it vulnerable to the pest attack [7]. And the response of this crop towards the vegetative growth and fruiting parts is loss and up to some ex-tent to water stress condition. But it is more sensitive to excessive water avail-ability because more water can cause reduction in yield and fibre qualities dur-ing the stage of its flowerdur-ing and boll formation [7].
2. Material and Methods
2.1. Experimental Location and Plant Materials
Two year field experiment was carried out at Cotton Research Station, D. I. Khan (situated at 31˚49'N latitude and 70˚55'E longitude) during the crop sea-son 2015-2016 and 2016-2017. Four cultivars viz., CIM-600, CIM-616, CIM-622, and CRIS-641 were investigated during the study. These cultivars were culti-vated at various times in order to generate variation in temperature, humidity and heat units for growth, development and maturity, thus providing an exten-sive choice of various weather variables from planting till maturity. The clima-tological statistics was collected from Arid Zone Research Centre (AZRC), PARC, D. I. Khan. The baseline temperature for cumulative heat units (CHU)/ growing degree days (GDD) calculation was 16˚C. The CHU for different phases were calculated via the equation as outlined by Dwyer and Stewart [8].
(
max min)
CHU
2
b
T +T −T
=
where, Tmax, Tmin and Tb are maximum, minimum and baseline temperatures
re-spectively below which development ceases.
The soil of the experimental site was bit saline in nature and less fertile having electrical conductivity of 2.66 dS∙m−1, pH of 7.90, organic matter 0.87%, sand 151
g∙kg−1, silt 451 g∙kg−1, clay 400 g∙kg−1 and total N 0.99 g∙kg−1.
2.2. Experimental Environments
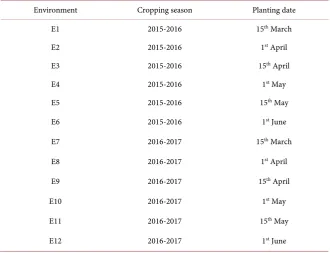
[image:3.595.209.540.479.732.2]The trial was carried out at 12 environments (2 years × 6 sowing times) (Table 1).
Table 1. Twelve manipulated environments used in the study.
Environment Cropping season Planting date
E1 2015-2016 15th March
E2 2015-2016 1st April
E3 2015-2016 15th April
E4 2015-2016 1st May
E5 2015-2016 15th May
E6 2015-2016 1st June
E7 2016-2017 15th March
E8 2016-2017 1st April
E9 2016-2017 15th April
E10 2016-2017 1st May
E11 2016-2017 15th May
2.3. Experimental Layout and Crop Management
The four cotton cultivars (CIM-600, CIM-616, CIM-622, CRIS-641) were sown at 6 diverse planting times in the cropping year 2016 and 2017. These cultivars were sown in randomized complete block (RCB) design having 3 replications. Sowing was done in a four row subplot having 10 m length and a spacing of 0.75 m between and 0.30 m within the hills. Seeds were cultivated in hills having 5 seed which was immediately irrigated. 60 kg∙ha−1 of phosphorus in the form of
single super phosphate and 50 kg∙ha−1 of N as urea were used before sowing and
50 kg∙ha−1 N as urea at flowering and 50 kg∙ha−1 at boll formation stage. 20 days
after sowing, seedlings were thinned to single plant per hill. Picking was per-formed after 130 and 150 days of sowing. All the agronomic and plant protection practices were performed as per recommendations.
List of genotypes used in the study.
Name of genotypes and their origin and their salient characters CIM-600
(Origin) CIM-555 × Bt.CIM-598
CIM-616 (Origin) (Bt.CIM-592 × CIM-443)
CIM-622 (origin) CIM-554×IR-1524
CRIS-641 (origin) FH-1000 × NIAB-999 Representative characters
Higher yield Possess good yield Good yield potential Higher yield potential Good fibre traits Excellent fibre characters Better fibre traits Big boll weight
High GOT Higher lint percentage Higher ginning out turn Higher lint percentage
Suitable for timely
planting of wheat Heat tolerant, very early Heat tolerant and early maturity Excellent fibre characters Wider adoptability
and drought tolerant and wider adoptability Drought tolerant Drought tolerant and wider adoptability drought tolerant Heat and Hairy and tolerant
to Jassids attacks Hairy and tolerant to attack of Jassids Hairy and tolerant to attack of Jassids Wider adoptability
Good opining and
big boll size and good opening Good boll size Very good opening and big boll Good boll size and very good opening
Spin on higher count Spin on higher count. on higher count Ability to spin Sympodial plant type
2.4. Recording of Observations and Statistical Analysis
Data on number of bolls plant−1, boll weight (g) and seed cotton yield (kg∙ha−1)
3. Results and Discussion
3.1. Combined Analysis of Variance
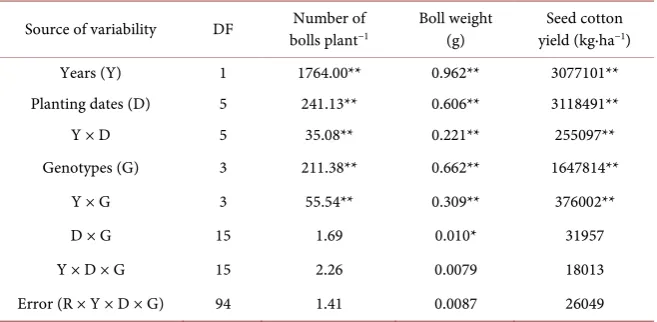
Combined analysis of variance depicted significant (P ≤ 0.01) differences among genotypes (G) and planting times (D) for number of bolls, boll weight and seed cotton yield (Table 2) presenting the incidence of variation amongst the geno-types in addition to environments. Furthermore, it proposes that some of the genotypes were superior to others in these studied traits. Significant mean squares of genotypes also depicted higher genetic variability among the tested genotypes. This variation was recorded for all the studied attributes which can be used as a valuable breeding source for several purposes. The G × D interac-tion was also significant (P ≤ 0.05) for boll weight indicating that various geno-types performed differently in different environments (Table 2). It further indi-cates significant genotype × environment interaction. It can be thus concluded that in cotton breeding program, environmental effects in understanding plant growth must be given due consideration. These results are in accordance with the findings of Machado et al. [12] and Ullah et al. [13] who also recorded sig-nificant genotype × planting times, genotype × year and genotype × year × loca-tion interacloca-tion. Significant genotype × environment interacloca-tion in upland cot-ton was also recorded by Unay et al. [14] and Satish et al. [15]. Similarly signifi-cant mean squares for G, E, and G × E was also recorded for various morpho-logical traits by Khan et al. [16] and Gul [17].
3.2. Number of Bolls Plant
−1Number of bolls plant−1 plays a key role in managing the differences in seed
cot-ton yield on account of the reason that it is the major independent yield compo-nent. Hence in cotton improvement selection for more number of bolls plant−1
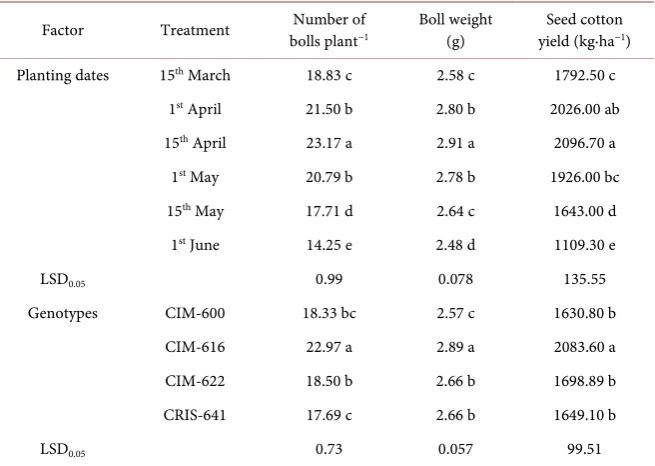
must receive due emphasis. Analysis of variance revealed that planting times significantly (P ≤ 0.01) affected the number of bolls plant−1 (Table 3). Number
[image:5.595.211.540.560.721.2]of bolls plant−1 increased with delay in planting time and more number of bolls
Table 2. Combined analysis of variance for studied crop phenology and yield
compo-nents of four cotton genotypes evaluated for two years and six planting dates.
Source of variability DF bolls plantNumber of −1 Boll weight (g) yield (kg∙haSeed cotton −1)
Years (Y) 1 1764.00** 0.962** 3077101**
Planting dates (D) 5 241.13** 0.606** 3118491**
Y × D 5 35.08** 0.221** 255097**
Genotypes (G) 3 211.38** 0.662** 1647814**
Y × G 3 55.54** 0.309** 376002**
D × G 15 1.69 0.010* 31957
Y × D × G 15 2.26 0.0079 18013
Error (R × Y × D × G) 94 1.41 0.0087 26049
Table 3. Means of six planting dates and four cotton genotypes for some of the studied traits.
Factor Treatment bolls plantNumber of −1 Boll weight (g) yield (kg∙haSeed cotton −1)
Planting dates 15th March 18.83 c 2.58 c 1792.50 c 1st April 21.50 b 2.80 b 2026.00 ab 15th April 23.17 a 2.91 a 2096.70 a
1st May 20.79 b 2.78 b 1926.00 bc 15th May 17.71 d 2.64 c 1643.00 d
1st June 14.25 e 2.48 d 1109.30 e
LSD0.05 0.99 0.078 135.55
Genotypes CIM-600 18.33 bc 2.57 c 1630.80 b
CIM-616 22.97 a 2.89 a 2083.60 a
CIM-622 18.50 b 2.66 b 1698.89 b
CRIS-641 17.69 c 2.66 b 1649.10 b
LSD0.05 0.73 0.057 99.51
Means followed by similar letters in the same column are not significantly different at 5% level of probabil-ity.
plant−1 (23.17) was recorded in the crop sown on 15th April whereas further delay
in planting reduced the number of bolls plant−1 and thus minimum was recorded
in the crop planted either very early (18.83) on 15th March or delayed (14.25) on
1st June. This reduction in number of bolls plant−1 in early and delayed planting
might be attributed to the variation in temperature prevailed by the crop growth. The genotypes studied also bared different number of bolls plant−1. The mean
comparison of the genotypes depicted significant differences at 5% probability and thus CIM-616 has the maximum (22.97) number of bolls plant−1 followed by
CIM-622 (18.50) while the lowest was recorded in genotype CRIS-641 (17.69).
3.3. Boll Weight (G)
Statistical analysis of the data depicted significant differences (P ≤ 0.01) in boll weight among various planting times. Maximum boll weight of 2.91 g was re-corded in a crop sown on 15th April which was followed by the crop planted on
1st April (2.80 g) or 1st May (2.78 g) (Table 3). Boll weight enhanced with
de-layed planting time from 15th March to 15th April. However further delay in
3.4. Seed Cotton Yield (kg∙ha
−1)
Planting times and suitable genotypes plays the most significant role in yield and yield related components. The cotton crop planted on 15th April depicted
maxi-mum seed cotton yield of 2096.70 kg∙ha−1 on account of having maximum
num-ber of bolls plant−1 boll weight, and most favourable environmental conditions in
comparison to other planting times investigated in the study. The crop planted on 1st April ranked second with 2026 kg∙ha−1 regarding the seed cotton yield
(Table 3). It is evident from the table that planting times and genotypes signifi-cantly influenced the seed cotton yield. The seed cotton yield enhanced from 1792.50 to 2096.70 kg∙ha−1 as planting time delayed from 15th March to 15th April
while further delay in planting time reduced the seed cotton yield and delayed planting from 15th April to 1st June reduced the seed cotton yield to 1109.30
kg∙ha−1 reflecting 304.20 kg∙ha−1 increment up to 15th April and then 987.40
kg∙ha−1 decrements in seed cotton yield respectively (Table 3). Determination of
optimum planting time and suitable cultivar for certain region is the major ag-ronomic factor and utmost important to obtain higher seed cotton yield. The yielding ability of the present genotypes was also the result of the different in-teraction (D × G, G × Y, D × G × Y) factors [16]. Different growing conditions resulted in variation in seed cotton yield from year to year variation. Both geno-types and environment contributed to the variation in seed cotton yield however the environmental complex depicted primary yield effects in comparison to ge-notypes [20] [21]. The finding of the present study was also in accordance with and the environmental factor was predominant for the yield variation.
Significant difference was also observed for seed cotton yield among different genotypes. The maximum seed cotton yield of 2083.60 kg∙ha−1 was recorded for
CIM-616 which was followed by CIM-622 (Table 3). Cotton genotypes revealed significant differences through various environments and their interaction for seed cotton yield, indicating considerable variation among genotypes as well as environments [14] [17].
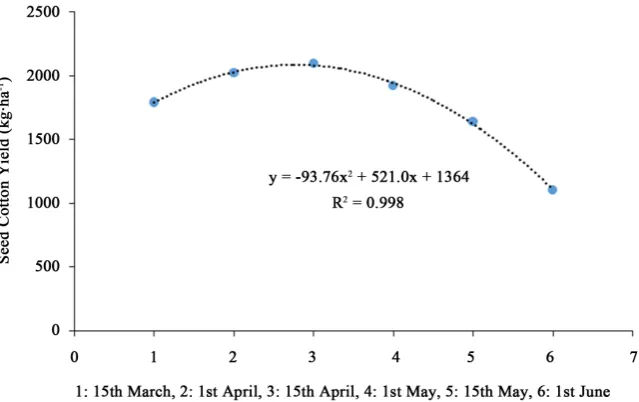
Regression analysis of planting time and seed cotton yield also depicted sig-nificant relation between these two attributes. Besides, R2 (coefficient of
deter-mination) revealed that up to 99% of the increase till 15th April and later on
de-crease in seed cotton yield might be due to the influence of planting time. The regression between seed cotton yield and planting time was negative and regres-sion analysis suggested that increase in one unit (15 days) of planting time in-creased/decreased seed cotton yield by 93.76 kg∙ha−1 (Figure 1).
Environmental factor, particularly temperature was the main attribute that in-fluenced the plant growth and development. Significant variation among geno-types regarding growing degree days were recorded which explained that differ-ent genotypes have differdiffer-ent maturing period. Accumulation of maximum growing degree days/heat units for the 15th April and 1st May planting during
both the years provided a clue that 15th April to 1st May is the best planting time
for better cotton crop to harvest good yield (Table 4). The yield of 1st April was
Figure 1. Graphical presentation of regression analysis among seed cotton yield and planting dates.
Table 4. Relationship between growing degree days and seed cotton yield (kg∙ha−1).
Planting dates Growing degree days Seed cotton yield (kg∙ha−1)
2015-16 2016-17 Mean
15th March 1678.50 1663.00 1670.75 1792.50 c 1st April 1876.30 1845.50 1860.90 2026.00 ab 15th April 2183.33 2130.50 2156.91 2096.70 a
1st May 2114.34 2091.50 2102.92 1926.00 bc 15th May 2123.44 2116.00 2119.72 1643.00 d 1st June 2003.12 1982.50 1992.81 1109.30 e
LSD0.05 135.55
Means followed by similar letters are not significantly different at 5% level of probability.
yield related attributes because temperature is the primary factor which governs the crop growth rate [22].
4. Conclusion
The present finding suggested that number of bolls, boll weight and seed cotton yield have been significantly affected by the genotypes and growing conditions under the various planting times. To harvest good output in terms of yield, ac-cumulation of GDD/CHU plays a vital role in modelling cotton to the expected global warming in the future. Variation among cotton attributes might be at-tributed to temperature based on different climatic conditions prevailed during the crop life cycle. It is thus concluded that 15th April to 1st May is the optimum
[image:8.595.209.540.337.502.2]References
[1] Chakaraborty, S., Tiedemann, A.V. and Teng, P.S. (2000) Climate Change: Potential Impact on Plant Diseases. Environmental Pollution, 108, 317-326.
https://doi.org/10.1016/S0269-7491(99)00210-9
[2] Reddy, K.R., Hodges, H.F. and Mckinion, M. (1997) A Comparison of Scenarios for the Effect of Global Climate Change on Cotton Growth and Yield. Australian Jour-nal of Plant Physiology, 24, 707-713. https://doi.org/10.1071/PP96138
[3] Karl, T.R., Melillo, J.M. and Peterson, T.C. (2009) Global Climate Change Impacts in the United States. Cambridge University Press, USA.
[4] Sing, R.P., Parsad, P.V.V., Sunita, K., Giri, S.N. and Reddy, K.R. (2007) Influence of High Temperature and Breeding for Heat Tolerance in Cotton: A Review.Advances in Agronomy, 93, 313-385. https://doi.org/10.1016/S0065-2113(06)93006-5
[5] Pettigrew, T.W. (2003) Physiological Consequences of Moisture Deficit Stress in Cotton. Crop Science, 44, 1265-1272. https://doi.org/10.2135/cropsci2004.1265 [6] Ton, P. (2010) Cotton and Climate Change: Impacts and Options to Mitigate and
Adapt. Ton Consultancy, Amsterdam.
[7] International Trade Centre (2011) Cotton and Climate Change: Impacts and Op-tions to Mitigate and Adapt. Geneva: ITC, 2011. xii, 32 p. (Technical Paper). Doc. No.MAR-11-200. E.
[8] Dwyer, L.M. and Stewart, D.W. (1986) Leaf Area Development in Field Grown Maize. Agronomy Journal, 78, 334-343.
https://doi.org/10.2134/agronj1986.00021962007800020024x
[9] Steel, R.G.D., Torrie, J.H. and Dickey, D.A. (1997) Principles and Procedures of Sta-tistics: A Biometrical Approach. 3rd Edition, McGraw-Hill, New York.
[10] Snedecor, G.W. and Cochran, W.G. (1983) Statistical Methods. 6th Edition, Oxford and IBH, New Delhi.
[11] Freed, R., Einensmith, S.P., Gutez, S., Reicosky, D., Smail, V.W. and Wolberg, P. (1989) User’s Guide to MSTAT-C Analysis of Agronomic Research Experiments. Michigan State University, East Lansing.
[12] Machado, J.R.D.A., Penna, J.C.V., Fallieri, J., Santos, P.G. and Lanza, M.A. (2002) Stability and Adaptability of Seed Cotton Yields of Upland Cotton Genotypes in the State of Minas Gerais, Brazil. Crop Breeding and Applied Biotechnology, 2, 401- 410.https://doi.org/10.12702/1984-7033.v02n03a10
[13] Ullah, K., Khan, N., Usman, Z., Ullah, R., Saleem, F.Y., Shah, S.A.I. and Salman, M. (2016) Impact of Temperature on Yield and Related Traits in cotton Genotypes.
Journal of Integrative Agriculture, 15, 678-683.
https://doi.org/10.1016/S2095-3119(15)61088-7
[14] Unay, A., Basal, H., Erkul, A. and Yuksekkaya, Z. (2004) Stability Analysis of Upl-and Cotton Genotypes to the Aegean Region in Turkey. Asian Journal of Plant Sciences, 3, 36-38.https://doi.org/10.3923/ajps.2004.36.38
[15] Satish, Y., Jain, P.P. and Chhabra, B.S. (2009) Stability Analysis for Yield and Its Component Traits in American Cotton (G. hirsutum L.). Journal of Cotton Re-search and Development, 23, 175-182.
[16] Khan, N.G., Naveed, M. and Khan, N.I. (2008) Assessment of Some Novel Upland Cotton Genotypes for Yield Constancy and Malleability. International Journal of Agriculture and Biology, 10, 109-111.
[18] Khan, N.U. (2013) Diallel Analysis of Cotton Leaf Curl Virus (CLCuV) Disease, Earliness, Yield and Fiber Traits under CLCuV Infestation in Upland Cotton. Aus-tralian Journal of Crop Science, 7, 1955-1966.
[19] Batool, S., Khan, N.U., Gul, S., Baloch, M.J., Turi, N.A., Taran, S.A. and Saeed, M. (2013) Genetic Analysis for Yield and Yield Contributing Variables in Upland Cot-ton. Journal of Food Agriculture and Environment, 11, 624-630.
[20] Best, E.C. (2005) Source-Sink Relations in Cotton: Genetic and Environmental Af-fectors. MS Thesis, Texas Tech University, Texas, EUA.
[21] Ahmed, A.E., Abdalla, A.H. and Fadlalla, A.S. (2006) A Note on the Stability of Five Medium Staple Cotton (G. hirsutum L.) Varieties for Some Fibre Properties in the Gezira Scheme of the Sudan. University of Khartoum Journal of Agricultural Sciences, 14, 313-319.
[22] Kaleem, S., Hassan, F.U. and Saleem, A. (2009) Influence of Environmental Varia-tions on Physiological Attributes of Sunflower. African Journal of Biotechnology, 8, 3531-3539.
Submit or recommend next manuscript to SCIRP and we will provide best service for you:
Accepting pre-submission inquiries through Email, Facebook, LinkedIn, Twitter, etc. A wide selection of journals (inclusive of 9 subjects, more than 200 journals)
Providing 24-hour high-quality service User-friendly online submission system Fair and swift peer-review system
Efficient typesetting and proofreading procedure
Display of the result of downloads and visits, as well as the number of cited articles Maximum dissemination of your research work
Submit your manuscript at: http://papersubmission.scirp.org/