Estimation of genetic correlation via linkage disequilibrium score regression and
genomic restricted maximum likelihood
Guiyan Ni1,2, Gerhard Moser1,2, Schizophrenia Working Group of the Psychiatric Genomics Consortium, Naomi R. Wray 3,4, and S. Hong Lee 1,2,4*
1Centre for Population Health Research, School of Health Sciences and Sansom Institute of
Health Research, University of South Australia, Adelaide, South Australia, 5000, Australia
2School of Environmental and Rural Science, University of New England, Armidale, NSW,
2351, Australia
3Institute for Molecular Bioscience, University of Queensland, Brisbane, Queensland, 4072,
Australia.
4Queensland Brain Institute, University of Queensland, Brisbane, Queensland, 4072, Australia.
Correspondence:
ABSTRACT
Genetic correlation is a key population parameter that describes the shared genetic architecture
of complex traits and diseases. It can be estimated by current state-of-art methods, i.e. linkage
disequilibrium score regression (LDSC) and genomic restricted maximum likelihood (GREML).
The massively reduced computing burden of LDSC compared to GREML makes it an attractive
tool, although the accuracy (i.e., magnitude of standard errors) of LDSC estimates has not been
thoroughly studied. In simulation, we show that the accuracy of GREML is generally higher than
that of LDSC. When there is genetic heterogeneity between the actual sample and reference data
from which LD scores are estimated, the accuracy of LDSC decreases further. In real data
analyses estimating the genetic correlation between schizophrenia (SCZ) and body mass index,
we show that GREML estimates based on ~150,000 individuals give a higher accuracy than
LDSC estimates based on ~400,000 individuals (from combined meta-data). A GREML genomic
partitioning analysis reveals that the genetic correlation between SCZ and height is significantly
negative for regulatory regions, which whole genome or LDSC approach has less power to
detect. We conclude that LDSC estimates should be carefully interpreted as there can be
uncertainty about homogeneity among combined meta-data sets. We suggest that any interesting
findings from massive LDSC analysis for a large number of complex traits should be followed
up, where possible, with more detailed analyses with GREML methods, even if sample sizes are
MAIN TEXT
Genetic correlation is a key population parameter that describes the shared genetic
architecture of complex traits and diseases 1-3. The genetic correlation is the additive genetic covariance between two traits scaled by the square root of the product of the genetic variance for
each trait (i.e., the geometric mean of the trait variances). The sign of the correlation shows the
direction of sharing, and the parameter definition is based on genetic variants across the allelic
spectrum. Methods to estimate genetic correlation based on genetic covariance structure are well
established for both quantitative and disease traits, e.g. (restricted) maximum likelihood for
linear mixed models (LMM) 4-6. Genetic covariance structure can be derived from phenotypic records using pedigree information in twin or family-based designs 7. Recently, genome-wide single nucleotide polymorphism (SNP) data have been used to construct a genomic relationship
matrix for the genetic covariance structure in LMM that captures the contribution of causal
variants that are in linkage disequilibrium (LD) with the genotyped SNPs4; 8; 9. Such estimates assume that the genetic correlation estimated from common SNPs is representative of the
parameter that depends on all genetic variants; this seems like a reasonable assumption.
In contrast to the genomic restricted maximum likelihood (GREML) approach, a linkage
disequilibrium score regression (LDSC) 10; 11 method does not require individual-level genotype data but instead uses GWAS summary statistics, regressing association test statistics of SNPs on
their LD scores. The LD score of a SNP is the sum of LD r2 measured with all other SNPs, and can be calculated in a reference sample of the same ethnicity when individual genotype data are
not available for the GWAS sample, under the assumption that the GWAS sample has been
drawn from the same ethnic population as the reference sample used to calculate the LD scores.
under polygenicity. Because of this simplicity, and the massively reduced computing burden in
terms of memory and time, it is feasible for LDSC to be applied to a large number of multiple
traits, e.g. Bulik-Sullivan et al. 11, Zheng et al. 12, Finucane et al. 13 .
Given the attractiveness of LDSC for a massive analysis of many sets of GWAS
summary statistics, it has been widely used in the community. However, genetic correlations
estimated by LDSC are often reported without caution although the approach is known to be less
accurate, compared to GREML11. In fact, the accuracies of LDSC estimates have not been thoroughly studied.
In this report, we compare both the bias (difference between the simulated true value and
estimated value) and accuracy (i.e. magnitude of the standard error of an estimate, SE) between
GREML and LDSC for estimation of genetic correlation. We find that both methods show little
evidence of bias. However, LDSC is less accurate as reported in Bulik Sullivan et al.11, with SE at least more than 1.5-fold higher than that of GREML regardless of the number of samples in
data used to estimate the genetic correlation. When decreasing the number of SNPs, the accuracy
of LDSC decreases further. When increasing the degree of genetic heterogeneity between the
actual sample and reference data from which LD scores are estimated, the SE of LDSC estimates
are up to 3-fold larger than those of the GREML estimates. We also show that GREML is more
accurate in genomic partitioning analyses over LDSC or stratified LDSC (sLDSC). In genomic
partitioning analyses the genetic parameters are estimated for genomic subsets defined by
user-specified annotations. In analyses of real data, we show that GREML is more accurate and
powerful, e.g. GREML estimates based on ~ 150,000 individuals give a higher accuracy than
LDSC estimates based on 400,000 individuals in estimating genetic correlation between
GREML vs. -0.087 (SE=0.019) and p-value=4.91E-06 for LDSC). In these analyses, the
GREML estimate is based on UK sample only whereas the LDSC estimate is based on combined
meta-data sets among which there is uncertainty about homogeneity. Furthermore, a GREML
genomic partitioning analysis reveals that the genetic correlation between SCZ and height is
significantly negative for regulatory regions, which is less obvious by LDSC both when using
whole-genome or partitioned estimates of genetic correlation.
In the main methods, we used GREML14; 15 and LDSC10; 11 to compare their estimates of genetic correlation using simulated as well as real data. Simulations were based on UK Biobank
imputed genotype data (UKBB16) after stringent quality control (QC) (see Supplemental Methods). We calculated a ratio of empirical SE and its 95% confidence interval (CI) to assess
the accuracy of the methods for each set of simulated data. The 95% CIs of SE were estimated
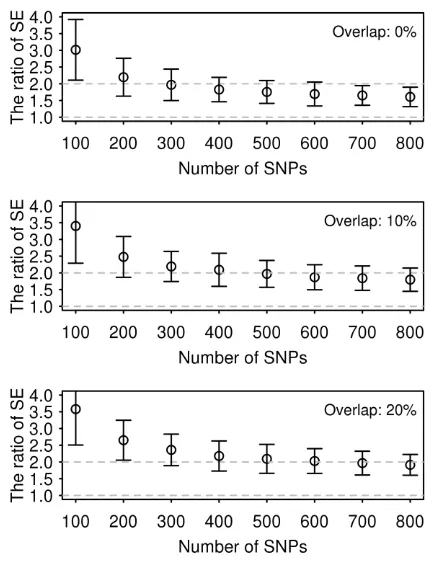
based on the delta method17. When estimating genetic correlation using simulated phenotypes based on UKBB genotype data we found that the estimates were unbiased for both GREML and
LDSC (Figure S1), but the SE of GREML was at least 1.5 times smaller than that of LDSC
(Figure 1). The ratio of the empirical SE from LDSC to GREML was increased up to 3.5-fold
when using a smaller number of SNPs (Figure 1). All values of the ratio were significantly
different from 1. It is notable that the SE of GREML estimates showed almost no difference
across different numbers of SNPs whereas that of LDSC estimates gradually increased with a
smaller number of SNPs (Figure S2). The ratio was invariant to sample size (Figure S3). As
expected, when using the intercept constrained to zero, LDSC estimates were substantially
biased when there were overlapping samples (Figure S4). We also explored alternative genetic
architectures (Figure S5), which consistently showed that GREML gives a smaller SE than
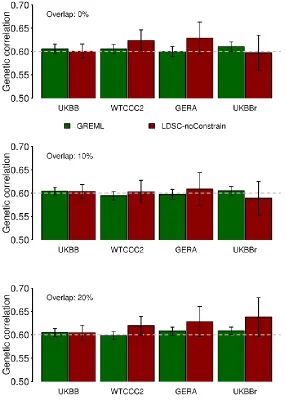
To explore the stability of the accuracy for both methods, we used two additional
genotype data sets without imputation, Wellcome trust case control consortium 2 (WTCCC218-21 ) and genetic epidemiology research on adult health and aging cohort (GERA22; 23), which are publicly available (see Supplemental Methods for detailed data descriptions). We also used
UKBB raw (non-imputed) genotype data (UKBBr). We calculated the correlation between the
LD scores for the HapMap3 SNPs estimated based on the 1KG CEU reference sample
(downloaded from https://data.broadinstitute.org/alkesgroup/LDSCORE/) and those based on
in-sample genotype data, i.e. UKBB, WTCCC2, GERA and UKBBr data set (Table 1). We found
that the WTCCC2, GERA or UKBBr (raw) genotypes were less similar to the 1KG reference
genotypes, compared to the UKBB (imputed) genotypes (noting that UKBB samples had been
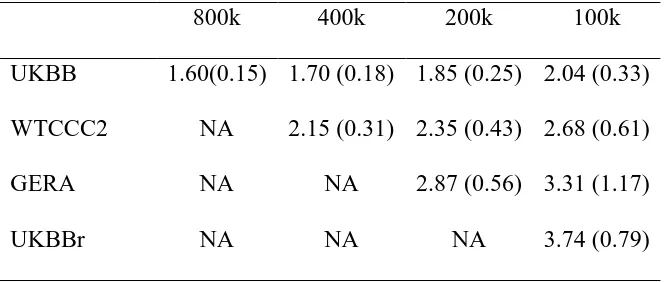
imputed to the combined data of 1KG reference and UK10K data). Table 2 shows that the SE
ratio of LDSC estimate to GREML estimate was higher for WTCCC2, GERA or UKBBr than
that for UKBB. Figure 2 shows that the accuracy of GREML was consistent across different data
sets, whereas that of LDSC was decreased for WTCCC2, GERA or UKBBr, compared to UKBB
data set. This was probably due to higher (or lower) correlation between LD scores based on the
1KG reference and the in-sample genotype data sets (Table 1) which might positively or
(negatively) affect the accuracy of LDSC estimates. For WTCCC2, GERA and UKBBr data, the
SE ratio of LDSC to GREML based on different number of individuals is shown in Figures S6,
S7 and S8.
Genome partitioning analyses are an emerging tool to estimate the genetic variance and
covariance explained by functional categories (e.g. DNase I hypersensitive sites (DHS) and
non-DHS 24). Currently, genomic partitioning analyses focus on SNP-heritability enrichment
are proportional to the number of SNPs allocated to each annotation. Considering genomic
partitioning in cross-disorder analyses is a natural extension to identify regions where genetic
correlations between disorders are highest and lowest. Here, we assessed the performance of the
methods in the context of genome partitioning analyses using simulated phenotypes based on
UKBB genotype data. A better LDSC approach to estimate genetic correlation for each category
might be sLDSC, stratifying by genomic annotation; however, this method is currently under
development (i.e. there is software (see Web Resources), but there is no published document or
paper verifying the method). Nonetheless, since the sLDSC is available to the research
community, we applied both LDSC and sLDSC to estimate partitioned genetic correlations for
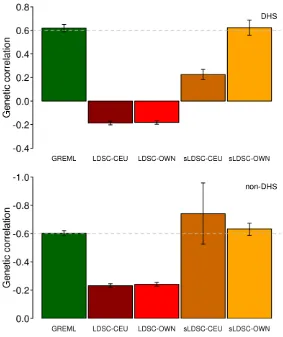
the simulated data (Supplemental Methods). For genome partitioning analyses, we showed that
LDSC estimates of genetic correlation were biased whether using LD-scores estimated from the
1KG reference or in-sample data (UKBB) while GREML estimates gave unbiased estimates for
each functional category (Figure 3). sLDSC estimates were unbiased only when using LD-scores
from the in-sample data, and their SEs are relatively larger than those of GREML or LDSC
(Figure 3). This was probably due to the fact that the different distribution of causal variants and
their effects between DHS and non-DHS regions were better captured by an explicit covariance
structure fitted in GREML. We also applied the methods to a range of simulation scenarios and
found similar results in that GREML performed better than LDSC or sLDSC (Figure S9 and
Table S1), which was consistent with the previous results (Figures 1 and 2). It is notable that in a
deliberately severe scenario (e.g. causal variants are simulated only within few kb of a boundary)
GREML could give biased estimation of genetic correlation 13; 24 .
While focusing on the accuracy of genetic correlation estimates, there is an important
When using the WTCCC2, GERA and UKBBr data, which were less similar to the 1KG
reference genotypes, compared to the UKBB data, LDSC estimates were substantially biased
whereas GREML estimates were close to the true value in estimation of SNP heritability (Figure
S10). However, this result is well known and LDSC was not recommended for SNP heritability
by the original authors 10, but rather for relative enrichment analysis. Despite this, LDSC is widely used for SNP-heritability estimation (because it is quick and simple). Thus, for
completeness we include analyses for different scenarios to quantify the properties of the
methods. When reducing the number of SNPs, estimated SNP-heritabilities from LDSC were
consistently unbiased; however, those from GREML were proportionally underestimated (Figure
S11). When using non-HapMap3 SNPs, LDSC estimates were consistently biased (Figure S12)
and less accurate, compared to GREML estimates (Figures S13 and S14), which probably
explains why LDSC is implemented using only HapMap3 SNPs. Although the genetic
correlation is robust to such biasedness 4; 11, SNP-heritability itself should be carefully interpreted for both GREML and LDSC. We also noted that LDSC and sLDSC estimates for
SNP-heritability were biased in the genome partitioning analysis (Figure S15) although the
estimated enrichment was close to the true value when using sLDSC and in-sample LD scores
(Figure S15).
We used real phenotype and individual genotype data from the Psychiatric Genomics
Consortium (PGC) and UKBB to estimate genetic variance and covariance between SCZ and
BMI using LDSC and GREML (Table 3 and Figure S16). We also used publicly available
GWAS summary statistics for LDSC to see how much the SE of estimates could be reduced by
increasing the number of samples and number of SNPs. For real data analyses, we obtained
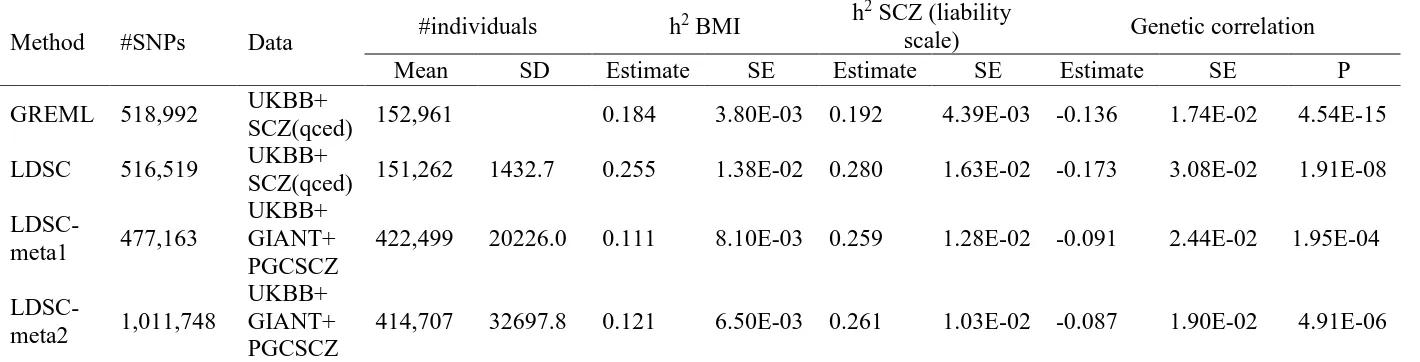
SNP-heritability were 0.192 (SE 0.004) and 0.280 (SE 0.016) for SCZ and 0.184 (SE 0.004) and 0.255
(SE 0.014) for BMI. The notable difference between GREML and LDSC was probably because
of a relatively small number of SNPs (500K) that might result in underestimated GREML
SNP-heritability (see Figure S11). This is one of the caveats of using GREML with real data that
usually comprise multiple cohorts genotyped on different platforms, such that, even with
imputation, the overlapping set of SNPs imputed with high confidence may be limited. The
estimated genetic correlation for GREML and LDSC was -0.136 (SE 0.017) and -0.173 (SE
0.031). This indicated that the GREML estimate was 3.5 and 1.8 times more precise than LDSC
estimates for the SNP-heritability and genetic correlation, respectively. For LDSC, we also
considered using additional GWAS summary statistics from publicly available resources25; 26. The sample sizes used for additional LDSC analyses (LDSC-meta) are summarized in Table 3.
The estimated SNP-heritability was 0.259 (SE 0.019) for SCZ and 0.121 (SE 0.007) for BMI,
and the estimated genetic correlation was -0.087 (SE 0.019). Although sample size was increased
2.7-fold, the SE of LDSC estimate was not smaller than that for GREML estimate (SE = 0.017
vs. 0.019, and p-value = 4.54E-15 vs. 4.91E-06 for GREML vs. LDSC) (Table 3). It should be
noted that GREML estimates used a homogeneous population (within UK and after stringent QC
excluding population outliers) whereas LDSC-meta1 and -meta2 were based on combined
meta-data sets consisting of ~ 80 different studies for which there is much more uncertainty about
homogeneity than when using a single study cohort such as UKBB. The large difference of the
estimates between LDSC and LDSC-meta1 (or -meta2) was probably due to the fact that
heterogeneity among the 80 different studies resulted in underestimation of the common genetic
variance and covariance, and that the difference of LD scores between the target and 1KG
data27 and found a similar pattern in that GREML estimates were more accurate than LDSC estimates whether using the same data or using additional GWAS summary statistics for LDSC
(Figure S17 and Table S2).
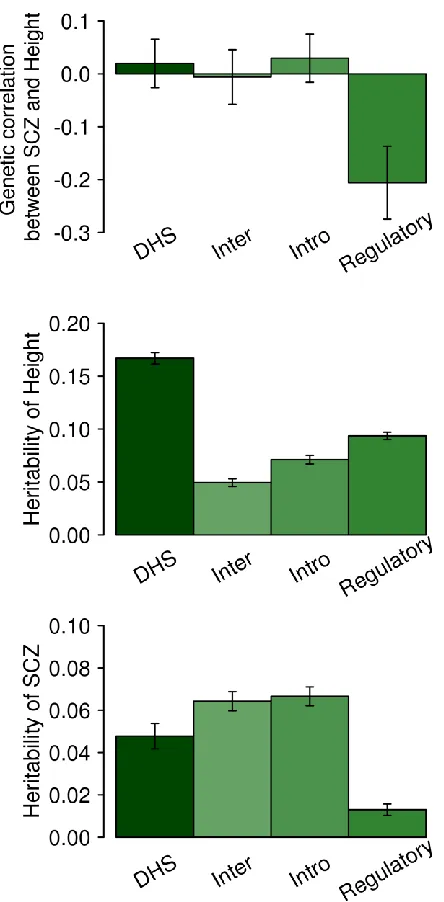
In the real data analyses, we carried out a functional category analysis partitioning the
genome into regulatory, DHS, intronic and intergenic regions using GREML (Figure 4 for
SCZ/height and Figure S18 for SCZ/BMI). For SCZ and height, the genetic correlation for the
regulatory region was negative and significantly different from 0 (p-value = 0.0028; Figure 4).
We also compared the results with the LDSC genetic correlation estimation (Figure S19 and
S20), and show that the estimates were similar between LDSC and GREML. However, GREML
had a lower p-value (0.0028 in Figure 4) than LDSC using LD-scores from the 1KG reference
data (p-value = 0.04) or using LD-scores from the in-sample data (p-value = 0.007). We note that
current sLDSC software does not provide a SE of estimated partitioned genetic correlation for
each category; therefore we did not attempt using the software for the real data analysis. For
SNP-heritability estimation, the SE of the estimate for each category was much lower for
GREML than sLDSC, ranging from 2.2 to 5.9-fold (Table S3).
Box 1. Summary points
1. GREML and LDSC can both provide unbiased estimates of the genetic correlation between
two traits. GREML requires individual level genotype data, while LDSC requires only
association summary statistics and LD scores per SNP. If LD scores have been calculated from
the same sample as the association statistics, then GREML and LDSC provide similar estimates
of the genetic correlation. However, in practice LD scores are estimated from external reference
samples of the same broad ethnicity, which can lead to bias in the estimates (Figure S21 and
reporting the estimate with a lower SE. The theoretical SE of the estimates is a reliable indicator
to determine the better estimator, which agrees well with the empirical SE (from simulation
replicates) (Figure S23).
2. When combining multiple data sets to estimate genetic correlations between multiple traits, it
is possible, in practice, that the number of SNPs remaining after QC is relatively small. When the
number of available SNPs is small, the SE of LDSC estimates for genetic correlation can be
increased relatively more, compared to that of GREML estimates (Figure S2).
3. SNP-heritability has a different property, compared to genetic correlation since the latter is
robust to biased estimation of genetic variance and covariance (presumably the biases occur in
the numerator and denominator and hence approximately cancel out)4; 11. Especially when using a small number of SNPs (< 500K) for GREML or when using multiple meta-data sets for LDSC,
estimated SNP-heritability itself should be reported with caution as both methods can give biased
estimates.
4. When using a study cohort, it is desirable to measure heterogeneity between the cohort and
1KG reference data (e.g. measuring the correlation between LD scores estimated based on the
cohort and 1KG reference data as in Table 1). If the correlation is not close to one, LDSC
estimates should be carefully interpreted. We recommend that when GWAS summary statistics
are provided, cohort specific LD scores are provided also. It is also warranted that an optimal
approach to meta-analyse LD scores across multiple cohorts should be developed to improve
LDSC performance 28.
5. When using extensive meta-data that possibly include heterogeneous sources, there are two
poor representation of the LD scores of the heterogeneous meta-data, such that the accuracy of
LDSC decreases. Second, the distribution of causal variants and pleiotropic effects may be
different between heterogeneous sources such that the estimates can be biased (capturing only
common effects between heterogeneous sources). This implies that LDSC estimates should be
reported with caution when using extensive meta-data sets (Table 3).
6. One of advantages of having access to individual-level genotype data comes when more
detailed analyses are required, such as genomic partitioning analyses. As shown in Figure 4, a
GREML genomic partitioning analysis reveals a significant negative genetic correlation between
SCZ and height for the regulatory region, which genome-wide GREML or LDSC approach has
less power to detect.
LDSC and GREML are the methods that have been widely used in estimating genetic
correlation, shedding light on the shared genetic architecture of complex traits, based on
genome-wide SNPs. Two critical parameters for assessing methods are bias (whether the
estimates over replicated analyses differ from the true value) and accuracy (reflected by the
standard error of the estimate). Although the property of the accuracy of GREML has been
thoroughly studied and tested 29; 30, that of LDSC has not been sufficiently investigated. In this report, we compare the accuracy of GREML and LDSC estimates based on various scenarios
using simulated as well as real data sets, and draw simple but useful guidelines (Box 1).
Both GREML and LDSC are methods that aim to estimate the same genetic correlation
parameter based on genetic variants across the allelic spectrum as defined earlier and the
if all required assumptions are met. GREML estimates variance/covariance components based on
genetic covariance structure estimated from available (in-sample) individual genotypes; whereas
LDSC estimates variance/covariance components based on association test statistics corrected
for LD structure inferred from the markers in the reference panel (e.g. 1KG of the same
ethnicity). The underlying assumption is that the samples generating the GWAS summary
statistics are drawn from the same population as the samples generating the LDSC statistics, but
here we showed that there can be LD-structure (LD-scores) differences between in-sample and
reference data, which impacts parameter estimations (Tables 1 and 2 and Figure S10).
The reduced computing burden of LDSC over GREML makes it the method of choice for
generating a quick overview of the genetic relationship between disorders (Table S4). However,
our results suggest that important associations could be overlooked. For example, Bulik-Sullivan
et al.11 reported a negative genetic correlation between BMI and SCZ estimated by LDSC (Estimate = -0.095, SE = 0.025 with p-value = 1.75E-4) which was not significant after
Bonferroni correction for the multiple testing. Because of the limited power from LDSC
analysis, the shared genetic architecture between BMI and SCZ, perhaps, has had less attention
than it is due. We confirmed the negative genetic correlation between BMI and SCZ with a
greater confidence (Estimate = -0.136, p-value = 4.54E-15) using GREML. A second example is
in analyses investigating the shared genetic architecture between height and SCZ, in which
epidemiological evidence points to a negative association 31, supported by genetic analyses 32. However, there was no evidence of genetic correlation between height and SCZ in
whole-genome level analyses of Bulik-Sullivan et al. 11 (Estimate = -0.002, SE = 0.022). We used a GREML genomic partitioning analysis and found a significant negative genetic correlation
region was highly enriched for height (Estimate = 0.094, p-value = 7.60E-92 in Table S3), which
intuitively supports a significant genetic correlation with SCZ for the region. As shown in Figure
3 and Figure S15, the GREML estimate was closer to the true values with a lower SE than LDSC
or sLDSC estimate in simulated data. For the real data analyses (Table S3), GREML had more
accurate SNP-heritability estimates (lower SE) than sLDSC. Moreover, the sum of each category
matched well with the estimate of the whole-genome for GREML whereas this was not the case
for sLDSC (Tables S3).
Here we focused on genetic correlation estimates, and did not consider a number of
alternative approaches that have been explored in detail for estimation of SNP-heritability, e.g.
LDAK approach33, Weighted genomic relationship matrix34, MAF stratified29 and LD-MAF stratified approaches 35. It was beyond the scope of our study to assess if biasedness and accuracy can be improved with these methods, although a general observation is that biases in
SNP-heritability estimation can ‘cancel’ in estimates of genetic correlations, as biases impact
both the numerator and denominator of the genetic correlation quotient4; 11. We note that while under review, two new methods to estimate stratified genetic correlations via GWAS summary
statistics 36; 37 have been published as alternatives to sLDSC. Those approaches also need
external reference samples to infer LD-structure in the actual sample, implying the same problem
as for LDSC (#4 and 5 in Box 1). However, to partially address this problem one method 36 achieves smaller standard errors than sLDSC through a block diagonalization of the LD matrix.
A further study is needed to make explicit comparisons with GREML.
In conclusion, LDSC may be the best tool for a massive analysis of multiple sets of
GWAS summary statistics in estimating genetic correlation between complex traits, because of
sample sizes than those with individual genotype data. However, LDSC estimates should be
carefully interpreted, considering the summary points (Box 1). Any interesting findings from
LDSC analyses should be followed up, where possible, with more detailed analyses using
individual genotype data and with GREML methods, even though sample sizes with individual
genotype data may be smaller.
SUPPLEMENTAL DATA DESCRIPTION
The Supplemental Data include 23 figures, four tables, supplementary methods, consortium
members and affiliations, and supplementary references.
CONSORTIA
The members of the Schizophrenia Working Group of the Psychiatric Genomics Consortium are
Stephan Ripke, Benjamin M. Neale, Aiden Corvin, James T. R. Walters, Kai-How Farh, Peter A.
Holmans, Phil Lee, Brendan Bulik-Sullivan, David A. Collier, Hailiang Huang, Tune H. Pers,
Ingrid Agartz, Esben Agerbo, Margot Albus, Madeline Alexander, Farooq Amin, Silviu A.
Bacanu, Martin Begemann, Richard A. Belliveau Jr, Judit Bene, Sarah E. Bergen, Elizabeth
Bevilacqua, Tim B. Bigdeli, Donald W. Black, Richard Bruggeman, Nancy G. Buccola, Randy
L. Buckner, William Byerley, Wiepke Cahn, Guiqing Cai, Dominique Campion, Rita M. Cantor,
Vaughan J. Carr, Noa Carrera, Stanley V. Catts, Kimberly D. Chambert, Raymond C. K. Chan,
Ronald Y. L. Chen, Eric Y. H. Chen, Wei Cheng, Eric F. C. Cheung, Siow Ann Chong, C.
Robert Cloninger, David Cohen, Nadine Cohen, Paul Cormican, Nick Craddock, James J.
Favero, Ditte Demontis, Dimitris Dikeos, Timothy Dinan, Srdjan Djurovic, Gary Donohoe,
Elodie Drapeau, Jubao Duan, Frank Dudbridge, Naser Durmishi, Peter Eichhammer, Johan
Eriksson, Valentina Escott-Price, Laurent Essioux, Ayman H. Fanous, Martilias S. Farrell, Josef
Frank, Lude Franke, Robert Freedman, Nelson B. Freimer, Marion Friedl, Joseph I. Friedman,
Menachem Fromer, Giulio Genovese, Lyudmila Georgieva, Ina Giegling, Paola
Giusti-Rodrı´guez, Stephanie Godard, Jacqueline I. Goldstein, Vera Golimbet, Srihari Gopal, Jacob
Gratten, Lieuwe de Haan, Christian Hammer, Marian L. Hamshere, Mark Hansen, Thomas
Hansen, Vahram Haroutunian, Annette M. Hartmann, Frans A. Henskens, Stefan Herms, Joel N.
Hirschhorn, Per Hoffmann, Andrea Hofman, Mads V. Hollegaard, David M. Hougaard, Masashi
Ikeda, Inge Joa, Antonio Juliá, René S. Kahn, Luba Kalaydjieva, Sena Karachanak-Yankova,
Juha Karjalainen, David Kavanagh, Matthew C. Keller, James L. Kennedy, Andrey Khrunin,
Yunjung Kim, Janis Klovins, James A. Knowles, Bettina Konte, Vaidutis Kucinskas, Zita
Ausrele Kucinskiene, Hana Kuzelova-Ptackova, Anna K. Kähler, Claudine Laurent, Jimmy Lee
Chee Keong, Sophie E. Legge, Bernard Lerer, Miaoxin Li, Tao Li, Kung-Yee Liang, Jeffrey
Lieberman, Svetlana Limborska, Carmel M. Loughland, Jan Lubinski, Jouko Lönnqvist, Milan
Macek Jr, Patrik K. E. Magnusson, Brion S. Maher, Wolfgang Maier, Jacques Mallet, Sara
Marsal, Manuel Mattheisen, Morten Mattingsda, Robert W. McCarley, Colm McDonald,
Andrew M. McIntosh, Sandra Meier, Carin J. Meijer, Bela Melegh, Ingrid Melle, Raquelle I.
Mesholam-Gately, Andres Metspalu, Patricia T. Michie, Lili Milani, Vihra Milanova, Younes
Mokrab, Derek W. Morris, Ole Mors, Kieran C. Murphy, Robin M. Murray, Inez
Myin-Germeys, Bertram Müller-Myhsok, Mari Nelis, Igor Nenadic, Deborah A. Nertney, Gerald
Nestadt, Kristin K. Nicodemus, Liene Nikitina-Zake, Laura Nisenbaum, Annelie Nordin,
Olsen, Jim Van Os, Psychosis Endophenotypes International Consortium, Christos Pantelis,
George N. Papadimitriou, Sergi Papio, Elena Parkhomenko, Michele T. Pato, Tiina Paunio,
Milica Pejovic-Milovancevic, Diana O. Perkins, Olli Pietiläinenl, Jonathan Pimm, Andrew J.
Pocklington, John Powell, Alkes Price, Ann E. Pulver, Shaun M. Purcell, Digby Quested, Henrik
B. Rasmussen, Abraham Reichenberg, Mark A. Reimers, Alexander L. Richards, Joshua L.
Roffman, Panos Roussos, Douglas M. Ruderfer, Veikko Salomaa, Alan R. Sanders, Ulrich
Schall, Christian R. Schubert, Thomas G. Schulze, Sibylle G. Schwab, Edward M. Scolnick,
Rodney J. Scott, Larry J. Seidman, Jianxin Shi, Engilbert Sigurdsson, Teimuraz Silagadze,
Jeremy M. Silverman, Kang Sim, Petr Slominsky, Jordan W. Smoller, Hon-Cheong So, Chris C.
A. Spencer, Eli A. Stah, Hreinn Stefansson, Stacy Steinberg, Elisabeth Stogmann, Richard E.
Straub, Eric Strengman, Jana Strohmaier, T. Scott Stroup, Mythily Subramaniam, Jaana
Suvisaari, Dragan M. Svrakic, Jin P. Szatkiewicz, Erik Söderman, Srinivas Thirumalai, Draga
Toncheva, Sarah Tosato, Juha Veijola, John Waddington, Dermot Walsh, Dai Wang, Qiang
Wang, Bradley T. Webb, Mark Weiser, Dieter B. Wildenauer, Nigel M. Williams, Stephanie
Williams, Stephanie H. Witt, Aaron R. Wolen1, Emily H. M. Wong, Brandon K. Wormley,
Hualin Simon Xi, Clement C. Zai, Xuebin Zheng, Fritz Zimprich, Kari Stefansson, Peter M.
Visscher, Wellcome Trust Case-Control Consortium, Rolf Adolfsson, Ole A. Andreassen,
Douglas H. R. Blackwood, Elvira Bramon, Joseph D. Buxbaum, Anders D. Børglum, Sven
Cichon, Ariel Darvasi, Enrico Domenici, Hannelore Ehrenreich, Tõnu Esko, Pablo V. Gejman,
Michael Gill, Hugh Gurling, Christina M. Hultman, Nakao Iwata, Assen V. Jablensky, Erik G.
Jönsson, Kenneth S. Kendler, George Kirov, Jo Knight, ToddLencz, Douglas F. Levinson,
Jennifer L. Moran, Preben B. Mortensen, Bryan J. Mowry, Markus M. Nöthen, Roel A. Ophoff,
Michael J. Owen, Aarno Palotie, Carlos N. Pato,Tracey L. Petryshen, Danielle Posthuma,
Marcella Rietsche, Brien P. Riley, Dan Rujescu, Pak C. Sham, Pamela Sklar, David St Clair,
Daniel R. Weinberger, Jens R. Wendland, Thomas Werge, Mark J. Daly,Patrick F. Sullivan &
Michael C. O’Donovan
ACKNOWLEDGEMENTS
This research is supported by the Australian National Health and Medical Research Council
(1080157, 1087889), and the Australian Research Council (DP160102126, FT160100229). This
research has been conducted using the UK Biobank Resource. UK Biobank
(http://www.ukbiobank.ac.uk) Research Ethics Committee (REC) approval number is
11/NW/0382. Our reference number approved by UK Biobank is 14575. GERA data came from
a grant, the Resource for Genetic Epidemiology Research in Adult Health and Aging (RC2
AG033067; Schaefer and Risch, PIs) awarded to the Kaiser Permanente Research Program on
Genes, Environment, and Health (RPGEH) and the UCSF Institute for Human Genetics. The
RPGEH was supported by grants from the Robert Wood Johnson Foundation, the Wayne and
Gladys Valley Foundation, the Ellison Medical Foundation, Kaiser Permanente Northern
California, and the Kaiser Permanente National and Northern California Community Benefit
Programs. The RPGEH and the Resource for Genetic Epidemiology Research in Adult Health
and Aging are described in the following publication, Schaefer C., et al., The Kaiser Permanente
Research Program on Genes, Environment and Health: Development of a Research Resource in a
Multi-Ethnic Health Plan with Electronic Medical Records, In preparation, 2013. This study
investigators who contributed to the generation of the WTCCC data is available from
www.wtccc.org.uk. Funding for the WTCCC project was provided by the Wellcome Trust under
award 076113, 085475 and 090355.
WEB RESOURCES
LDSC: https://github.com/bulik/ldsc
MTG2: https://sites.google.com/site/honglee0707/mtg2
PGC GWAS results: http://www.med.unc.edu/pgc
GIANT GWAS results:
https://portals.broadinstitute.org/collaboration/giant/index.php/GIANT_consortium_data_files
UK Biobank: http://www.ukbiobank.ac.uk
WTCCC2: https://www.wtccc.org.uk/ccc2/
REFERENCE
1. Mehta, D., Tropf, F.C., Gratten, J., Bakshi, A., Zhu, Z., Bacanu, S.-A., Hemani, G., Magnusson, P.K.E., Barban, N., Esko, T., et al. (2016). Evidence for genetic overlap between schizophrenia and age at first birth in women. JAMA Psychiatry 73, 497-505.
2. Lee, S.H., Byrne, E.M., Hultman, C.M., Kähler, A., Vinkhuyzen, A.A.E., Ripke, S., Andreassen, O.A., Frisell, T., Gusev, A., Hu, X., et al. (2015). New data and an old puzzle: the negative association between schizophrenia and rheumatoid arthritis. International Journal of Epidemiology 44, 1706-1721.
3. Lee, S.H., DeCandia, T.R., Ripke, S., Yang, J., Sullivan, P.F., Goddard, M.E., Keller, M.C., Visscher, P.M., Wray, N.R., Genome-Wide, S.P., et al. (2012). Estimating the proportion of variation in
susceptibility to schizophrenia captured by common SNPs. Nat Genet 44, 247-250.
4. Lee, S.H., Yang, J., Goddard, M.E., Visscher, P.M., and Wray, N.R. (2012). Estimation of pleiotropy between complex diseases using single-nucleotide polymorphism-derived genomic relationships and restricted maximum likelihood. Bioinformatics 28, 2540-2542.
5. Harville, D.A. (1977). Maximum likelihood approaches to variance component estimation and to related problems. Journal of the American Statistical Association 72, 320-338.
6. Patterson, H.D., and Thompson, R. (1971). Recovery of Inter-Block Information when Block Sizes are Unequal. Biometrika 58, 545-554.
7. Neale, M., and Cardon, L. (2013). Methodology for genetic studies of twins and families.(Springer Science & Business Media).
8. VanRaden, P.M. (2008). Efficient Methods to Compute Genomic Predictions. Journal of Dairy Science 91, 4414-4423.
9. Yang, J., Lee, S.H., Goddard, M.E., and Visscher, P.M. (2011). GCTA: A tool for genome-wide complex trait analysis. American Journal of Human Genetics 88, 76-82.
10. Bulik-Sullivan, B.K., Loh, P.-r., Finucane, H.K., Ripke, S., Yang, J., Schizophrenia Working Group of the Psychiatric Genomics Consortium, Patterson, N., Daly, M.J., Price, A.L., and Neale, B.M. (2015). LD Score regression distinguishes confounding from polygenicity in genome-wide association studies. 47, 291-295.
11. Bulik-Sullivan, B., Finucane, H.K., Anttila, V., Gusev, A., Day, F.R., Loh, P.R., ReproGen Consortium, Psychiatric Genomics Consortium, Genetic Consortium for Anorexia of the Wellcome Trust Consortium, Duncan, L., et al. (2015). An Atlas of Genetic Correlations across Human Diseases and Traits. Natrure genetics 47, 1236-1241.
12. Zheng, J., Erzurumluoglu, A.M., Elsworth, B.L., Kemp, J.P., Howe, L., Haycock, P.C., Hemani, G., Tansey, K., Laurin, C., Pourcain, B.S., et al. (2017). LD Hub: a centralized database and web interface to perform LD score regression that maximizes the potential of summary level GWAS data for SNP heritability and genetic correlation analysis. Bioinformatics 33, 272-279.
13. Finucane, H.K., Bulik-sullivan, B., Gusev, A., Trynka, G., Reshef, Y., Loh, P.-r., Anttila, V., Xu, H., Zang, C., Farh, K., et al. (2015). Partitioning heritability by functional annotation using genome-wide association summary statistics. Nature genetics 47, 1228-1235.
14. Lee, S.H., and van der Werf, J. (2016). MTG2: An efficient algorithm for multivariate linear mixed model analysis based on genomic information. Bioinformatics 32, 1420-1422.
15. Maier, R., Moser, G., Chen, G.-B., Ripke, S., Absher, D., Agartz, I., Akil, H., Amin, F., Andreassen, Ole A., Anjorin, A., et al. (2015). Joint Analysis of Psychiatric Disorders Increases Accuracy of Risk Prediction for Schizophrenia, Bipolar Disorder, and Major Depressive Disorder. The American Journal of Human Genetics 96, 283-294.
17. Lynch, M., and Walsh, B. (1998). Genetics and analysis of quantitative traits.(Sinauer Sunderland, MA).
18. The International Multiple Sclerosis Genetics, C., Wellcome Trust Case Control, C., Sawcer, S., Hellenthal, G., Pirinen, M., Spencer, C.C.A., Patsopoulos, N.A., Moutsianas, L., Dilthey, A., Su, Z., et al. (2011). Genetic risk and a primary role for cell-mediated immune mechanisms in multiple sclerosis. Nature 476, 214-219.
19. Mells, G.F., Floyd, J.A.B., Morley, K.I., Cordell, H.J., Franklin, C.S., Shin, S.-Y., Heneghan, M.A., Neuberger, J.M., Donaldson, P.T., Day, D.B., et al. (2011). Genome-wide association study identifies 12 new susceptibility loci for primary biliary cirrhosis. Nature genetics 43, 329-332. 20. International Stroke Genetics Consortium, and Wellcome Trust Case Control Consortium. (2012).
Genome-wide association study identifies a variant in HDAC9 associated with large vessel ischemic stroke. Nature genetics 44, 328-333.
21. Tsoi, L.C., Spain, S.L., Knight, J., Ellinghaus, E., Stuart, P.E., Capon, F., Ding, J., Li, Y., Tejasvi, T., Gudjonsson, J.E., et al. (2012). Identification of 15 new psoriasis susceptibility loci highlights the role of innate immunity. Nat Genet 44, 1341-1348.
22. Banda, Y., Kvale, M.N., Hoffmann, T.J., Hesselson, S.E., Ranatunga, D., Tang, H., Sabatti, C., Croen, L.A., Dispensa, B.P., Henderson, M., et al. (2015). Characterizing Race/Ethnicity and Genetic Ancestry for 100,000 Subjects in the Genetic Epidemiology Research on Adult Health and Aging (GERA) Cohort. Genetics 200, 1285-1295.
23. Lee, S.H., Weerasinghe, W.M.S.P., Wray, N.R., Goddard, M.E., and van der Werf, J.H.J. (2017). Using information of relatives in genomic prediction to apply effective stratified medicine. Scientific Reports 7, 42091.
24. Gusev, A., Lee, S.H., Trynka, G., Finucane, H., Vilhjálmsson, B.J., Xu, H., Zang, C., Ripke, S., Bulik-Sullivan, B., and Stahl, E. (2014). Partitioning heritability of regulatory and cell-type-specific variants across 11 common diseases. The American Journal of Human Genetics 95, 535-552. 25. Schizophrenia Working Group of the Psychiatric Genomics Consortium. (2014). Biological insights
from 108 schizophrenia-associated genetic loci. Nature 511, 421-427.
26. Locke, A.E., Kahali, B., Berndt, S.I., Justice, A.E., Pers, T.H., Day, F.R., Powell, C., Vedantam, S., Buchkovich, M.L., and Yang, J. (2015). Genetic studies of body mass index yield new insights for obesity biology. Nature 518, 197-206.
27. Wood, A.R., Esko, T., Yang, J., Vedantam, S., Pers, T.H., Gustafsson, S., Chu, A.Y., Estrada, K., Luan, J.a., Kutalik, Z., et al. (2014). Defining the role of common variation in the genomic and biological architecture of adult human height. Nat Genet 46, 1173-1186.
28. Pasaniuc, B., and Price, A.L. (2016). Dissecting the genetics of complex traits using summary association statistics. Nature Reviews Genetics.
29. Lee, S.H., Yang, J., Chen, G.B., Ripke, S., Stahl, E.A., Hultman, C.M., Sklar, P., Visscher, P.M., Sullivan, P.F., Goddard, M.E., et al. (2013). Estimation of SNP heritability from dense genotype data. American Journal of Human Genetics 93, 1151-1155.
30. Speed, D., Hemani, G., Johnson, M.R., and Balding, D.J. (2012). Improved heritability estimation from genome-wide SNPs. American Journal of Human Genetics 91, 1011-1021.
31. Gunnell, D., Harrison, G., Whitley, E., Lewis, G., Tynelius, P., and Rasmussen, F. (2005). The association of fetal and childhood growth with risk of schizophrenia. Cohort study of 720,000 Swedish men and women. Schizophrenia research 79, 315-322.
32. Bacanu, S.-a., Chen, X., and Kendler, K.S. (2013). The genetic overlap between schizophrenia and height. Schizophrenia Research 151, 226-228.
34. de los Campos, G., Vazquez, A.I., Fernando, R., Klimentidis, Y.C., and Sorensen, D. (2013). Prediction of complex human traits using the genomic best linear unbiased predictor. PLoS genetics 9, e1003608-e1003608.
35. Yang, J., Bakshi, A., Zhu, Z., Hemani, G., Vinkhuyzen, A.A.E., Lee, S.H., Robinson, M.R., Perry, J.R.B., Nolte, I.M., and van Vliet-Ostaptchouk, J.V. (2015). Genetic variance estimation with imputed variants finds negligible missing heritability for human height and body mass index. Nature genetics 47, 1114.
36. Shi, H., Mancuso, N., Spendlove, S., and Pasaniuc, B. (2017). Local genetic correlation gives insights into the shared genetic architecture of complex traits. The American Journal of Human Genetics 101, 737-751.
FIGURE TITLES AND LEGENDS
Figure 1. The ratio of SE of LDSC estimate to that of GREML estimate using simulated
phenotypes based on UK Biobank genotypes.
Figure 2. Estimated genetic correlation with GREML and LDSC (without constrain to the
intercept) based on different genetic data sets.
Simulation was based on 10,000 individuals that were randomly selected from UKBB,
Figure 3. Estimated genetic correlation of simulated data based on a genomic partitioning
model.
Simulation was based on 10,000 individuals that were randomly selected from UKBB with 858K SNP. Based on Gusev et al.24 , the 858K SNPs across the genome were stratified as two
Figure 4. Genetic correlation between SCZ and height and heritability based on SNPs in
partitioned genomic regions estimated with GREML.
TABLE TITLES AND LEGENDS
Table 1. Correlation between LD scores estimated based on the HapMap3 SNPs using the 1KG
CEU reference sample and that from different target populations
Correlation Nr.SNPs
UKBBa 0.946 858,991
UKBBrb 0.720 123,615c
WTCCC2 0.899 421,035c
GERA 0.661 238,089c
aUKBB was imputed to the combined data of the 1KG reference and UK10K data. bUKBBr was based on the raw genotype data of UK Biobank data.
[image:27.612.141.473.515.656.2]cThe number of SNPs reduced further from the set of the QCed SNPs because of using only SNPs matched with the HapMap3 SNPs used in calculating LD scores.
Table 2. The ratio of SE of LDSC estimate to that of GREML estimate using simulated
phenotypes based on UKBB, WTCCC2, GERA and UKBBr genotypes in the scenarios without
overlapping individuals
800k 400k 200k 100k
UKBB 1.60(0.15) 1.70 (0.18) 1.85 (0.25) 2.04 (0.33)
WTCCC2 NA 2.15 (0.31) 2.35 (0.43) 2.68 (0.61)
GERA NA NA 2.87 (0.56) 3.31 (1.17)
Table 3. Heritability and genetic correlation based on different data sets
Method #SNPs Data #individuals h
2 BMI h2 SCZ (liability
scale) Genetic correlation
Mean SD Estimate SE Estimate SE Estimate SE P
GREML 518,992 UKBB+
SCZ(qced) 152,961 0.184 3.80E-03 0.192 4.39E-03 -0.136 1.74E-02 4.54E-15
LDSC 516,519 UKBB+
SCZ(qced) 151,262 1432.7 0.255 1.38E-02 0.280 1.63E-02 -0.173 3.08E-02 1.91E-08
LDSC-meta1 477,163
UKBB+ GIANT+ PGCSCZ
422,499 20226.0 0.111 8.10E-03 0.259 1.28E-02 -0.091 2.44E-02 1.95E-04
LDSC-meta2 1,011,748
UKBB+ GIANT+ PGCSCZ
414,707 32697.8 0.121 6.50E-03 0.261 1.03E-02 -0.087 1.90E-02 4.91E-06
GREML: Analysis was based on quality controlled genetic data for BMI (from UK Biobank with 111,019 individuals and 518,992 SNPs) and schizophrenia (from PGC with 41,630 individuals and 518,992 SNPs).
LDSC: The data sets used in LDSC were the same as in GREML.
LDSC-meta1: GWAS summary statistics for BMI were based on meta-analysed GWAS results of UKBB individual-level genetic data (with 111,019 individuals and 518,992 SNPs) and of GIANT (245,051 individuals and 477,163 SNPs). For SCZ, the GWAS summary statistics from the full PGC sample based on 77,096 individuals were used.
LDSC-meta2: The data sets used in LDSC-meta2 were the same as in LDSC-meta1 except the increased number of SNPs (1,011,748) with which its performance was to check.