O R I G I N A L A R T I C L E
Contracting outsourced services with collaborative key
performance indicators
Henk Akkermans
1| Willem van Oppen
2| Finn Wynstra
3| Chris Voss
41
Department of Management, Tilburg School of Economics and Management, Tilburg University, Tilburg, Netherlands 2
Provoque Consulting B.V., Den Haag, Netherlands
3
Department of Technology and Operations Management, Rotterdam School of Management, Erasmus University, Rotterdam, Netherlands
4
Operations Group, Warwick Business School, and Management Science and Operations, London Business School, London, UK
Correspondence
Finn Wynstra, Department of Technology and Operations Management, Rotterdam School of Management, Erasmus University, 3000 DR Rotterdam, Netherlands.
Email: [email protected]
Handling Editor: Aravind Chandrasekaran
Abstract
While service outsourcing may benefit from the application of performance-based contracts (PBCs), the implementation of such contracts is usually challenging. Service performance is often not only dependent on supplier effort but also on the behavior of the buying firm. Existing research on performance-based contracting provides very limited understanding on how this challenge may be overcome. This article describes a design science research project that develops a novel approach to buyer–supplier con-tracting, using collaborative key performance indicators (KPIs). Collaborative KPIs evaluate and reward not only the supplier contribution to customer performance but also the customer's behavior to enable this. In this way, performance-based contracting can also be applied to settings where supplier and customer activities are interdepen-dent, while traditional contracting theories suggest that output controls are not effective under such conditions. In the collaborative KPI contracting process, indicators measure both supplier and customer (buying firm) performance and promote collaboration by being defined through a collaborative process and by focusing on end-of-process indi-cators. The article discusses the original case setting of a telecommunication service provider experiencing critical problems in outsourcing IT services. The initial interven-tion implementing this contracting approach produced substantial improvements, both in performance and in the relationship between buyer and supplier. Subsequently, the approach was tested and evaluated in two other settings, resulting in a set of actionable propositions on the efficacy of collaborative KPI contracting. Our study demonstrates how defining, monitoring, and incentivizing the performance of specific processes at thebuying firmcan help alleviate the limitations of traditional performance-based con-tracting when the supplier's liability for service performance is difficult to verify.
K E Y W O R D S
collaboration, design science research, key performance indicators (KPIs), outsourcing, performance measurement, performance-based contracts, service procurement
1
|
I N T R O D U C T I O N
Empirical evidence demonstrates that achieving the in-tended performance outcomes of outsourcing is not easy
(Ellram, Tate, & Billington, 2008; Handley & Benton, 2013; Stouthuysen, Slabbinck, & Roodhooft, 2012). This applies in particular to outsourced services (Caldwell & Howard, 2011; Ellram & Tate, 2015; Hawkins, Gravier, Berkowitz, & Muir,
This is an open access article under the terms of the Creative Commons Attribution-NonCommercial-NoDerivs License, which permits use and distribution in any medium, provided the original work is properly cited, the use is non-commercial and no modifications or adaptations are made.
© 2019 The Authors.Journal of Operations Managementpublished by Wiley Periodicals, Inc. on behalf of The Association for Supply Chain Management Inc.
2015). One solution to overcome ineffective outsourcing arrangements is to adopt performance-based contracts (PBCs) (Guajardo, Cohen, Kim, & Nettesine, 2012). These contracts support collaboration by aligning incentives of suppliers and buyers (Eisenhardt, 1989; Selviaridis & Wynstra, 2015). However, implementing PBCs for outsourced services is not always feasible. Services are often coproduced by supplier and customer, making their respective activities interdepen-dent and their responsibilities difficult to separate (Chase, 1978; Narayanan, Jayaraman, Luo, & Swaminathan, 2011; Sampson & Froehle, 2006). Consequently, besides environ-mental uncertainty, the supplier also faces the behavioral uncertainty introduced by the buying firm (Nullmeier, Wynstra, & Van Raaij, 2016). This leads to a situation of double moral hazard (Bhattacharya, Gaba, & Hasija, 2013; Roels, Karmarkar, & Carr, 2010). Classical contracting theo-ries, in particular agency theory, suggest that in such uncer-tain situations, output-based contracts or PBCs are not effective (Eisenhardt, 1989; Jensen & Meckling, 1976; Mayer, Nickerson, & Owan, 2004). Roels et al. (2010) note that in collaborative services, such as information technol-ogy (IT) outsourcing, PBCs are uncommon given the chal-lenges of low incentives in joint production, the limited liability of the supplier, and reduced outcome measurability.
To address the behavioral uncertainty introduced by the buying firm, we have designed and implemented a novel type of buyer–supplier contracting, based on our field work with several organizations that were experiencing these underre-searched issues. This collaborative KPI contracting approach addresses the challenge of buyer–supplier process interdepen-dencies by accounting not only for the performance of the supplier but also for the quality of processes at the buying firm in enabling supplier performance. Performance measure-ment in such a contract relies on collaborative key perfor-mance indicators (KPIs), which encompass two main advantages. First, by defining, incentivizing, and measuring the quality of processes at both the supplier and the buyer, collaborative KPIs can resolve the predicament of implement-ing PBCs in situations of buyer–supplier interdependence. Second, the processof identifying, in detail, the operational service delivery processes at both the buyer and the supplier and how they are interdependent, and constructively engaging the stakeholders in this process, helps to create the under-standing and commitment for these KPI sets. Collaborative KPI contracting can be defined, in short, as a process for developing buyer–supplier relationship performance indica-tors that (a) promote collaboration by focusing on end-of-process indicators; (b) are ‘two-way’ by measuring both supplier performance and also customer (buying firm) perfor-mance; and (3) are defined in a collaborative process, together by the supplier and the customer (buying firm).
Various academic and management practice studies have recently proposed related yet distinct approaches. First, exten-sions of research on performance-based contracting investigate the interplay between output controls and relational gover-nance (Nullmeier et al., 2016; Selviaridis & Norrman, 2014; Stouthuysen et al., 2012) or the interaction of output and pro-cess controls (Cardinal, Kreutzer, & Miller, 2017; Handley & Gray, 2013). These studies, however, do not address how con-tracting (i.e., defining, verifying, and incentivizing) thebuying firm'sperformance can address some of the limitations of tra-ditional performance-based contracting when the supplier's lia-bility for service delivery performance is difficult to verify. A second related body of research deals with buying firms and consulting companies that conduct supplier satisfaction sur-veys assessing to what extent a supplier finds the relationship with a specific buying firm productive (e.g., Planning Perspec-tives, 2017). Two main differences, however, with collabora-tive KPI contracting are that supplier satisfaction survey scores refer to the general buyer–supplier interactions (e.g., payment behavior), regardless of the specific service or product being exchanged, and that the satisfaction scores have no impact on the financial rewards of the supplier (or penalties to the buyer). One specific management practice study has advocated the use of two-way scorecards to measure the processes “[…] for which the buyer and strategic supplier each have specific accountabilities and performance standards to achieve.” (Slobodow, Abdullah, & Babuschak, 2008). However, such scorecards are not used to determine penalty or bonus pay-ments for the supplier. Finally, the recently proposed‘Vested’ sourcing model combines performance-based contracting with a‘collaborative relationship model.’ It also emphasizes the importance of defining high-level, strategic‘desired outcomes’ and argues that buying firms should not specify in detail how the supplier is to achieve those outcomes (Vitasek, Ledyard, & Manrodt, 2013). In contrast to our collaborative KPI contract-ing approach, however,‘Vested’sourcing does not address the potential benefits of making the buying firm partly accountable for the supplier's performance (Vitasek et al., 2013, 2015).
prescriptive knowledge, linking it to interventions and sys-tems to produce outcomes, providing the key to solving field problems; a justification of research products largely based on pragmatic validity (do the actions based on this knowl-edge produce the intended outcomes?).” (Van Aken, 2004: p. 395). Another common element is the recognition that design research proceeds through a series of tests and refine-ments (Jelinek, Romme, & Boland, 2008).
Our DSR started in 2003, when the Dutch telecommunica-tions service provider KPN and its IT outsourcing partner Atos Origin (renamed Atos in 2011) were experiencing serious problems. In 2001, KPN had transferred its data centers, end-user services, and software house activities to Atos Origin, but 2 years later the performance of these services and the trust and commitment of both parties had deteriorated substantially. KPN wanted to build stronger incentives into the contract, whereas Atos Origin felt that its performance was seriously affected by how KPN managed their related processes.
Our direct and intensive engagement in this field problem helped us to understand the origins of the failure and to develop new insights regarding collaborative KPI contracting. We first describe the initial outsourcing contract, its implemen-tation, and its outcomes (2001–2003). Subsequently, we exam-ine the development, implementation, and evaluation of the collaborative KPI contract (2003–2007). More recently, we have conducted field tests of the collaborative KPI contracting approach in other situations, and we present two such evalua-tion cases in detail (in secevalua-tion 8). Figure 1 presents the overall timeline of our DSR efforts. The figure also refers to a failed case, which we briefly discuss in reviewing the transferability of the collaborative KPI contracting approach in section 9. In our DSR approach, we have looked for the simplest and most likely explanations for the set of observations we made over the years. Otherwise put, we have applied abductive reasoning, which“[…] forms and evaluates hypotheses in order to make sense of puzzling facts […]”(Fisher & Aguinis, 2017: p. 443). The collaborative KPI contracting approach is the core design artefact in our study (Holmström, Ketokivi, & Hameri, 2009). Our initial longitudinal case study also describes the analysis and implementation process that was adopted.
Although this collaborative service design process largely relies on existing tools and methods, we posit that its integration with collaborative KPIs is novel. The collaborative service design process is crucial in successfully developing and implementing the collaborative KPI contract. To be effective, the collabora-tive KPI contract should be adapted to the specific context and should be supported by different functions at both the buyer and the supplier. The collaborative service design process pro-vides a coherent approach for achieving this.
After this introduction, we review prior research on imple-menting performance-based contracting and the challenges of effectively implementing such contracts in situations where performance cannot be easily verified and attributed to the efforts of suppliers. The method section provides details on our initial, longitudinal case study and how we applied the design science approach. Subsequent sections discuss the context, interventions, outcomes, and mechanisms of this initial DSR study. We then review two more recent evaluation cases in which we conducted similar interventions. The paper concludes with a set of propositions regarding the effects of collaborative KPI contracting and the extent to which this design artefact may be transferrable and the implications for further theory development and practice.
2
|
L I T E R A T U R E R E V I E W : P B C s I N
O U T S O U R C E D S E R V I C E S
Different theories emphasize the distinct functions of con-tracts. In transaction cost economics, safeguarding, that is, minimizing opportunism and protecting investments, is the most prominent function of contracts. Safeguards and control can be implemented by assigning decision and termination rights and by defining processes for dispute resolution (Schepker, Oh, Martynov, & Poppo, 2014). In the resource-based view, contracts serve the goal of interorganizational coordination (Mellewigt, Madhok, & Weibel, 2007; Schepker et al., 2014). Contracts may include clauses defining roles and responsibilities and monitoring provisions. As such, contracts serve as a blueprint for exchange, aligning the actions of both parties (Macaulay, 1963; Vanneste & Puranam, 2010). This
[image:3.595.48.392.587.735.2]function of contracts is particularly relevant when tasks are uncertain and complex (Gulati & Singh, 1998; Mayer & Argyres, 2004). Agency theory views contracts mainly as a vehicle to align interests and incentives and to achieve risk sharing between the parties involved, particularly in case of information asymmetry between parties (Eisenhardt, 1989; Jensen & Meckling, 1976). Agency theory is the commonly used theory to study the choice between contracting on effort or behavior (process controls) or contracting on performance or outcomes (output controls) (Selviaridis & Wynstra, 2015).
Particularly in service outsourcing, contractual governance may be applied in the form of performance-based contracting (Essig, Glas, Selviaridis, & Roehrich, 2016; Guajardo et al., 2012). Performance may be measured in terms of asset or product availability or utilization or even customer satisfaction and monetary revenues (Nullmeier et al., 2016). Several stud-ies on management control find empirical evidence for the favorable effects of output monitoring on customer-supplier relations and supplier performance (Heide, Wathne, & Rokkan, 2007; Sumo, Van der Valk, Van Weele, & Bode, 2016; Tiwana & Keil, 2007). In practice, however, effectively implementing performance-based contracting is challenging (Ng & Nudurupati, 2010; Ssengooba, McPake, & Palmer, 2012). The interdependence between supplier activities and buyer activities, which is a defining characteristic of service exchanges, makes it difficult to effectively and efficiently ver-ify performance in terms of outcomes and assigns rewards and penalties based on these outcomes. Often, service suppliers are reluctant to work under such contracts, because services (in varying degrees) rely on customer inputs including actors (the customer firm or its employees), physical assets, and information (Chase, 1978; Sampson & Froehle, 2006). Sup-pliers themselves are thus not always fully in control of performance (Gruneberg, Hughes, & Ancell, 2007; Nullmeier et al., 2016; Selviaridis & Norrman, 2014). Agency theory (Eisenhardt, 1989) and other theories that study the tradeoffs between output-based and process-based controls (Ouchi, 1979) suggest that PBCs are indeed not feasible or not effec-tive under conditions of outcome uncertainty. For instance, a study by Stouthuysen et al. (2012) found that output controls have a negative effect on (perceived) supplier performance when services involve a high degree of customization and intensive interaction between the supplier and the client. As Handley and Gray (2013, p. 1543) note, Mayer et al. (2004, p. 1065) effectively summarized these challenges: “ Contract-ing for supplier liability when the buyer's actions influence the size of the liability, or the size of the liability is difficult to measure, is not readily feasible because of verification difficul-ties”. Such verification problems give rise to a moral hazard in which a supplier underprovides effort and hence quality. Selviaridis and Norrman (2014), in a study of outsourced logistics services, also find that one of the main antecedents of
outcome uncertainty is the service provider's control over input and behavior of customers. The higher the impact of other fac-tors, besides the efforts of the supplier, on the performance outcome of the service production process, the lower the attri-butability of the outcome. In-line with agency theory, Selviari-dis and Norrman (2014) posit that low outcome attributability makes service providers less willing to accept the financial risks embedded in PBCs.
of the negative effects of outcome uncertainty on supplier efforts. One of the few recent theory testing studies in this stream finds evidence that for high-volume routine services, information exchange and transparency can strengthen the already positive effects of output controls on supplier performance and, for low-volume customized professional services, can alleviate some of the negative effects of output controls on supplier perfor-mance (Stouthuysen et al., 2012). These findings support the earlier findings by Heide et al. (2007) that relational gover-nance (specifically, relational norms such as mutually agreed assessment standards) increases the positive effects of output controls in curbing supplier opportunistic behavior.
A second, more modest research stream investigating how the shortcomings of performance-based contracting may be alle-viated examines the effects of combinations of different con-tracting forms or controls (Cardinal et al., 2017; Selviaridis & Wynstra, 2015). These studies observe that practitioners com-bine output and process contracting approaches to share differ-ent types of risks across the buyer and supplier (De Jong, Bijlsma-Frankema, & Cardinal, 2014). For example, Handley and Gray (2013) investigate the complementarity in use and in effectiveness of output (or outcome) and process (or behavior) controls. In their study of quality management practices, they find support for a substitution effect between the use of the output-oriented quality controls and process-oriented quality controls. However, they also find moderate support for the com-plementary effectiveness of the output-oriented and process-oriented controls (Handley & Gray, 2013).
In contrast to both these two streams of research, our DSR study demonstrates that contracting for supplier performance in a situation of outcome uncertainty induced by buyer's actions can still be feasible and effective, as long as these buyer behaviors are verifiable and made accountable. Our lon-gitudinal perspective, unlike prior cross-sectional studies, can help to understand the process of developing collaborative KPI contracts. This approach toward performance-based con-tracting in situations of buyer–supplier interdependencies— complementing the supplier-facing outcome controls with buyer-facing outcome controls—is conceptually novel in two ways. First, we do not study the complementarities of differ-ent types of supplier-facing controls but examine the combi-nation of supplier-facing and buyer-facing controls. Second, we investigate how the process of building trust, commitment, and relational norms can help suppliers and buying organiza-tions to create the willingness and transparency to identify the processes at both ends that affect the final service perfor-mance. In other words, relational governance may pave the way to develop meaningful performance-based contracting, including both supplier-facing outcome controls and buying-firm-facing outcome controls. Thus, we do not just investigate how outcome controls can still work under situations of outcome uncertainty (and initially, limited performance attributability)
but also how the means to achieve this (collaborate KPI con-tracting, including buying-firm facing outcome controls) can be defined and implemented through relational governance mechanisms. In sum relational governance does not simply compensate for the inadequacies of PBCs but functions as a
meansto develop and implement this specific form, that is, collaborative KPI contracting.
3
|
M E T H O D
3.1
|
A DSR approach
Our DSR process can be described in terms of the four phases proposed in Holmström et al., (2009). Phases 1 and 2 are exploratory and design science-oriented, and Phases 3 and 4 are explanatory and theory building-oriented. This study encompasses the first three phases. The first phase is labeled‘solution incubation,’ “[…] which consists in fram-ing the problem and developfram-ing the rudiments of a potential solution design.”(Holmström et al., 2009: p. 72). In the sec-ond phase, ‘solution refinement,’ the rudimentary solution design is subjected to empirical testing. The first and second phase are conducted within our initial case study, after which the second phase is reiterated in other contexts to vali-date that our design artefact“[…] can be transferred (within a certain application domain) to contexts other than the ones in which it has been made and tested without losing its basic effectiveness.”(Van Aken et al., 2016: p. 5). DSR and case research approaches are complementary (Kaipia et al., 2017). In DSR, the researcher is actively engaged in the field problem, while in case research, the researcher is an observer. In the third phase of‘explanation,’ the relevance of the solution design is established in the form of“ Substan-tive theory [….] that is developed for a narrowly defined context and empirical application […]” (Holmström et al., 2009: p.75). Here, one reviews the field tested design in the context of previous research and the related propositions from a theoretical perspective. Within the scope of the cur-rent article, we cannot fully engage in Holmström's Phase 4 as it requires the development of a complete, formal the-ory, but we do report on the implementation and results of the design artefact (intervention) in multiple contexts, sup-porting the examination of the transferability of our solution.
3.2
|
Research design
the same class is solved, each by applying the problem solv-ing cycle. Design knowledge is built up through the reflec-tive cycle (…): choosing a case, planning and implementing interventions (on the basis of the problem solving cycle), reflecting on the results and developing design knowledge to be tested and refined in subsequent cases.” (Van Aken, 2004; p. 229). From our original design case and the two subsequent evaluation cases, we gained insights into when our design artefact of the collaborative KPI contracting approach works or works best. Finally, we formulate our technological rules or actionable propositions in the context of the CIMO logic for design research (Denyer, Tranfield, & Van Aken, 2008):“IF Context contains contextual factor C1, C2,…Cn, THEN apply Intervention I1..In to invoke mecha-nisms M1..Mn that generate desired outcomes O1..On.”
As noted earlier, the case in which the initial solution incubation and refinement took place is set in the telecom-munications industry in the Netherlands in the period 2001–2007. It involves telco operator KPN and IT services company Atos Origin (Atos). In 2001, Atos acquired IT infrastructure, including data centers, from KPN and subse-quently managed the related service delivery processes. In 2003, however, the outsourcing relationship turned out to be ineffective, and this is when our design science study started. While the implementation of collaborative KPI is, in princi-ple, not limited to IT services, many IT outsourcing arrange-ments involve highly interdependent service processes, which makes this case a relevant context in which to develop our design (Barthelemy, 2001; Bhattacharya et al., 2013; Weeks & Feeney, 2008).
In our four-person research team, two of the authors were directly involved in developing and implementing the initial intervention (Phase 1 and 2). The second author, a practitioner, was recruited as a chief procurement officer (CPO) at KPN in the fall of 2003. The first author, an academic and part-time consultant, had already worked with the second author in vari-ous consultancy projects on system dynamics modeling. The successive interventions at other organizations were also con-ducted by the first two authors, while the practitioner had now changed to the role of consultant/interim manager. The third and the fourth author, both academics, collaborated with the first two authors in analyzing the effects of the initial interven-tion and in extracting the theoretical implicainterven-tions from the field tested design artefact (Phase 3).
The structure of the subsequent sections on the initial design case follows the CIMO logic for design research (Denyer et al., 2008). First, we describe the initial case context (C) including the surrounding external and internal environment factors. Then, we introduce the intervention (I) that was designed and implemented. While the CIMO approach obviously suggests that mechanisms precede outcomes, we subsequently first dis-cuss the outcomes (O) of our interventions in the KPN-Atos
case, as we can analyze the mechanisms (M) more precisely after we have reviewed the outcomes.
4
|
C O N T E X T : T H E F I E L D
P R O B L E M O F T H E K P N - A T O S
O U T S O U R C I N G R E L A T I O N S H I P
4.1
|
Prologue
In the late 1990s, deregulation of the telecom market together with the advent of new (mobile) communication technologies and the associated investments in licenses and assets put sub-stantial pressure on the competitive position of KPN, the previously state-owned telecommunications provider in the Netherlands (CNN, 2000). By the end of 2000, KPN started to consider the possibility of divesting or outsourcing some in-house activities that were no longer crucial to its business strategy, such as its IT activities. These activities were human resource intensive, required considerable management atten-tion, and the general consensus within KPN was that outsour-cing would improve quality. Also, KPN needed cash to pay off its major loans. In the fall of 2001, KPN initiated a turnaround process, focusing on cutting costs and divesting nonprofitable and nonessential assets and using the proceeds to reduce its massive debts. Over a period of 18 months, KPN's data center, its end-user services, and software house were outsourced to Atos, involving some 2,300 employees. Atos was awarded a revenue-guarantee contract (i.e., a take-or-pay contract, where a customer pays a penalty for any items that it orders less than contractually agreed), allowing it to recoup its dedicated invest-ments. The main objectives of this outsourcing deal for KPN were short term:“Assets out, cost out, and cash in.”Therefore, KPN's main criteria in selecting an outsourcing partner were financial attractiveness of the bid (for the assets), the ability to take over personnel professionally, and the ability to provide continuity of services and subsequent cost reductions. For Atos, the main objectives for this deal were making a serious entry into the telecommunications industry and entering the Dutch and German market, where KPN had a subsidiary. In 2001, the Atos–KPN deal was one of the largest IT outsourcing deals in Europe, adding some 20% to the revenues of Atos in managed IT services (Atos Origin, 2001). However, in the fall of 2003, almost two years into the contract, the relationship between KPN and Atos had deteriorated, with low performance and reduced trust and commitment at all levels of the relationship.
Toward the end of 2003, the service outsourcing relation of Atos and KPN could be summarized by the following five contextual factors:
Atos' performance was directly affected by shortcomings in KPN's behavior toward its IT service provider.
• C2: The supply network of service processes as well as the IT landscape were complex. Understanding the over-all system and its leverage points was practicover-ally impossi-ble for one person or even one department.
• C3: The financially driven contract design with its reve-nue guarantee and cost drive led to misaligned incentives within both parties and certainly also between them.
• C4: These three factors contributed to a ‘burning plat-form’ of unacceptably low operational performance toward KPN's end customers.
• C5: All these factors resulted in an all-time low relation-ship quality on both sides, with much distrust, intranspar-ency, and opportunistic behavior, which hurt performance even further.
4.2
|
Contextual factor C1
—
Coproduction of
services directly affecting customer's business
After outsourcing, Atos managed more than 40 critical IT systems that each directly affected KPN's performance toward its customers. If one of these systems failed, the ser-vice itself could fail, that is, a call center agent could not access customer information or customer order changes could not be processed. Moreover, all these systems were interconnected, so breakdowns could easily (and often did) propagate throughout the IT system network, triggering major service disruptions. Appendix A provides more details on how closely Atos and KPN processes were intertwined in coproducing services to KPN customers.
4.3
|
Contextual factor C2
—
Complex
operational service process network
The network of IT systems and service processes that deliv-ered services to KPN customers was very complex. The IT landscape was a patchwork of partly outsourced, partly still KPN internal IT systems: often legacy systems, with some 1,700 point-to-point interfaces between them, which had to be maintained and monitored continuously. Also, the manage-ment of this network was very fragmanage-mented and complex and not very effective. For example, at KPN, server SLAs were managed by at least four or five KPN managers, each involved solely from their own functional perspective. On the supplier side, Atos managers controlled only parts of the system land-scape. Communication among all these individuals was mainly by e-mail. Most operational managers were barely acquainted with one another and did not understand their process interde-pendencies. During the interventions, KPN employees would introduce themselves not just to Atos staff but also to each other. The same was true for Atos employees. So the key
people involved on a day-to-day basis only knew each other's email addresses and had never met before in real life. Higher up, at middle and certainly higher management levels, there was very limited knowledge of shop floor processes and inter-dependencies between processes and systems. As a result, their complexity was daunting to most.
4.4
|
Contextual factor C3
—
Financially
driven contract leading to misaligned incentives
The contract design, with its revenue guarantees and no explicit incentives for innovation, led to misaligned incen-tives in multiple ways. The contract drawn up in 2001 stipu-lated for each year of the 2002–2007 period, a guaranteed revenue for Atos. In case of a shortfall, KPN would pay a penalty equal to 25% of the shortfall in each of the first three years and 50% of the shortfall in each of the latter three years. Over 2002, KPN already had to pay a penalty of sev-eral million Euro. KPN was able to mitigate that penalty by offering Atos revenue with respect to alternative projects.
Within KPN, departments focused on very different KPIs, some focusing on costs, others on revenue and response times. The lack of management at the strategic level resulted in misa-ligned incentives and lack of transparency. In turn, this led to complacency and lack of innovative solutions. KPN continued to procure services from Atos just to avoid paying penalties. Internally, both companies were internally still quite stove-piped, with departments focusing on very different KPIs. KPN business units focused on customer response times, while the purchasing department focused on acquisition price. Typically, Atos managed its service lines on costs, but the account teams were managed on revenue and therefore more focused on new business than on solving issues in existing relations. As a con-sequence, internal transparency and collaboration on both sides was quite limited.
During the outsourcing, there had been a clear alignment of goals between Atos and KPN. However, this alignment deteriorated fast. Already during the outsourcing implemen-tation in 2001–2002, the internet bubble burst and the tele-com business declined fast. This meant that the value of KPN's assets to Atos, as a springboard into the telecom mar-ket, was seriously reduced. Atos therefore became more dependent on the returns from the outsourcing deal with KPN, rather than on additional external revenue growth. As a result, KPN's increasing emphasis on cost reduction con-flicted with Atos' revenue aspirations.
Additionally, the partnering vision implicit in the original outsourcing arrangement was ‘lost in translation’ when the specifics of the service-level agreements were worked out, resulting in conventional adversarial buyer–supplier role def-initions. In senior management contacts, both sides kept their‘cards close to their chest’and acted under an assump-tion of zero-sum-gaming. Gradually, the partner board, which was the regular meeting of senior management on both sides, became a meeting of adversaries, not of partners. The relationship—involving a contract that was worth hun-dreds of millions of euros annually—was not managed by KPN at a strategic level but by two procurement managers.
4.5
|
Contextual factor C4
—
Burning platform
of low operational performance and financial
losses
By the end of 2003, operational performance had become so poor that it acted as a ‘burning platform’ to motivate both companies to seek urgent action. Performance was at an all-time low. For instance, in KPN's basic telephone (i.e., landline) services, there were an extremely high percentage of 15% customer complaints after something as basic as moving house or changing the type of subscription. At the call center, customer queries—the bulk of which were standard and straightforward—were resolved in only 82% of the cases, while the first time right (FTR) norm was 95%. This dismal performance was reinforced by misalignment at the tactical level through large sets of purely technical and fragmented KPIs, rather than through a small and coherent set of intercon-nected process KPIs. In 2003 alone, there were over 20 escala-tions of operational issues as resolving performance issues at the operational level became more problematic. Meanwhile, KPN continued to procure services from Atos—even when the relevance of their expertise was in doubt—just to avoid paying penalties from the outsourcing agreement. Obviously, this poor performance costs extra manpower on both sides.
4.6
|
Contextual factor C5
—
Low relationship
quality: Mistrust on both sides
In 2003, KPN's internal client satisfaction with Atos, which can be seen as a proxy of trust in this context, was 3.9 on a 10-point scale. In the light of this, it is not surprising that in that year over a hundred new IT projects were started with other IT suppliers, while the original plan was that Atos would be the sole IT services supplier. KPN had seriously considered replacing Atos as its outsourcing partner but ulti-mately there was no feasible alternative. KPN's cost-down drive was in direct conflict with the revenue guarantees that had been given to Atos in the original outsourcing deal. These guarantees led to complacency, which triggered
irritation at KPN. Meanwhile, KPN's IT demand manage-ment competencies had effectively been outsourced to Atos, and Atos did not introduce innovative solutions to avoid risky and costly investments. Internally in KPN there were also tensions. KPN top management had originally viewed outsourcing mainly as a financial instrument to generate cash to payoff the huge debts. The outsourcing deals had mostly been a corporate affair, while KPN's business units had to put up with the costs and the unsatisfactory performance of this outsourcing relationship.
5
|
DESIGNING AND IMPLEMENTING
THE INTERVENTION
5.1
|
Solution incubation: Framing a potential
design for the application domain
The CPO turned to the first author for help in bringing about this change, building on his work in developing models of operations strategy issues with groups of man-agers, mostly in manufacturing industries. His method that focused on group-modeling building processes (Vennix, 1996) was aimed at creating greater transparency and trust between stakeholders from different companies, by jointly mapping out‘the whole elephant’(Senge, 1990) and by cre-ating room to‘unfreeze’the buyer–supplier setting (Lewin, 1951). From there on, parties can jointly develop a new mode of organizing and governance. In summary, the two authors together had the makings of what was a promising potential design (Holmström et al., 2009). Also, the techno-logical rules in their professional repertoire suggested that the application domain as described above was a challenging one (Van Aken, 2004). The collaborative KPI contracting approach consisted of two major elements:
• I1. The suite of process interventions used to develop the collaborative KPIs.
• I2. The collaborative KPI contracting the method itself.
5.2
|
Intervention I1
—
Process interventions to
develop collaborative KPIs
None of the process interventions are new in themselves. The novelty arises from the collaborative KPI contracting approach that they are used for and integrated with.
5.2.1
|
Reframing the relationship from
adversarial to partnership
The relationship was adversarial and zero-sum minded, also at top management. To have a fair chance of success, the relation-ship at the top management level had to be reframed into a stra-tegic partnership, with significant relation-specific investments on both sides. This redefinition was not an easy task. Of course, there was the burning platform of the dramatic opera-tional performance. Still, it took a veiled threat to the Atos CEO to get a go-ahead from the supplier side. At one of the partner board meetings, the KPN CFO, to whom the CPO reported, made it clear that if Atos would not go along with this new drive, KPN would publicly announce its dissatisfaction and its intention to move to alternative suppliers. This threat was effective. The much disliked revenue guarantees were removed from the contract, and both parties formally agreed to redefine the outsourcing relationship into a partnership mode.
5.2.2
|
The pot of gold
In a way, the revenue guarantees became very helpful to incentivize both parties to behave as partners. The net
present value of the possible cumulative penalty payments by KPN to Atos under the previous revenue guarantee con-tract was calculated. This sum was put in a dedicated reserve; a ‘pot of gold’ as it was called at the time. The bonuses under the collaborative KPI contract could be paid out of this account in the years to come. If Atos met its per-formance targets, the company would have‘drawing rights’ for payments from this ‘pot of gold.’ For KPN, failure to meet its performance targets would result in financial penal-ties, that is, additional drawing rights for Atos. The actual payments of the drawing rights, or bonuses, had to be funded by the specific functions or business units that did not comply with the KPIs and would directly impact their operating budgets. Both the potential penalties and drawing rights were substantial; the potential KPN penalties amounted to a maximum of €15 million, and the potential bonus for Atos was€18 million, for the 2004–2007 period. We discuss this in further detail below.
5.2.3
|
Interviews and group meetings on both
sides
The first two authors took the lead, starting with a round of interviews at all levels of the KPN organization in the third quarter of 2003. The insights gained from these interviews led to a series of meetings with both parties, in a confidential setting, to assess and recalibrate strategic commitment and alignment between both parties. Both parties agreed to code-sign the new way of working by detailing out operational processes and performance targets in one business area (standard fixed-line telephony).
5.2.4
|
Root cause analysis workshop
The foundation for this new strategic partnership was laid in a 2.5 day off-site session of some twenty executives from both parties. A key technique applied in this root cause anal-ysis workshop was group model-building (Vennix, 1996), in which the entire group went through a causal loop diagram-ming session, identifying interdependencies and causal linkages between end customer performance and actions throughout the service supply chain (see Appendix A). The session aimed at exploring the question: “What happens when something goes wrong in the operations?”This made it clear how actions from the IT supplier directly and indi-rectly affected KPN customer satisfaction.
agreements (SLAs) as they were called in this IT context. There were thousands of these SLAs, all defined at a very specific technical level. For example, if a server was per-forming according to its SLA, Atos could not be penalized, even if complaint levels were high (as a result of broader quality issues).
5.3
|
Intervention I2
—
The collaborative KPI
contracting method itself
Following this initial workshop, a series of further workshops were organized to specify the KPIs, the sub-KPIs, the measurement process, normalization, and the determination of the relevant data sources in detail. An important outcome was a true and detailed understanding that delivering the service involved coproduction by both parties. Therefore, the required KPIs had to be collabora-tive in three distinct ways. First, they had to register to what extent Atos supported KPN's business goal. The aim was that Atos should measurably contribute to improving KPN's business performance by enhancing end-customer satisfaction and reducing complaint levels in KPN's fixed-telephone business. Second, the KPIs also had to support the supplier. If Atos was to perform well, it needed KPN's collaboration as well. Therefore, KPIs were needed not just for the supplier but also for the customer: in other words, two-way performance targets. Third, the KPIs had to be codeveloped together, in a collaborative process, to gain support from both parties. Without our intervention-oriented DSR approach, these insights would have been much less likely to emerge.
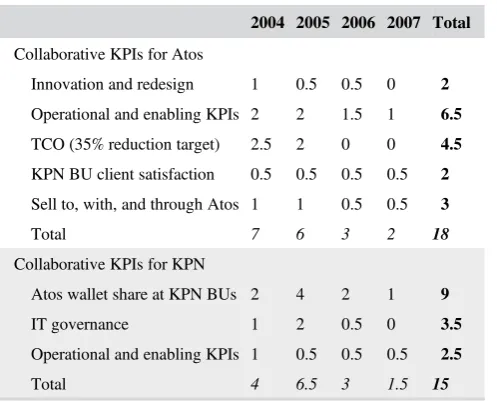
Both parties agreed that operational and enabling KPIs were required for both Atos and KPN. Four top-level KPIs were developed for Atos and two for KPN. Table 1 presents the top-level KPIs, and the corresponding maximum bonuses (for good performance by Atos) and penalties (for bad per-formance by KPN). Details of these KPIs and their targets are explained in Appendix B. Each top-level KPI was an aggregate of supporting KPIs, structured as a KPI tree. Atos and KPN's‘operational and enabling KPIs’were defined as the core of the collaborative KPI contracting approach. The operational and enabling KPIs were considered collaborative in the sense that KPN could actively contribute to Atos delivering better performance. The development of these KPIs took about 2 months.
Both parties recognized that the complex collaborative KPI structure would require significant work to sustain it, as well as an organization that could deal with any future issues. As a result, a joint collaborative KPI office was set up to manage and monitor the main KPIs and their support-ive KPI trees. Its mission was to facilitate and provide assur-ance in monitoring the KPIs to develop a full-fledged
business partnership between KPN and Atos. This office involved both parties. At KPN, it was part of the corporate purchasing department, and at Atos, it was part of the KPN customer unit.
6
|
O U T C O M E S O F T H E
I N T E R V E N T I O N S
We now describe the four main closely interrelated out-comes of the two interventions.
6.1
|
Outcome O1
—
Transparency of process
performance and its drivers
Operationally, KPN and Atos started to work as a team to measure performance and to continually improve it, under a policy of maximum transparency. The collaborative KPIs offered clear alignment opportunities to do so. At the tacti-cal level, innovative Atos ideas aimed at simplification and rationalization of IT architecture, and processes were implemented as the focus of the relationship moved from a
‘cost-down’ drive to a ‘quality and collaboration’ move-ment. At the strategic level, there was also more transpar-ency under the collaborative KPI contract. Both parties received regular updates of strategic issues at the now well-functioning partner board. As targeted by the‘sell to, with, and through each other’ KPI, both parties started addressing corporate customers with joint business propo-sitions, with KPN addressing telecom needs and Atos other IT needs, and this led to several successes. KPN did not quite have its IT governance in order, which was detri-mental to Atos's project planning and operations, but these issues were now discussed at partner board level. This
T A B L E 1 Maximum bonus and penalty payments 2004–2007 (in€million)
2004 2005 2006 2007 Total
Collaborative KPIs for Atos
Innovation and redesign 1 0.5 0.5 0 2
Operational and enabling KPIs 2 2 1.5 1 6.5
TCO (35% reduction target) 2.5 2 0 0 4.5
KPN BU client satisfaction 0.5 0.5 0.5 0.5 2
Sell to, with, and through Atos 1 1 0.5 0.5 3
Total 7 6 3 2 18
Collaborative KPIs for KPN
Atos wallet share at KPN BUs 2 4 2 1 9
IT governance 1 2 0.5 0 3.5
Operational and enabling KPIs 1 0.5 0.5 0.5 2.5
[image:10.595.306.555.532.733.2]also resulted in significant penalty payments from KPN to Atos.
6.2
|
Outcome O2
—
Performance
transparency improves decision-making
In their case study of the design of an interorganizational planning process in a high-tech electronics supply chain, Akkermans, Bogerd, and Van Doremalen (2004) identified strong interrelations between transparency and trust between the partners and the performance achieved. The KPN‑Atos case echoes this. A strong relation was observed between the transparency achieved through better communication and the resulting quality of the decision-making. Better decisions led to better performance, leading to more trust, leading to even more transparency, and so on. The workshops were
needed to kick-start this virtuous cycle. They provided the
‘travail,’ the joint hard work that led to the first gains in transparency and trust (Akkermans et al., 2004).
6.3
|
Outcome O3
—
Improved operational
performance
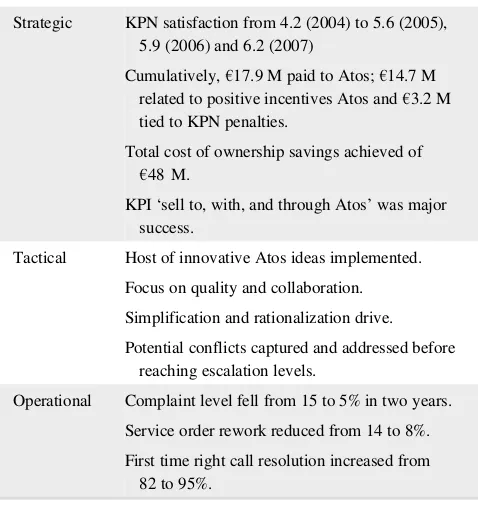
The performance outcomes of the interventions are shown in Table 2. At the operational level, the percentage of rework decreased from 14 to around 8% within five months after finalizing the intervention process (see Figure 2). Customer complaints fell from 15 to 5% over the first two years. FTR call resolution rose from 82 to 95%. Also, significant total cost of ownership savings were achieved. Financially, this resulted in Atos receiving almost €17.9 million in the 2004–2007 period. This included€14.7 million due to Atos's improved performance but also€3.2 million due to penalties incurred by KPN.
6.4
|
Outcome O4
—
Improved relationship
quality
The joint ‘Collaborative KPI Office’ worked effectively in reducing the complaint level. This collaboration also fostered trust at the operational level. An ‘Atos unless’ policy was implemented and was effective, fostering Atos trust in KPN. At the strategic level, the renegotiated con-tract signified collaboration and partnership, which was radically different from the old contract that encouraged cost, antagonistic behavior, and control. The development of the KPN client satisfaction scores, based on a survey of client satisfaction in the KPN BUs, clearly illustrates this (see Table 2). At the end of 2003, client satisfaction had hit an all-time low of 3.9. Subsequently, client satisfaction rose from 4.2 in 2004 to 6.2 in 2007. This meant a bonus for Atos of €0.4 million in 2007 against a maximum of
€0.5 million. As a KPN senior executive stated in 2007:
T A B L E 2 Performance outcomes
Strategic KPN satisfaction from 4.2 (2004) to 5.6 (2005), 5.9 (2006) and 6.2 (2007)
Cumulatively,€17.9 M paid to Atos;€14.7 M related to positive incentives Atos and€3.2 M tied to KPN penalties.
Total cost of ownership savings achieved of
€48 M.
KPI‘sell to, with, and through Atos’was major success.
Tactical Host of innovative Atos ideas implemented.
Focus on quality and collaboration.
Simplification and rationalization drive.
Potential conflicts captured and addressed before reaching escalation levels.
Operational Complaint level fell from 15 to 5% in two years.
Service order rework reduced from 14 to 8%.
First time right call resolution increased from 82 to 95%.
[image:11.595.47.286.61.314.2] [image:11.595.52.547.565.702.2]“The collaborative KPIs were instrumental in building trust for the cooperation between KPN and Atos in an innovative business area where both parties could benefit only if they were will-ing to invest and change their mode of opera-tions. The success was safeguarded by setting attainable goals with a healthy balance in ambi-tion and practical measurement of progress. The workforce at both Atos and KPN was empowered at operational management level to drive the col-laborative KPIs. Not boardroom deal-making, but a better understanding of each other's pro-cesses, creating value together.” (Director of IT Operations KPN, 2004–2007)
Also Atos management was very positive about the process and outcomes:
“The collaborative KPIs have been the lever for Atos Origin to change its behavior towards its customers. It has opened our vision towards a more customer-focused attitude. It has regained trust in cooperation between KPN and Atos in conjunction with innovations to the benefit of both parties. Finally, success was safeguarded by mutual incentives for both Customer and vendor.” (Executive Vice President Managed Operations, Atos Origin)
7
|
T H E M E C H A N I S M S
Our analysis is that the following four mechanisms collec-tively explain the successful turnaround in this service out-sourcing contract:
• M1: Stakeholders on both sides showed a genuine will-ingness to engage in a novel and high-risk process.
• M2: At the operational level, systemic thinking and modeling facilitated integral process understanding.
• M3: The collaborative design process fostered consensus and commitment on both sides.
• M4: Incentives were aligned through well-chosen collab-orative KPIs.
These four mechanisms together led to a reversal of a vicious cycle of lower trust, transparency, and performance into a virtuous cycle of more transparency leading to more trust and to better performance (Autry & Golicic, 2010).
7.1
|
Mechanism M1
—
Willingness to engage
in open dialogue to
‘
unfreeze
’
Both Atos and KPN had a lot to lose when they engaged in the collaborative design process. However, it was clear that this was not time to get stuck in organizational inertia (Hannan & Freeman, 1984). As long ago as Lewin (1951), it is known that successful organizational change requires a willingness to ‘unfreeze.’ The burning platform of the per-formance problems was an essential requirement to start the change process in the first place. Given our experiences in the later field tests, we believe that the senior management role of the second author helped but having a CPO act as pri-mary change agent does not seem an essential requirement.
7.2
|
Mechanism M2
—
Systemic end-to-end
modeling leads to integral understanding
Systems thinking has long been identified as one of the five disciplines that together constitute the learning organization (Senge, 1990). This is just as true in interorganizational con-texts (e.g, Vennix, 1996). In complex interorganizational processes, nobody sees much more than just a small part of the whole network. Once the collective insight emerges that the way of working so far is simply not effective, in this case from the group modeling process, many people will be will-ing to change their behavior. When ‘the whole elephant’ becomes visible, design flaws become more visible as well.
As a result of the group model building process, opera-tions managers from both KPN and Atos recognized not only what went wrong but also why things went wrong. More importantly, they saw how they could cooperate and address the identified problems. At the beginning of the root cause analysis workshop, a slightly hostile‘us against them’ atmosphere could still be felt. However, managers who at the beginning of the session were at arm's length later could be found in the bar well beyond bedtime, dis-cussing ways to enhance the service delivery process. This enthusiasm led the participants to reach across company borders. The clear joint objective helped operations man-agers to embrace the business aim of the process: reducing complaint levels that directly affected KPN customer satisfaction.
7.3
|
Mechanism M3
—
the collaborative design
process fosters consensus and commitment
Both parties were equal in this design process. They were equal because they were both essential to solving the joint problems and because they both contributed crucial knowl-edge. The service (re)design process reflected this inherent equality and mutual respect. This led to high perceived‘ proce-dural justice’ (Rawls, 1971) for the collaborative KPIs and thereby also to consensus and commitment to achieve them.
7.4
|
Mechanism M4
—
Align incentives
through well-chosen collaborative KPIs
PBCs can have positive effects but not under all conditions. As discussed in the literature review, if output is uncertain due to influence beyond the control of the supplier, implementing PBCs may be very costly as the supplier will demand a very high cost-of-risk premium, or it may not be feasible at all if the supplier is not willing to take the risk. Partly, this uncer-tainty is dependent on the behavior of the buying firm. For instance, does the buyer provide sufficient and timely informa-tion to the supplier, so the latter can plan its producinforma-tion activi-ties optimally? Does the buying firm sufficiently collaborate in the actual execution of activities, for instance, by providing the supplier with timely access to malfunctioning equipment on its premises, which the supplier needs to repair? As suggested earlier, the essentially coproductive or interdependent nature of services only exacerbates this problem. Efforts to imple-ment performance-based contracting, particularly in the con-text of complex and interdependent B2B services, should focus on addressing the role and impact of customer-induced uncertainty. So, how can this source of uncertainty be reduced, or at least accounted for, so that PBCs can also be implemen-ted in these situations?
We argue that collaborative KPIs are an effective solution to this problem. As discussed, in this case, four top-level KPIs were established for Atos and two for KPN. The total amount of bonuses available over the period 2004–2007 was 33€ mil-lion; 18€ million was tied to the performance of Atos, and 15€million to the performance of KPN (Table 1). The fact that KPIs were used to assess also KPN's performance, and that this was included in the calculation of penalties and rewards, is the most explicit way of addressing the interdepen-dent nature of the service operations and exchange process, making a PBC effective even in such a situation of (buyer-induced) outcome uncertainty. Tying salient financial conse-quences to performance levels on KPIs and enforcing the actual payment of bonuses and penalties helps focus manage-ment attention. When a CIO has to pay€0.5 million to an IT vendor because his own IT governance has not been working properly, leading to late information to that vendor, the sup-plier's interests will be better safeguarded in the future.
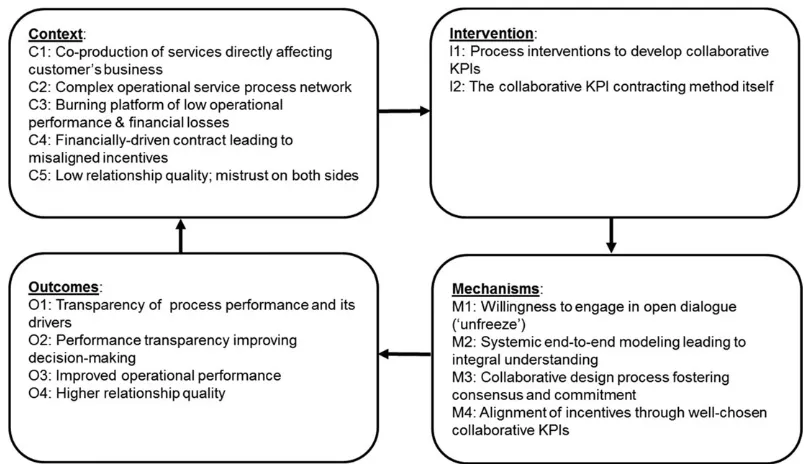
In our analysis of the case, we have thus identified five contextual variables that triggered the search for a solution to the severe problems in the relationship between KPN and Atos. We evaluated the implementation of the two interven-tions in terms of four performance outcomes and identified four mechanisms that explain how the design artefact led to these outcomes. Our complete CIMO framework is pre-sented in Figure 3. Similar representations have placed the mechanisms before the interventions to depict the sequence of designing an intervention (cf. Groop, Ketokivi, Gupta, & Holmström, 2017). We choose to present the elements in the C-I-M-O order, as we intend to represent for any given inter-vention the sequence of context affecting the applicability and details of the interventions, which trigger mechanisms that subsequently lead to outcomes.
8
|
D E S I G N E V A L U A T I O N I N
O T H E R C O N T E X T S
In the decade following the initial design of the collaborative KPI contracting approach, the first two authors have applied several similar interventions. The choice of these intervention cases was not ‘a priori’ theory driven. In DSR studies, the selection of cases is highly dependent on the availability of case study organizations. Designing and implementing the col-laborative KPI contracting approach requires considerable investments in time and effort by the buying firm and the sup-plier involved. These organizations also need to be willing to let researchers document and share the process and outcomes.
Here, we present two of these interventions as evalua-tion cases, which can deliver relevant insights regarding
characteristics. They are also set relatively recently; in 2011–2012 and 2015, respectively.
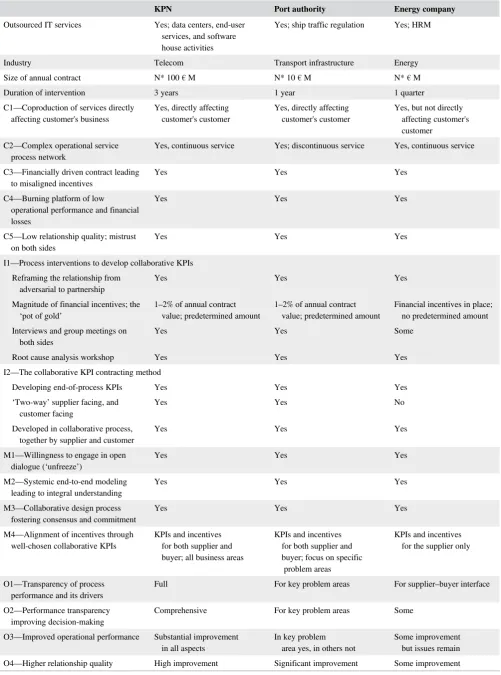
Finally, compared to the initial design case, the two cases represent variations in two of the contextual factors, which make them even more interesting as evaluation cases. In the first evaluation case, outsourced IT services for a port author-ity, the operational service network is not only complex, but the specific service process we focus on—incident manage-ment in ship traffic regulation—is also a discontinuous and variable process rather than a highly repetitive service process. This increases the complexity of the service process, as there is more variety in the incidents and the detailed service pro-cesses required and the time pressure is high (variation of C2). In the second case, outsourced IT services for an energy com-pany in the area of human resource management, the copro-duced service affects the customer's operations but not directly the customers of the customer (variation of C1). In sum, the evaluation cases are testing whether the efficacy of the collab-orative KPI contracting approach is affected by variations in two of the core contextual factors, and whether its efficacy is affected by application domain characteristics.
8.1
|
Evaluation case 1: Outsourced IT
services for a port authority
This case concerns an IT outsourcing relationship between a European port authority and a mid-sized European IT service provider. This relationship started in 2007 with the outsour-cing of the port authority's maritime IT system and related processes, which are enabling port officials (in the port con-trol room but also on the water) to manage the flow of inbound and outbound traffic including enforcing regulatory
requirements. Ship pilots would also rely on these systems for navigation, and failure in the performance of these systems would at best lead to serious delays and at worst to dangerous incidents. The most critical part of these services involves incident management: mobilization, incident resolution, incident knowledge management, incident prevention, and inci-dent mitigation. The joint work processes of the port authority and the vendor in incident management, as described in detail below, were closely interdependent (C1) and, also given the variety in possible incident situations, quite complex (C2).
In 2011, four years into the outsourcing relationship, the relation between the two parties had substantially deteriorated. The original contract had led to misaligned incentives (C3). It had been strongly cost-driven, resulting in severely hampered investments in quality improvements, to the dismay of the port authority. Both parties blamed the other side for the pre-sent difficulties. There were no end-of-process KPIs, just monthly (internal) customer satisfaction measurements. Oper-ational performance was poor, and several dangerous and frustrating incidents had occurred. Satisfaction with the off-site, outsourced customer helpdesk was very low. Thus, there was clearly a burning platform for change (C4), related to low relationship quality with mistrust on both sides (C5). Contract renewal would be up in the following year, and it was clear that major changes were needed, urgently.
This setting made both parties motivated to engage in a full intervention process, as in the KPN-Atos case (M1). In the first months of 2012, systemic end-to-end modeling took place to obtain integral understanding of the processes involved (M2). After a round of interviews, a collaborative diagnostics workshop was conducted, which generated quite some enthu-siasm from the 20-odd participants. A group model building
[image:14.595.94.497.47.279.2]session generated a causal loop diagram that showed close interdependencies as well as leverage points for performance improvements. The subsequent improvement task was split up into four teams, corresponding to the incident management processes mentioned earlier. Each team was staffed with repre-sentatives from both companies and made responsible for identifying the KPIs, redesigning work processes, and ulti-mately for improving performance. This integral collaborative service redesign effort took almost one full year.
The initial collaborative diagnostics workshop was important in identifying the process interdependencies in mobilization and incident resolution but also key in creating the commitment at operational and middle management levels to push through the service redesign effort. The subse-quent scope focused on operational performance improve-ments, working simultaneously to redefine the working relationship into a partnership mode (M3). The penultimate steering committee meeting in April 2012 was fully dedi-cated to the specification of collaborative KPIs (M4). It was decided that these collaborative KPIs were to replace the tra-ditional bonus/malus arrangements. Similar to the collabora-tive KPI structure that was developed for the KPN-Atos case, different collaborative KPI‘buckets’were used: opera-tional and enabling KPIs; bi-direcopera-tional overall satisfaction KPI; and strategic collaboration. For the three buckets com-bined, the total weight of supplier-facing KPIs was 45% while customer-facing KPIs weighted for 30%. In this case, we also defined joint KPIs (25% weight); KPIs that were impossible to allocate to just one of the two parties. The respective specific KPIs are explained in more detail below. As in the KPN-Atos case, the relative size of the financial incentives was modest; around 1% of the total contract value, funded equally by both sides.
8.1.1
|
Mobilization
Within minutes after the occurrence of a serious incident regarding maritime-related IT, all the relevant actors needed to convene and engage in concerted decision-making and action. Serious incidents occurred, for example, when a cam-era at a particular important bridge, with high traffic density and a narrow passage, malfunctioned and the responsiveness of the service provider was lagging behind and no status updates were issued. Another instance involved the pro-longed malfunctioning of the dynamic harbor chart, prevent-ing most of the largest container ships berthprevent-ing at the quays, as there were no water depth information available, leading to severe constraints in harbor approaches (because water depths in this port are strongly affected by the tide). The rel-evant actors would be from both the customer and the ser-vice provider and sometimes external stakeholders. This was a process in which both service provider and client had to
collaborate seamlessly, hence the need for KPIs both for the supplier and for the buyer. The port authority was responsi-ble for the“Speed and quality of the conference call”(15% weight within the operational and enabling KPI bucket) with all the relevant parties within minutes after the incident was reported. The quality of the work done subsequently by the supplier depended heavily on the quality of this call. The supplier was responsible for “First Time Right routing” (FTR; 5% weight). This refers to the percentage of cases in which the IT service provider's call center could immediately locate the right expertise to deal with the issue at hand. The second supplier-facing KPI was “Customer satisfaction” (20% weight), referring to the satisfaction that port authority employees (within the maritime operations) have with regard to the service provider's call center.
8.1.2
|
Incident resolution
Resolving the incident typically required the efforts from both customer and supplier. Two KPIs were defined:“Number of major incidents” (5% weight) and “Turnaround resolution duration”(10% weight). Both are clearly end-of-process KPIs, the scores on which are jointly determined by the actions of both parties. It was explicitly acknowledged that, irrespective of where a major incident originated, incidents and incident resolution were a joint responsibility and therefore assessed through joint KPIs. Still, the governance structure and demar-cations of authority between both organizations, and within them, needed to be crystal clear to reduce incidents and to achieve the most effective resolution process.
The discontinuous or irregular delivery of these incident-related services was the main reason that no performance indicators related to external customers were included in the KPIs. Even though port users and health and safety authori-ties could be directly affected by (lack of) adequate incident handling, it is more challenging to consistently include per-formance or satisfaction measures for such external users.
(10% weight), would have to be deployed by both parties. At the time of our intervention, the incident prevention and miti-gation process still had to be designed in detail.
Following (and already during) the collaborative change effort, process performance became transparent to both parties (O1) and trust improved on both sides (O4). For example, the port authority IT manager explained:“Every morning, we all gather around the plan board to see what progress has been made on specific topics.” The most important outcome was improved operational performance (O3). The number of IT-related maritime incidents dropped substantially, as shown in Figure 4. The data reported there also demonstrates that, interestingly, the share of supplier-induced incidents declines over time. In addition, customer satisfaction with help desk performance, which had been very low at first, quickly reached satisfactory levels. Note, although, that these perfor-mance data span a relatively short period.
Two years later, the port authority's director of IT services reflected as follows:“We launched the KPIs in combination with a bonus/malus arrangement. The proceeds went not only to the service provider, but were also used to finance improve-ment projects. Thanks to the introduction of collaborative KPIs, the resolution time of major incidents has been reduced from 8 hours to less than 4 hours. […] Also the port authority has responsibilities in meeting certain KPIs: in major inci-dents, the authority has to assure that within 30 min the right people from the suppliers involved are gathered around the same table.”(Hmamouch, 2014; our translation).
8.2
|
Evaluation case 2: Outsourced IT
services for an energy company
In 2013, a mid-size Dutch energy company had outsourced its IT-based human resource (HR) services and salary administra-tion, and by 2015 it was experiencing deteriorating performance.
The process design was that employees and managers, in a digitally supported Do-It-Yourself (DIY) mode, would sub-mit changes in their own HR details and as well as in those of their direct reports. This included, for instance, entering details of new employees or reporting sick leaves. The DIY principle made this very much a coproduced service; to achieve a certain quality level in the HR and payroll ser-vices, the vendor was dependent on the quality and timeli-ness of the inputs provided by customer managers and employees (C1). In contrast to the KPN and port authority cases, however, the outsourced service only indirectly affected performance toward the customer's customer. Only when problems with these HR services led to staff shortages would the service ultimately affect external customers, but there were no structural indications of this.
With some 700 managers who had to update information regarding their staff and themselves, the service network was certainly complex. To complicate matters, the supplier had moved its helpdesk from the Netherlands to Southern Spain and the customer had‘thrown over the fence’a nonoptimized IT landscape toward the outsourcing partner (C2). The outsour-cing contract had been focused on cost reduction, and the call center had been moved abroad for labor cost reasons. Call cen-ter agent incentives were also mostly aimed at productivity, not at quality (C3). Many outages and mistakes led to extremely low employee satisfaction, extensive rework, and exploding costs (C4). As a result, there was low relationship quality, with mistrust on both sides, amplified by the drastic reduction in in-house HR staff who accompanied the introduction of the DIY service (C5). The central workers council, an important internal body in Dutch corporate law especially regarding labor condi-tions, demanded that something should be done.
Fortunately, the mistrust on both sides did not prevent the parties from sitting down together. There was a willingness to discuss openly how to improve performance; there was much to be gained (M1). In the problem diagnosis phase, a collabora-tive diagnostics workshop was held with representacollabora-tives from both the customer and the IT vendor. A causal loop diagram was developed with all the stakeholders involved, and a sys-temic end-to-end model of the workflow interactions related to HR IT systems was developed (M2). This identified the root causes of nonperformance. It became clear that the outsourced, nonoptimized IT landscape was creating havoc in the HR pro-cesses. The process interactions between customer staff and supplier staff contained many flaws. Customer staff that suf-fered from high workloads had to find time to submit sick-leave details in complicated IT tools, with unhelpful support from the supplier's call center in Spain, staffed with cheap labor. This led to irritation, time lost in rework, and even higher workloads on both sides. The irritations then led to higher churn at the call center, which further reduced their expertise level. This led to even more mistakes, overtime, corner cutting,
[image:16.595.45.288.517.692.2]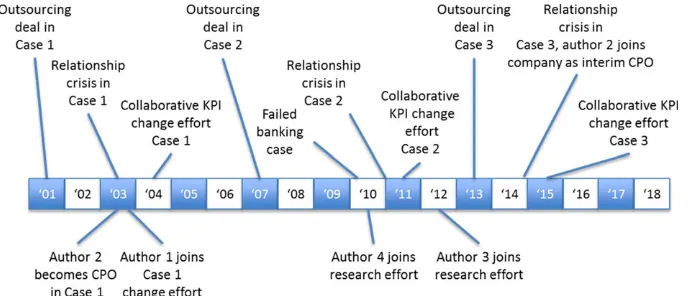
![FIGURE 4Major IT incidents per month at port authority,2012–2013 (indexed; number of incidents in January 2012 = 100)[Color figure can be viewed at wileyonlinelibrary.com]](https://thumb-us.123doks.com/thumbv2/123dok_us/9420554.444888/16.595.45.288.517.692/figure-major-incidents-authority-indexed-incidents-january-wileyonlinelibrary.webp)
![FIGURE A1A causal-loop diagram of propagation of errors in the network [Color figure can be viewed at wileyonlinelibrary.com]](https://thumb-us.123doks.com/thumbv2/123dok_us/9420554.444888/25.595.52.550.361.723/figure-causal-diagram-propagation-errors-network-color-wileyonlinelibrary.webp)
