IoT: A Diversity Aware Approach
Zhiwei Zhao,
Member, IEEE,
Geyong Min*,
Member, IEEE,
Weifeng Gao,
Student Member, IEEE,
Yulei Wu,
Member, IEEE,
Hancong Duan,
Member, IEEE,
and Qiang Ni,
Member, IEEE
Abstract—The recent advances in microelectronics and com-munications have led to the development of large-scale IoT net-works, where tremendous sensory data is generated and needs to be processed. To support real-time processing for large-scale IoT, deploying edge servers with storage and computational capability is a promising approach. In this paper, we carefully analyze the impacting factors and key challenges for edge node deployment. We then propose a novel three-phase deployment approach which considers both traffic diversity and the wireless diversity of IoT. The proposed work aims at providing real-time processing service for the IoT network and reducing the required number of edge nodes. We conducted extensive simulation experiments, the results show that compared to the existing works that overlooked the two kinds of diversities, the proposed work greatly reduces the number of edge nodes and improves the throughput between IoT and edge nodes.
Index Terms—IoT, Large-scale, Edge Computing, Deployment
I. INTRODUCTION
The recent advances in low-power wireless communica-tions and computing technologies have enabled the large-scale implementation of Internet of Things (IoT) systems [1], where massive sensors, micro-controllers and transceivers are embedded to the facilities of buildings, vehicles, wearable items and wild areas [2], [3], [4]. The IoT aims at making the Internet even more immersive and pervasive, providing interactive cyber-physical access and control services [5], [6]. Based on the IoT infrastructure, various large-scale real-time applications emerge, which makes the real-time processing a fundamental and critical service for IoT [7], [8]. For example, the smart building system [4] consists various types of IoT sensory nodes including HD cameras, wearable sensors, lo-calization anchor sensors, gym equipment sensors, etc. Those sensors need to keep collecting the sensory data continuously and provide real-time response to the upper level applications. For example, the health monitoring system needs to collect various health data from the wearable sensors from users and alarm when abnormal phenomenon is detected.
The large amount of sensory data and the corresponding real-time processing workload pose significant challenges to
Z. Zhao, W. Gao and Hancong Duan are with School of Computer Science and Engineering, University of Electronic Science and Technology of China, Chengdu, China. G. Min and Y. Wu are with University of Exeter, Exeter, UK. Q. Ni is with Lancaster University, Lancaster, UK.
G. Min is the corresponding author.
Copyright (c) 2012 IEEE. Personal use of this material is permitted. However, permission to use this material for any other purposes must be obtained from the IEEE by sending a request to [email protected].
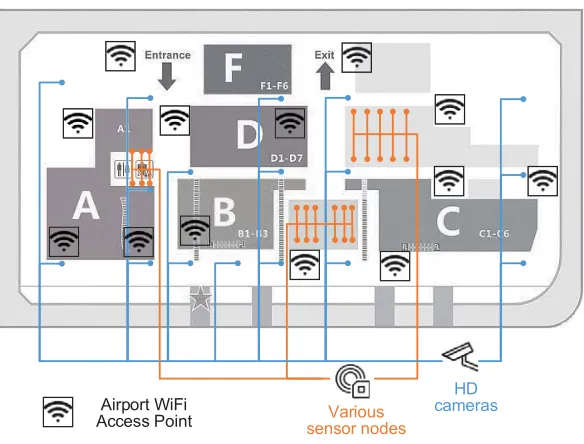
the practical application of large-scale IoT systems. Mean-while, edge computing [9] emerges as a promising solution to the above challenge as it provides instant storage and data processing services to the resource-constrained IoT nodes. Figure 1 shows the edge architecture for IoT systems. Multiple edge computing servers are deployed to cover part of the IoT nodes. The computational tasks and sensory data from the IoT nodes are sent to the edge nodes (ENs) for processing. The results are then returned to the IoT nodes or transmitted to the cloud for big data analytics [10].
Deployment of the edge nodes is a fundamental problem for the above architecture. Different from the existing works on sink deployment in multi-sink sensor networks, the de-ployment of edge nodes have several distinct challenges. First, compared to traditional sensor network nodes, IoT nodes are more diverse and have largely different traffic demands. For example, the video cameras produce much more data than the equipment maintenance sensor nodes. Second, unlike the mobile edge computing where WiFi/Cellular communications are utilized, IoT nodes often employ the low-power radios [11], [12] and are more prone to the wireless interference. Considering the edge servers are responsible for collecting data as well as disseminating data (e.g., for software update or computational feedback), the wireless interference can significantly affect the EN deployment.
To address the above challenges, we propose a deployment approach for edge servers in large-scale IoT. The proposed work has three building blocks. First, a traffic aware discretiza-tion approach is devised, which divides the whole IoT network area into a number of candidate positions. The discretization considers the traffic diversity of the IoT nodes and normalizes the demands/resources of the IoT nodes. Second, we propose a utility metric considering wireless diversity – link quality and link correlation to evaluate the candidate positions. Third, a de-ployment algorithm based on the utility metric is proposed. By incorporating both diversity information, the proposed work is expected to improve the throughput and reduce the required number of edge nodes. We conduct extensive simulation exper-iments and compare the proposed work to the existing works. The results show that our work achieves smaller number of edge nodes and greatly reduces the transmission count. The main contribution of this paper is summarized as follows.
1) We propose a discretization scheme to generate candi-date positions, where traffic diversity is considered and the demands/resources of IoT nodes are normalized. 2) We propose a novel utility metric to evaluate the
consid-Various sensor nodes
HD cameras
[image:2.612.161.453.60.282.2]Airport WiFi Access Point
Fig. 1. An illustrative example for the system model. There are various types of IoT sensor nodes and wireless access points (AP) deployed in the target area. The edge nodes needs to cover the IoT nodes and try avoiding the interference from the wireless APs.
ered.
3) Based on the above schemes, we propose a deployment algorithm which improves the IoT-Edge throughput and reduces the number of edge nodes.
The remainder of the paper is organized as follow. Section II presents the preliminaries and system model for the edge deployment problem. Section III analyzes the challenges for the problem and presents the three-phase deployment ap-proach. Section IV presents the simulation results and analysis. Section V presents the related works with edge computing and deployment in large-scale networks. Section VI concludes this paper and discusses future directions.
II. PRELIMINARIES ANDSYSTEMMODEL
Our aim is to deploy a number of edge nodes to a large-scale IoT network, where diverse IoT sensor nodes are in an area possibly with pedestrians and wireless interference. Figure 1 shows a typical IoT network in an airport, which consists a number of HD camera sensors with high traffic demands and a number of ordinary sensors with low traffic demands. The ordinary sensors are used for building monitoring, indoor navigation, equipment monitoring, etc. Although those IoT sensor nodes generates large amount of data, they usually have very limited computational resources for real-time data processing [7]. To support real-time data processing for the large-scale IoT network, a promising alternative is to deploy a number of edge nodes hierarchically with the IoT network, which are connected to the IoT nodes and processes the IoT data in real time. All IoT nodes then send the sensory data to the connected edge servers for data processing.
Compared to the traditional large-scale sensor network, the large-scale IoT network has two main differences.
1) First, the IoT networks are heterogeneous rather than homogeneous, which consists much more diverse IoT
nodes. For example shown in the figure, the camera sensors and equipment sensors have largely different demands on data traffic and data processing.
2) Second, the IoT networks are often deployed in indoor environments rather than unmanned areas. Consider-ing WiFi has been pervasively deployed for wireless access, the co-existence problem of edge nodes and the environmental wireless networks also needs to be considered. Specifically, as low power radios are often employed in the IoT nodes, they can be easily affected by WiFi communications, Bluetooth communiations, etc [13], [14].
Our goal now is to deploy a number of edge nodes to the IoT network to cover all the IoT nodes. The problem of minimizing the number of edge nodes is equivalent to the problem of Knapsack problem [15], which is NP Complete. Therefore in this paper, we design a heuristic to reduce the number of edge nodes and provide high-throughput data collection/dissemination service for real-time data processing in the IoT networks.
III. DIVERSITYAWAREDEPLOYMENT OF THEEDGE
SERVERS
In this section, we present the three-phase deployment approach. Specially, we will present the details on considering traffic diversity and wireless diversity.
A. Challenges
There are two challenges to deploy edge nodes for real-time data processing in large-scale IoT – Traffic diversity and wireless diversity.
the edge nodes are often powerful, in this paper, we mainly consider the diversity of traffic demands. Differ-ent amount of traffic demands will directly affect the deployment of edge nodes in two ways. First, the edge nodes are targeted to receive data from the IoT nodes. Intuitively, the edge nodes should be deployed nearer to the IoT nodes with more traffic demands. Second, the traffic demands may not be consistent with the node density because different nodes have different demands. The two factors need to be jointly considered in the deployment process.
2) Wireless diversity. For wireless diversity we mainly consider link quality and link correlation. For many large-scale IoT systems, especially for those deployed in indoor environments, the WiFi networks, Bluetooth communications, even microwave ovens can have large impact on the transmission quality between the edge nodes and the IoT nodes as they typically use low-power radios (e.g., ZigBee). Considering that edge nodes are used to collect sensory data and disseminate remote commands and maintenance instructions, both inbound and outbound performance can be largely impacted by the interference. Therefore, the link quality/correlation distribution and the impact on the performance of both collection/dissemination should also be considered in the deployment process.
B. Overview
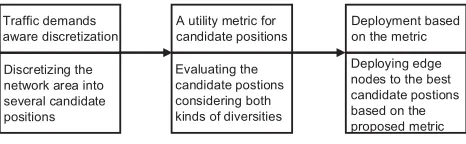
To address the above challenges and deploy the edge nodes effectively, we incorporate the two kinds of diversities into the deployment process and propose a three-phase deployment approach. Figure 2 shows the overview of the proposed approach.
1) Discretization. Before determining the positions for deploying edge nodes, we first discretize the whole IoT network area into many small sections and the centroid of each section is a candidate position. In the discretiza-tion, we combine both wireless transmissions and the data traffic demands to define “effective” transmission levels, with which all nodes’ levels are normalized and the traffic diversity is incorporated. The details are described in Section III-C.
2) A utility metric. Next, we propose a comprehensive metric to evaluate the impact of each candidate position. The utility metric calculates the expected performance gain of the candidate position regarding the expected number of transmissions required for both data collec-tion and message disseminacollec-tion. Wireless diversity in-cluding link quality and link correlation among multiple links are considered in the metric. The detailed design of the metric is described in Section III-D.
3) The deployment algorithm. Based on the proposed utility metric, we further devise a heuristic to select the best candidate positions for deploying the edge nodes. The input is the traffic demands and wireless
Discretizing the network area into several candidate positions
Evaluating the candidate postions considering both kinds of diversities
[image:3.612.321.554.62.134.2]Deploying edge nodes to the best candidate postions based on the proposed metric
Fig. 2. Overview of the proposed work.
measurements (link quality/correlation) from the IoT network; The output is the positions for deploying edge nodes. We discussed the possible ways to reduce the measurement overhead in Section III-E.
The notations used throughout this paper is listed as follows.
TABLE I
THE NOTATIONS USED THROUGHOUT THIS PAPER.
Notations Description
Pc The set of all candidate positions. Ps The set of selected positions for deployment.
pi Thei-th candidate position.
ρi The proposed metricρfor candidate positionpi. ln
i The distance of thei-th level of IoT noden. dn The data traffic demand of noden. tn
r The transmission rate fromnto positionr. u The total number of levels considered in the discretization.
pc
k The collection performance for candidate positionpk. pd
k The dissemination performance for candidate positionpk. qij The packet delivery ratio of linki→j. cn
i/j The link correlation between linksn→iandn→j. cn
Ni/Nj The set link correlation between subsetNiandNj.
C. Discretization
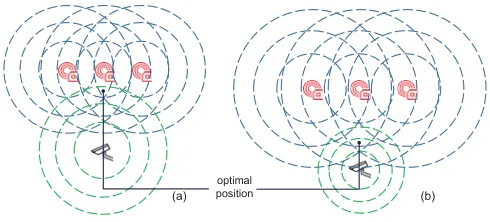
Given the positions of the IoT nodes, we can obtain a series of candidate positions for edge nodes deployment. In the existing works, the areas are divided by the levels of the communication quality. For example in Figure 3(a), the area is divided by the circles denoting the different transmission rates. Each block that lies in a combination of different levels of the IoT nodes is a candidate position. For each candidate position, the corresponding transmission rates are used for position selection. In the case shown in Figure 3(a), the optimal position for deploying en edge node is close to the three IoT sensors because it achieves the best average transmission rate.
(a) (b) optimal
[image:4.612.52.297.65.176.2]position
Fig. 3. The discretization approach with different leveling schemes. (a) shows the case that uses the transmission-rate levels for discretization; (b) shows the normalized levels which consider the data traffic demands from different IoT nodes.
traffic demands. The defined “normalized” level i of node n is calculated as
ln
i =argr( tn
r dn = 1−
i
u) (1)
where i∈[0, u] denotes the i-th level and the percentage of the transmitted data out of the total transmission demand in unit time equals 1-ui;udenotes the total number of levels;dn denotes the transmission demand of node n and tn
r denotes the expected transmission rate at the circle with radius r. For example, if we calculate ten levels for noden, then the second level of n is ln
0.8 which equals to the radius r with which tnr
dn = 0.8. By such leveling scheme, the relationship between a node’s effectiveness and the distance can be normalized. Figure 3(b) shows the normalized levels. We can see that compared to the original levels, the normalized levels for cam-era sensors become geographically smaller and the normalized levels for ordinary sensors become geographically larger. As a result, the optimal deployment position become closer to the camera. Since the cameras have high traffic demand and the ordinary sensors have low traffic demand, the new deployment can provide fast task offloading and real-time transmission for both nodes while the deployment in Figure 3(a) can provide real-time transmission for only the ordinary nodes.
It is also worth noting that the actual transmission rate at a given radius can be largely different due to the wireless interference. We will consider the impact of the wireless interference in the evaluation metric for the candidate positions in Section III-D. Once we have obtained the normalized levels for all IoT nodes, the target area has been divided into many candidate positions for EN deployment. We then use the utility metric to estimate the effectiveness of the candidate positions and then select the best deployment positions.
D. A utility metric for candidate positions
As the traffic diversity is considered in the discretization, now we need to take the wireless link diversity into account. Considering the the edge nodes are responsible for collecting data from the candidate nodes and sometimes disseminating the update codes or maintenance instructions to the IoT nodes, we need to consider the performance for both collection and dissemination. According to the weights of data collection and
dissemination, we devise a comprehensive performance metric ρfor a candidate positionk as follows:
ρk =αpck+ (1−α)pdk (2)
wherepc
k denotes the performance for data collection and pdk denotes the performance for data dissemination. pc
k is given by the sum of all packet delivery ratio (PDR) of one-hop IoT nodes:
pck = i∈N
qik×liidx(i,k) (3)
where qik denotes the link quality from node i to node k; idx(i, k)denotes the level index for candidate positionkin the range of IoT nodei;N denotes the set of all IoT nodes. Then the physical meaning ofpc
kis the effective transmission rate for all connected IoT nodes of edge nodek. The calculation for the dissemination performancepd
k is more complex as it involves both link quality and link correlation [16]. We calculate the dissemination performance by combining both link quality and link correlation. Link quality is defined as the packet delivery ratio (PDR) and link correlation is defined for link pairs as follows. Given two linksk→iandk→j, the link correlation is calculated as the probability thatk→ifails a packet given that k → j fails the same packet. We denote the above link correlation as ck
i/j.
Next, we combine link quality and link correlation to cal-culate the dissemination performance in terms of the expected transmissions required for edge nodek to deliver a packet to all target receivers, denoted as pd
k. pdk can be calculated as follows according to its definition:
pd k=
+∞
m=1
mPk
n(X=m) (4)
wherePk
n(X =m) denotes thatm packet transmissions are required forkto deliver a packet to allnnodes.Pk
n(X =m) can be calculated as:
Pk
n(X=m) =Pnk(X > m−1)−Pnk(X > m) (5)
where Pk
n(X > m) denotes the number of transmissions for covering n nodes is larger than m, which equals to the probability thatm transmissions cannot cover allnnodes:
Pk
n(X > m) = (1−qkn)m+Pn−k 1(X > m)−((1−qkn)×ckNn−1/n)m (6)
where(1−qkn)mdenotes the probability thatmtransmissions cannot cover the n-th node, Pk
n−1(X > m) denotes the probability that m transmissions cannot cover the remaining n−1 nodes, i.e., there is at least one node which cannot be covered bym transmissions in the n−1 nodes. There is an overlap between the first two items, which is the case that the n-th node loses the packet and then−1nodes are not covered at the same time. Therefore, we need to minus the overlapped probability, i.e., the third item((1−qkn)×ck
Pk
n(X > m) = n
r=1
((1−qkr)m−((1−qkr)×ck
r−1/r)m) (7)
Apparently, ck0/1= 0 according to the definition.
Combining Eq.(4)-(7), we can then obtain the performance for data dissemination from an edge nodekto all its potential IoT receiver nodes. Then with Eq.(2), we can calculate the utility for each candidate position and sort all candidate positions according to the utility.
Determining the weighing factor in Eq.(2).The α deter-mines weights of collection and dissemination tasks. Suppose there aresccollection traffic andsddissemination traffic, then we have:
α
1−α = sc sd
(8)
By solving the above equation, αcan be obtained:
α= sc sc+sd
(9)
It is worth noting that we assume the offloaded task execution and data processing does not incur noticeable delay for the transmission. Otherwise, the delay incurred by the computa-tional tasks also needs to be considered in the calculation ofα. The task informationscandsdis provided by the IoT network operator.
Wireless link measurement. As shown in the calculation of the ρmetric, link quality and link correlation need to be measured. We have two alternatives for link measurement: First, link predictions based on the SINR measurements using the model proposed in [17]. By measuring the SINR at all candidate positions, both link quality and link correlation can be predicted. Second, link estimation using the in-packet RSSI sampling. By increasing the sampling rate of the wireless radios, we can extract the byte-wise RSSI readings. For example, we can obtain 127 RSSI samplings from an 127-byte packet. As studied in [18], the difference between a given RSSI value and the lowest RSSI value is a good indicator to the error rate for the corresponding byte. Based on the RSSI-based error estimation method [19], we can obtain a series of BER and the variations from the RSSI samplings. Then PDR can be inferred using BER as follows:
q= t
i=1
(1−be[i]) (10)
where be[i] denotes the estimated BER for i-th byte and t denotes the packet length in terms of bytes.
Link correlation can be estimated using either single packet or multiple packets.
1) If single packet is used, the expected link correlation between two linksk→iandk→j is given by:
cki/j = t
m=1
bki[m]&bkj[m] bkj[m]
(11)
wherebki[m]denotes the binary indicating whetherm-th byte is erroneous in the packet fromktoiand&denotes
2) If multiple packets are used, link correlation is calculated as in Eq.(11). The difference is that bki[m] can be directly obtained instead of estimated from the RSSI sampling.
Compared to the measurement with multiple packets, the measurement with single packet can be done more quickly. The drawback is that the accuracy will be decreased. Both measurement schemes can be used according to the application scenario.
E. Deployment algorithm
Based on the metric ρ proposed in Section III-D, we can sort all the candidate positions. As discussed in Section II, the problem is NP complete. We then propose a heuristic solution by selecting the candidate positions from the position with the best ρ. When a candidate position is selected, the IoT nodes within them-th utility level are included as its subscribing re-ceivers. Then we exclude all the covered subscribing receivers, update the ρ values for all candidate positions (expected the chosen positions) and select the position with the highest ρ for deploying the next edge node. The above process continues until all IoT nodes are covered by the edge nodes. The detailed deployment algorithm is described in Alg. 1.
Algorithm 1 The deployment algorithm Input:
1) The set of all candidate positions,Pc; 2) The set of all IoT nodes,N;
3) The link quality/correlation for all positions which is used for calculating the ρ metric for the candidate positions;
Output: The selected positions for edge node deploymentPs 1 whileThere existsn∈N that is not covered by anypi∈Pc.
do
2 foreach candidate positionpi∈Pc do 3 ρi=mCal(pi);
if ρi≥ρi−1 then 4 pbest=pi
5 end
6 end
7 Ps.insert(pbest);
Pc=Pc.remove(pbest);
foreach IoT node ni∈N(pbest)do 8 N =N.remove(ni);
9 end
10 end
positions in each iteration. With a largerτ, the algorithm runs fast but the selected positions may have worse utilities; With a smallerτ, the algorithm runs slow but the selected positions have better utilities. We will consider using energy efficient clustering algorithms [20], [21], [22] to find the deployment positions in our future work.
IV. EVALUATION
In this section, we evaluate the proposed deployment scheme in comparison with [23], which deploys multiple sinks to a sensor network. The sink nodes are responsible for collecting the sensor data, which play similar role with the edge nodes in our scenario.
A. Experimental settings
We simulate a 100-node IoT network, where the data traffic in unit time for all IoT nodes are randomly generated. The edge nodes are assumed to be able to receiveT = 150KBps. For a given candidate position, the topm IoT nodes with the best ρ are selected to be connected to the position. The sum of the traffic from the selected m nodes does not exceed T. Hence mis given by:
m= max n
n
k=0
rk≤T (12)
Apparently,mis varying for different positions. The positions of the IoT nodes are randomly placed. We repeat each simu-lation 100 times to reduce the random variations. We compare the following metrics:
1) The number of edge nodes used to cover all IoT nodes. 2) The performance gain in terms of the average throughput
between IoT nodes and the edge nodes.
We tune the following parameters to see in which cases the proposed work performs better or worse.
1) The fraction of demand IoT nodes. The high-demand IoT nodes generate five times traffic of the ordinary IoT nodes. We tune the fraction of the high-demand nodes and see the performance gain achieved by the proposed work.
2) The fraction of dissemination tasks. Different IoT net-works may have different designing goals, leading to different fractions of dissemination tasks [24]. This fraction has impact on the calculation ofρ.
3) The wireless interference. We change the number of interfering wireless APs and compare the performance gains. The interference impacts the wireless diversities, which further impacts the selection of candidate posi-tions.
B. Simulation results
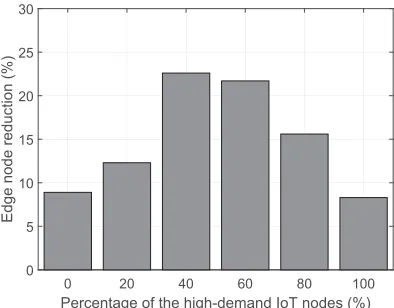
Figure 4 shows the reduction of deployed edge nodes with different fractions of the high-demand IoT nodes. We change the number of high-demand IoT nodes to see the impact on the reduction. We can see that 1) compared to the existing work based solely on wireless communications, the proposed work always reduces the number of edge nodes. The reason
0 20 40 60 80 100 Percentage of the high-demand IoT nodes (%) 0
5 10 15 20 25 30
[image:6.612.339.536.56.210.2]Edge node reduction (%)
Fig. 4. The reduction on the number of edge nodes with different high-demand IoT nodes.
0 20 40 60 80 100
Fraction of dissemination tasks (%) 0
20 40 60 80 100
Througput gain (%)
[image:6.612.337.537.256.406.2]Collection Dissemination
Fig. 5. The throughput gains with varying fractions of dissemination tasks.
is that although link quality is important, the throughput may not be good as high-demand nodes may be assigned to poor-quality links. 2) The reduction increases and then decreases, which means our work better suits for the case with more diverse traffic demands from IoT nodes. The reason is that we explicitly consider the traffic diversity in the candidate positions. As a result, when the IoT nodes are more diverse, we have more room for optimization.
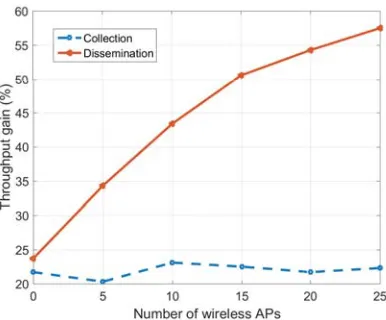
Fig. 6. The throughput gains with varying interfering wireless APs.
0 5 10 15 20 25 Number of wireless APs 0
5 10 15 20 25 30
[image:7.612.76.275.253.408.2]Edge node reduction (%)
Fig. 7. The reduction on the number of edge nodes with varying interfering wireless APs.
traffic as the main aim is to collect the interesting data from the target area. For some IoT applications with more controlling tasks, the fraction of dissemination tasks should be larger.
Figure 6 shows the throughput gains for collection and dissemination under different number of wireless APs (WiFi). Similar to [25], the impact of WiFi interference is introduced in the simulation by deliberately failing some packet transmis-sions. The packet losses generated at the sender side will be the correlated packet losses and the packet losses generated at the receiver side will be the independent packet losses. According to the studies in [25], WiFi interference is a dominating reason for correlated packet losses, as a result the packet loss link correlation becomes stronger when WiFi interference becomes stronger. From the results it can be inferred that as the interfer-ence becomes stronger, the throughput gain of dissemination becomes larger and the throughput gain of collection remains similar. From the calculation process in Section III-D we can see that link correlation mainly impacts the performance of data dissemination. When link correlation becomes stronger with the interference, there are more optimization space for dissemination.
Figure 7 depicts the reduction of edge nodes with varying number of interfering wireless APs. Different from the exper-iment in Figure 4, the fraction of high-demand IoT nodes is
tasks. It can be inferred that 1) the reduction increases as the interference becomes stronger. From the above analysis on dissemination, we can infer that the increments come from the portion of nodes that have 20% dissemination tasks. In order to meet the dissemination throughput threshold, more edge nodes will be required for the work without considering dissemination performance. 2) Compared to the results in Figure 4, the reduction changes are much smaller. Therefore, we can conclude that the number of edge nodes is mainly determined by the traffic diversity. The impact of interference on reducing the edge nodes is limited.
V. RELATEDWORKS
The combination of mobile edge servers and IoT as well as the corresponding benefits are discussed in [26]. Our work differs from the scenario described in [26] in the following ways. First, we consider a large-scale and more practical IoT network, where different IoT nodes are with more diverse demands. Second, we focus on the deployment problem of edge nodes for IoT network while the authors in [26] consider a general idea of combining mobile edge computing and IoT applications.
Although there are few existing works on deploying edge servers for large-scale IoT network, the problem is closely related to the powerful node deployment problem in large-scale sensor networks, where the powerful nodes can be either relay nodes or sink nodes [27], [28], [29], [23], [30], [31], [32]. Next, we mainly introduce and discuss the literature for deploying relay nodes or multiple sink nodes in large-scale sensor networks. Bredin et al. [28] studied the relay node deployment problem which should meet a survivability requirement. Cheng et al. [29] considers the connectivity constraint in the relay node deployment. Similar to our work, each IoT node is required to be connected to a relay node. Misra et al.[23] additionally consider limiting the candidate positions and propose to select candidate positions before deployment. Our work differs from [23] in that we incor-porate the traffic diversity (traffic demand distribution) in the candidate position generation process, therefore providing more reasonable and efficient candidate positions. Nikolov
et al. [32] aim at deploying a given number of relays to the network to maximize the communication gains. Bagaa
et al. [27] is a recent work that achieves optimal placement of the relays over limited candidate positions. Different from these works, IoT networks contains more diverse nodes and experience more wireless interference. Therefore in our work, we jointly consider the traffic diversity and wireless diversity (especially the link correlation characteristic). As a result, the proposed work is more suitable for large-scale heterogeneous IoT networks and can achieve better throughput gains.
easily added into our scheme. Besides, the traffic diversity and link correlation are overlooked in these works, which may lead to performance degradation under strong interference scenarios.
VI. CONCLUSION
In this paper, we propose to deploy edge nodes for real-time data processing in large-scale IoT networks. We identified the key challenges for edge node deployment – the traffic diversity and the wireless diversity. We then propose a novel three-phase deployment approach considering both kinds of diversities. The proposed work aims at minimizing the number of edge nodes and providing real-time processing service for the IoT network. We have conducted simulation experiments and the results show that compared to the existing works that overlooked the two kinds of diversities, the proposed work greatly reduces the number of edge nodes and improves the throughput for both data collection and dissemination.
ACKNOWLEDGMENT
This work was supported by the National Natural Science Foundation of China (No. 61602095), the Na-tional Key Research and Development Program of China (2017YFB1400102), the Fundamental Research Funds for the Central Universities (No. ZYGX2016KYQD098 and No. ZYGX2016J079), National Postdoctoral Program for Innova-tive Talents of China, and the EU FP7 CLIMBER project under Grant Agreement No. PIRSES-GA-2012-318939.
REFERENCES
[1] J. Gubbi, R. Buyya, S. Marusic, and M. Palaniswami, “Internet of things (iot): A vision, architectural elements, and future directions,” Future generation computer systems, vol. 29, no. 7, pp. 1645–1660, 2013. [2] W. Du, Z. Xing, M. Li, B. He, L. H. C. Chua, and H. Miao, “Sensor
placement and measurement of wind for water quality studies in urban reservoirs,” ACM Transactions on Sensor Networks (TOSN), vol. 11, no. 3, p. 41, 2015.
[3] Z. Li, W. Du, Y. Zheng, M. Li, and D. Wu, “From rateless to hopless,” IEEE/ACM Transactions on Networking (TON), vol. 25, no. 1, pp. 69– 82, 2017.
[4] M. Razmara, G. R. Bharati, M. Shahbakhti, S. Paudyal, and R. D. Robinett III, “Bilevel optimization framework for smart building-to-grid systems,”IEEE Transactions on Smart Grid, 2016.
[5] A. Bader, H. ElSawy, M. Gharbieh, M.-S. Alouini, A. Adinoyi, and F. Alshaalan, “First mile challenges for large-scale iot,”IEEE Commu-nications Magazine, vol. 55, no. 3, pp. 138–144, 2017.
[6] M. V¨ogler, J. M. Schleicher, C. Inzinger, and S. Dustdar, “A scalable framework for provisioning large-scale iot deployments,”ACM Trans-actions on Internet Technology (TOIT), vol. 16, no. 2, p. 11, 2016. [7] P. Barnaghi, R. T¨onjes, J. H¨oller, M. Hauswirth, A. Sheth, and P.
Anan-tharam, “Citypulse: Real-time iot stream processing and large-scale data analytics for smart city applications,” inEuropen Semantic Web Conference (ESWC), vol. 2014, 2014.
[8] F. Chen, Z. Zhao, G. Min, W. Gao, J. Chen, H. Duan, and P. Yang, “Speed control of mobile chargers serving wireless rechargeable net-works,”Future Generation Computer Systems, vol. 80, pp. 242–249, 2018.
[9] Y. C. Hu, M. Patel, D. Sabella, N. Sprecher, and V. Young, “Mobile edge computinga key technology towards 5g,”ETSI White Paper, vol. 11, no. 11, pp. 1–16, 2015.
[10] T. X. Tran, A. Hajisami, P. Pandey, and D. Pompili, “Collaborative mobile edge computing in 5g networks: New paradigms, scenarios, and challenges,”IEEE Communications Magazine, vol. 55, no. 4, pp. 54–61, 2017.
[11] U. Raza, P. Kulkarni, and M. Sooriyabandara, “Low power wide area networks: An overview,” IEEE Communications Surveys & Tutorials, vol. 19, no. 2, pp. 855–873, 2017.
[12] K. Nair, J. Kulkarni, M. Warde, Z. Dave, V. Rawalgaonkar, G. Gore, and J. Joshi, “Optimizing power consumption in iot based wireless sensor networks using bluetooth low energy,” inGreen Computing and Internet of Things (ICGCIoT), 2015 International Conference on. IEEE, 2015, pp. 589–593.
[13] Z. Zhao, J. Bu, W. Dong, T. Gu, and X. Xu, “Coco+: Exploiting correlated core for energy efficient dissemination in wireless sensor networks,”Ad Hoc Networks, vol. 37, pp. 404–417, 2016.
[14] R. Zhou, Y. Xiong, G. Xing, L. Sun, and J. Ma, “Zifi: wireless lan discovery via zigbee interference signatures,” in Proceedings of the sixteenth annual international conference on Mobile computing and networking. ACM, 2010, pp. 49–60.
[15] R. S. Garfinkel, G. L. Nemhauseret al.,Integer programming. Wiley New York, 1972, vol. 4.
[16] Z. Zhao, W. Dong, J. Bu, T. Gu, and G. Min, “Accurate and generic sender selection for bulk data dissemination in low-power wireless networks,” IEEE/ACM Transactions on Networking (TON), vol. 25, no. 2, pp. 948–959, 2017.
[17] Z. Zhao, W. Dong, G. Guan, J. Bu, T. Gu, and C. Chen, “Modeling link correlation in low-power wireless networks,” inComputer Commu-nications (INFOCOM), 2015 IEEE Conference on. IEEE, 2015, pp. 990–998.
[18] W. Dong, J. Yu, and P. Zhang, “Exploiting error estimating codes for packet length adaptation in low-power wireless networks,” IEEE Transactions on Mobile Computing, vol. 14, no. 8, pp. 1601–1614, 2015. [19] Z. Zhao, W. Dong, G. Chen, G. Min, T. Gu, and J. Bu, “Embracing corruption burstiness: Fast error recovery for zigbee under wi-fi inter-ference,”IEEE Transactions on Mobile Computing, vol. 16, no. 9, pp. 2518–2530, 2017.
[20] L. Zhao, Z. Chen, and Y. Yang, “Parameter-free incremental co-clustering for multi-modal data in cyber-physical-social systems,”IEEE Access, vol. 5, pp. 21 852–21 861, 2017.
[21] G. Tzortzis and A. Likas, “The minmax k-means clustering algorithm,” Pattern Recognition, vol. 47, no. 7, pp. 2505–2516, 2014.
[22] L. Zhao, Z. Chen, Z. Yang, Y. Hu, and M. S. Obaidat, “Local similarity imputation based on fast clustering for incomplete data in cyber-physical systems,”IEEE Systems Journal, 2016.
[23] S. Misra, S. D. Hong, G. Xue, and J. Tang, “Constrained relay node placement in wireless sensor networks: Formulation and approxima-tions,”IEEE/ACM Transactions on Networking (TON), vol. 18, no. 2, pp. 434–447, 2010.
[24] L. Wang and S. Kulkarni, “Gappa: Gossip based multi-channel re-programming for sensor networks,” Distributed Computing in Sensor Systems, pp. 119–134, 2006.
[25] K. Srinivasan, M. Jain, J. I. Choi, T. Azim, E. S. Kim, P. Levis, and B. Krishnamachari, “Theκfactor: inferring protocol performance using inter-link reception correlation,” inProceedings of the sixteenth annual international conference on Mobile computing and networking. ACM, 2010, pp. 317–328.
[26] P. Corcoran and S. K. Datta, “Mobile-edge computing and the internet of things for consumers: Extending cloud computing and services to the edge of the network,” IEEE Consumer Electronics Magazine, vol. 5, no. 4, pp. 73–74, 2016.
[27] M. Bagaa, A. Chelli, D. Djenouri, T. Taleb, I. Balasingham, and K. Kansanen, “Optimal placement of relay nodes over limited positions in wireless sensor networks,”IEEE Transactions on Wireless Commu-nications, vol. 16, no. 4, pp. 2205–2219, 2017.
[28] J. L. Bredin, E. D. Demaine, M. T. Hajiaghayi, and D. Rus, “Deploying sensor networks with guaranteed fault tolerance,”IEEE/ACM Transac-tions on Networking (TON), vol. 18, no. 1, pp. 216–228, 2010. [29] X. Cheng, D.-Z. Du, L. Wang, and B. Xu, “Relay sensor placement in
wireless sensor networks,”Wireless Networks, vol. 14, no. 3, pp. 347– 355, 2008.
[30] D. Wu, D. Chatzigeorgiou, K. Youcef-Toumi, S. Mekid, and R. Ben-Mansour, “Channel-aware relay node placement in wireless sensor networks for pipeline inspection,”IEEE Transactions on Wireless Com-munications, vol. 13, no. 7, pp. 3510–3523, 2014.
[31] C. Ma, W. Liang, and M. Zheng, “Set-covering-based algorithm for delay constrained relay node placement in wireless sensor networks,” in Communications (ICC), 2016 IEEE International Conference on. IEEE, 2016, pp. 1–6.