Volume: 06 Issue: 03 | Mar 2019 www.irjet.net p-ISSN: 2395-0072
© 2019, IRJET | Impact Factor value: 7.211 | ISO 9001:2008 Certified Journal
| Page 1076
Reversible Data Hiding in Video Frames based on Matched
Neighbour Predictors
Jerisha Liby J
1, Jaya T
21
Research Scholar, C.S.I.I.T, Thovalai
2Research Supervisor & Head, C.S.I.I.T, Thovalai
---***---
Abstract - This paper proposes a Reversible Data Hiding (RDH) on video frames that uses a new predictor named as Matched
Neighbour Predictor (MNP). Inspired by the Prediction Error Expansion technique (PEE), the Matched Neighbour Predictor is proposed. In prediction error expansion technique, a predicted image is estimated from the host image and the prediction error is estimated by obtaining the difference between the host image and the predicted image. In the proposed MNP technique the predicted image is estimated by choosing three consecutive frames of the video. The distortion between first/third frame and second frame is used to check whether the data can be embedded or not. The proposed method produces a low prediction error compared to traditional predictor and the data is embedded by expanding the prediction error. The performance of the proposed algorithm was measured using the metrics such as embedding rate (bpp) and PSNR (Peak signal to noise ratio).
Index Terms— Embedding rate, Prediction Error Expansion, Reversible Data Hiding, Video frames
1. Introduction
Data hiding [1]-[5] is a technique that conceals the data into the cover media such as image, video etc. In order to recover the cover media and hidden information reversible data hiding are commonly used. This data hiding technique is used in many applications such as copyright protection, medical imaging and military applications. Several researches are done on RDH which includes the popular state-of-art such as difference expansion, prediction error and histogram shifting. The histogram shifting [6] method estimates the histogram and it estimates the intensity to hide the data. The histograms to the left of bin are shifted to the left to embed the data. In difference expansion a pair of pixel is chosen and the difference between the pixels of the pair is used to embed the data. The quality of image highly reduces if the difference is large for more number of pairs.
The prediction error expansion technique initially estimates a predicted image from the host image, and the difference between the predicted image and host image gives the prediction error. The data is embedded by the expansion of prediction error. Several RDH algorithm [7]-[10] have been proposed using the prediction errors, to achieve better performance. Since color is a powerful visual descriptors, there are several data embedding algorithms in color space that includes three-color-channel based algorithms [11]-[12], chrominance based algorithm [13]-[14] and luminance based algorithms [15]-[16]. It is not possible to recover the host color image from the marked color image in these algorithms. In order to achieve the property of reversibility, researches started to work on prediction error that has sharper histograms and thereby reducing the total distortion. After embedding the data, the color marked image appears to be a noisy image when comparing the host image.
In [17] Zhang et al proposed a Reversible data hiding with Gray scale invariance. This method satisfies the property of gray scale invariance. i.e. the gray scale version of RGB image before and after embedding remains the same. This method uses R and B channel to embed the data while green channel is used for adjustment to satisfy the property of gray scale invariance. This method predicts the predicted image using a new predictor from which the prediction error is estimated by obtaining the difference between the host image and predicted image. The data is embedded on the prediction error by expanding it. After embedding the data the green channel is adjusted to maintain the original gray version. Similar to data embedding, the data extraction algorithm initially extracts the data from the R and B channel. The original R and B channels are then reconstructed form the marked R and B channels. Finally the G channel is readjusted to obtain the original host image.
The rest of the paper is constructed as follows section II shows the proposed RDH algorithm on video. Section III shows the experimental results and analysis of the proposed RDH algorithm and finally section IV depicts the conclusion of the proposed work.
I. Proposed RDH Algorithm
Volume: 06 Issue: 03 | Mar 2019 www.irjet.net p-ISSN: 2395-0072
© 2019, IRJET | Impact Factor value: 7.211 | ISO 9001:2008 Certified Journal
| Page 1077
image, represents the pixels of host image. The prediction error can be estimated from the host image and predicted image as,
(1)
where represents the position of pixel. The proposed Reversible data hiding algorithm has two major modules such as (a) Data Embedding and (b) Data Extraction
A. Data Embedding
[image:2.595.128.506.239.366.2]Fig 1 shows the block diagram of the proposed data embedding algorithm, where it uses frame 2 as reference frame for estimating the prediction error and frame 1 and 3 is used for embedding the data.
Fig. 1. Block diagram of Proposed Data embedding
Let represents any three consecutive frames of a video, where each frame has components
represented by, , and
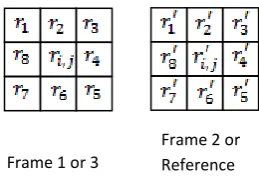
[image:2.595.247.377.480.569.2]The predicted image is estimated for frame 1 and frame 3 by using frame 2 as reference frame. Fig 2 shows the estimation of predicted image during data embedding by keeping frame 2 as reference frame. The predicted image of red component of frame 1 is calculated using matched neighbour predictor (MNP) as follows,
Fig. 2. Estimation of predicted image during data embedding
Let represents a distortion threshold. The prediction image is chosen if the distortion is less than the distortion threshold ie. .
(2)
If the distortion is less than the distortion threshold ie then the predicted image of is . If the distortion is greater than or equal to the distortion threshold ie then the pixel should not be used for embedding. Let represents the predicted image of . Similarly the predicted images of green and blue channels are estimated. Let represents the predicted image of green and blue channels and respectively.
Video frames Predicte d Image Prediction error Data Embedding Frame 1 Frame 2
Frame 3 Predicte
d Image Prediction error Data Embedding Data 2 Data 1 Marked frame 1 Marked frame 2 Marked frame 3 Marked Video frames
Frame 1 or 3
Frame 2 or Reference
Volume: 06 Issue: 03 | Mar 2019 www.irjet.net p-ISSN: 2395-0072
© 2019, IRJET | Impact Factor value: 7.211 | ISO 9001:2008 Certified Journal
| Page 1078
(3)
Similarly the predicted image of third frame is estimated by keeping frame 2 as reference frame. Let the predicted image of third frame is represented as,
(4)
The prediction error of frame 1 is calculated as,
(5)
The prediction error of frame 3 is calculated as,
(6)
The data 1 is embedded on the prediction error and the data 2 is embedded on the prediction error . Let represents the set of data to be embedded on (i.e. data 1) and be the set of data to be embedded on (i.e. data 2). The modified prediction error after embedding the data on two frames will be,
(7)
(8)
The first frame after embedding (marked video frame 1) will be,
(9)
Similarly the third frame after embedding will be,
(10)
The second marked video frame is same as that of second host video frame.
(11)
B. Data Extraction
Fig . 3. Estimation of predicted image during data extraction
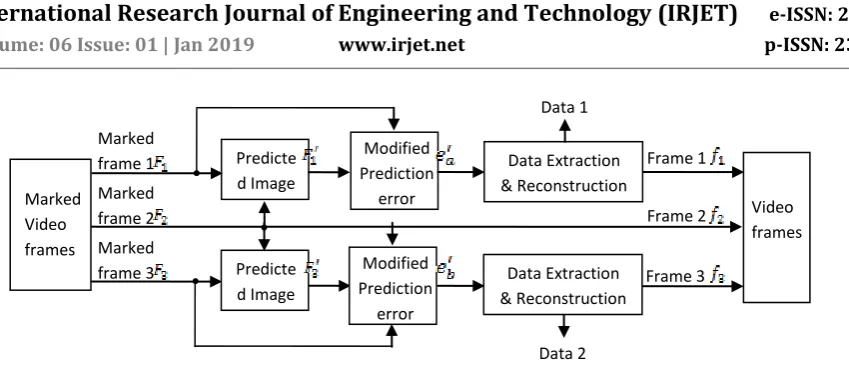
Fig 4 shows the block diagram of the proposed data extraction algorithm. The data extraction process is similar to data embedding. Fig 3 shows the estimation of predicted image during data extraction.
Marked Frame 1 or 3
Volume: 06 Issue: 01 | Jan 2019 www.irjet.net p-ISSN: 2395-0072
[image:4.595.89.514.49.235.2]© 2019, IRJET | Impact Factor value: 7.211 | ISO 9001:2008 Certified Journal
| Page 1079
Fig. 4. Block diagram of Proposed Data extraction
Let represents the three consecutive marked video frames represented as, ,
and .
Similar to data embedding, the predicted image for frame 1 and frame 3 can be estimated by keeping frame 2 as reference frame. The distortion can be calculated using (2). If is less than the distortion then data is available in the location . If is greater than the distortion threshold then the data is not available in the location . Let and represents the predicted image frames of marked frame and respectively. The modified prediction errors of marked frame1 and frame3 can be estimated as,
(12)
(13)
From the modified prediction errors data 1 can be recovered using,
(14)
Similarly, the data 2 can be recovered using.
(15)
From the modified prediction errors and the prediction errors and can be calculated as,
(16)
(17)
where represent the floor operation. From the prediction errors, the host video frame 1 and frame 3 can be recovered as,
(18)
(19)
The second frame will be same as that of marked video frame (i.e. )
III. Experimental Results
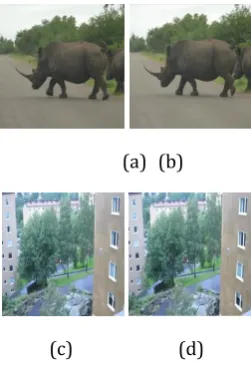
The simulation of the proposed work was done using MATLAB and the performance of the proposed work was tested using two ‘video 1’ and ‘video 2’ each having frames. The frame size of each videos are . Fig 5 shows the frame of
Video frames Predicte d Image Modified Prediction error Data Extraction & Reconstruction Predicte d Image Data 2 Data 1 Marked Video frames Frame 1 Marked frame 1 Marked frame 2 Marked
frame 3 Modified
Volume: 06 Issue: 01 | Jan 2019 www.irjet.net p-ISSN: 2395-0072
© 2019, IRJET | Impact Factor value: 7.211 | ISO 9001:2008 Certified Journal
| Page 1080
video 1 and video 2. A bit gray scale image Lena, Barbara and Baboon are used as data which is shown in fig (6). The performance of the proposed method was analysed using the metrics such as embedding rate and PSNR.
(a) (b) (c)
[image:5.595.186.408.126.328.2](d) (e) (e)
Fig. 5. Three consecutive frames of video 1 and video 2 (a)-(c) frame 1, frame 2 and frame 3 of video 1 (d)-(e) frame 1, frame 2 and frame 3 of video 2
(a) (b) (c)
Fig 6: Secret images (a) Lena (b) Barbara (c) Baboon
The embedding rate can be calculated using,
(20)
where is the embedding capacity i.e. number of bits to be hidden, is the frame size and is the total number of frames required to hide bits. The PSNR between host frame and marked frame for the proposed method was calculated using the relation,
(21)
where,
[image:5.595.189.408.369.468.2]Volume: 06 Issue: 01 | Jan 2019 www.irjet.net p-ISSN: 2395-0072
© 2019, IRJET | Impact Factor value: 7.211 | ISO 9001:2008 Certified Journal
| Page 1081
(a) (b)
[image:6.595.80.553.46.275.2](c) (d)
Fig 7: Marked video frames for the secret image Lena (a)-(b) frames 1 and 3 for video 1 (c)-(d) frames 1 and 3 for video 2
(a) (b)
[image:6.595.252.379.304.483.2](c) (d)
Fig 8: Marked video frames for the secret image Barbara (a)-(b) frames 1 and 3 for video 1 (c)-(d) frames 1 and 3 for video 2
(a) (b)
(c) (d)
Fig 9: Marked video frames for the secret image Baboon (a)-(b) frames 1 and 3 for video 1 (c)-(d) frames 1 and 3 for video 2
[image:6.595.252.378.523.707.2]Volume: 06 Issue: 01 | Jan 2019 www.irjet.net p-ISSN: 2395-0072
© 2019, IRJET | Impact Factor value: 7.211 | ISO 9001:2008 Certified Journal
| Page 1082
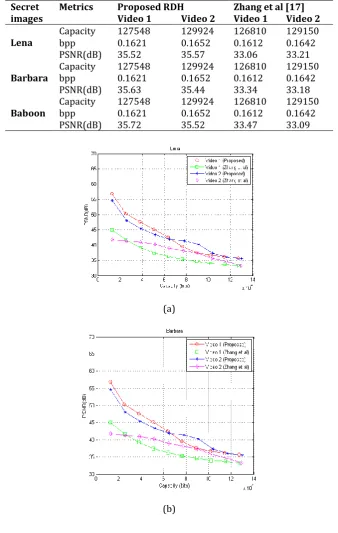
[image:7.595.128.467.160.694.2]Fig 7, fig 8 fig 9 shows the marked video frames 1 and 3 for two videos, video 1 and video 2 with different secret images like Lena, Barbara and Baboon. The performance of the proposed method was compared with the traditional Zhang et. al method [17]. Table 1 shows the Capacity, embedding rate (bpp) and PSNR of one frame for the proposed RDH algorithm.
TABLE 1: Capacity, Embedding Rate And PSNR Measurement
Secret
images Metrics Proposed RDH Video 1 Video 2 Zhang et al [17] Video 1 Video 2
Lena Capacity bpp 127548 0.1621 129924 0.1652 126810 0.1612 129150 0.1642
PSNR(dB) 35.52 35.57 33.06 33.21
Barbara Capacity bpp 127548 0.1621 129924 0.1652 126810 0.1612 129150 0.1642
PSNR(dB) 35.63 35.44 33.34 33.18
Baboon Capacity bpp 127548 0.1621 129924 0.1652 126810 0.1612 129150 0.1642
PSNR(dB) 35.72 35.52 33.47 33.09
(a)
Volume: 06 Issue: 01 | Jan 2019 www.irjet.net p-ISSN: 2395-0072
© 2019, IRJET | Impact Factor value: 7.211 | ISO 9001:2008 Certified Journal
| Page 1083
[image:8.595.83.552.46.268.2](c)
Fig 10: PSNR comparison of Proposed and Zhang et.al method (a) Secret image ‘Lena’ (b) Secret image ‘Barbara’ (c) Secret image ‘Baboon’
The capacity and embedding rate of the proposed method was slightly greater than the traditional Zhang et. al method [17]. But the PSNR of the proposed method was around 2dB greater than the Zhang et. al method. Fig 10 shows the graphical comparison of proposed method and Zhang et.al method on two test videos ‘Video 1’ and ‘Video 2’. For a particular video frame, the PSNR slightly changes for change in secret image. The next section shows the Conclusion of the proposed work.
IV. Conclusion
This paper proposed a Reversible data hiding on video frames using Matched Neighbour Predictor (MNP). The MNP predictor chooses three consecutive frames and select second frame as reference frame. The distortion is measured between first/third frame and second frame. The distortion level will decide whether the data can be embedded in the centre pixel or not. If the distortion is greater than the threshold, then data cannot be embedded in the centre of the neighbourhood. The proposed algorithm was implemented using MATLAB and the performance was verified using the metrics such as embedding rate and PSNR. The proposed method provides a high quality marked video frames when compared to the traditional Zhang et. al method. i.e. the proposed method provides a PSNR 2dB greater than the conventional Zhang et. al method.
REFERENCES
[1] X. Zhu, J. Ding, H. Dong, K. Hu and X. Zhang, “Normalized Correlation-Based Quantization Modulation for Robust Watermarking,” IEEE Trans. Multimedia, vol. 16, no. 7, pp. 1888-1904, Nov. 2014.
[2] A. Ahmad, M. Pant, and C. Ahn, “SVD based fragile watermarking scheme for tamper localization and self-recovery,” International Journal of Machine Learning and Cybernetics, vol. 7, no. 6, pp. 1225-1239, 2016.
[3] A. Khan, A. Siddiqa, S. Munib, and S. A. Malik, “A recent survey of reversible watermarking techniques,” Information sciences, vol. 279, pp. 251–272, 2014.
[4] B. Li, M. Wang, J. Huang, and X. Li, “A new cost function for spatial image steganography,” IEEE International Conference on Image Processing (ICIP), pp. 4206-4210, 2014.
[5] M. Asikuzzaman and M. R. Pickering, “An Overview of Digital Video Watermarking,” IEEE Trans. Circuits System and Video Technology, vol., no. 99, pp. 1-1. doi: 10.1109/TCSVT.2017.2712162.
[6] Z. Ni, Y. Shi, N. Ansari, and S. Wei, “Reversible Data Hiding,” IEEE Trans. Circuits System and Video Technology, vol. 16, no. 3, pp. 354 - 362, 2006.
[7] P. Tsai, Y.C. Hu, and H.L. Yeh, “Reversible Image Hiding Scheme Using Predictive Coding and Histogram Shifting,” Signal Processing, vol. 89, pp. 1129-1143, 2009.
Volume: 06 Issue: 01 | Jan 2019 www.irjet.net p-ISSN: 2395-0072
© 2019, IRJET | Impact Factor value: 7.211 | ISO 9001:2008 Certified Journal
| Page 1084
[9] X. Li, B. Yang, and T. Zeng, “Efficient Reversible Watermarking Based on Adaptive Prediction-Error Expansion and Pixel Selection,” IEEE Trans. Image Processing, vol. 20, no. 12, pp. 3524-3533, Dec. 2011.
[10] B. Ou, X. Li, Y. Zhao, R. Ni and Y. Q. Shi, ”Pairwise Prediction-Error Expansion for Efficient Reversible Data Hiding,” IEEE Trans. Image Processing, vol. 22, no. 12, pp. 5010-5021, Dec. 2013.
[11] C. H. Chou and K. C. Liu, “A perceptually tuned watermarking scheme for color images,” IEEE Trans. Image Processing, vol. 19, no. 11, pp. 2966-2982, Nov. 2010.
[12] Y. He, W. Liang, J. Liang, and M. Pei, “Tensor decomposition based color image watermarking,” Procedings of SPIE, vol. 9069, pp. 90690U- 90690U-6, Jan. 2014.
[13] M. Asikuzzaman, M. J. Alam, A. J. Lambert, and M. R. Pickering, “Imperceptible and robust blind video watermarking using chrominance embedding: A set of approaches in the DT CWT domain,” IEEE Trans. Information Forensics and Security, vol. 9, no. 9, pp. 1502-1517, Sep. 2014.
[14] M. Asikuzzaman, M. J. Alam, A. J. Lambert, and M. R. Pickering, “A blind and robust video watermarking scheme using chrominance embedding,” International Conference on Digital lmage Computing: Techniques and Applications, pp. 1-6, Nov. 2014.
[15] M. Kutter and S. Winkler, “A vision-based masking model for spread spectrum image watermarking,” IEEE Trans. Image Processing, vol. 11, no. 1, pp. 16-25, Jan. 2002.
[16] P. Bao and X. Ma, “Image adaptive watermarking using wavelet domain singular value decomposition,” IEEE Trans. Circuits and Systems for Video Technology, vol. 15, no. 1, pp. 96-102, Jan. 2005.