© 2019, IRJET | Impact Factor value: 7.211 | ISO 9001:2008 Certified Journal | Page 7294
Experimental Study on Utilization of Industry Waste (Red Mud) in
Concrete
Mr. Amol B. Sawant
1, Niraj S. Parsekar
2, Nilesh Sadashiv Mane
31
Assistant Professor, Civil Engineering, KITCoE, Kolhapur, Shivaji University, Kolhapur
2Student, Final Year Civil Engineering, KITCoE, Kolhapur
3
Student, Final Year Civil Engineering, KITCoE, Kolhapur
---***---Abstract
-
Sustainable industrial development causesaccumulation of heaps of waste disturbing the natural mechanism. The waste can be sometime best alternative for conventional; material like red mud. Red mud is industrial waste obtained as by product from Bayer method of aluminum extraction in this process, alkaline digestion of 2.5 T of bauxite affords alumina & 105 T of red mud. The average 4 million tons of red mud produces per annum, this amount composed of Fe & Ti oxides behaving as chemically inert material with variable percentage of nominal SiO2, Al2O3& Na2O3 which are partly present in cement. This paper covers significance of neutralized red mud over Portland cement by partial replacement of cement up to certain extent.
1.
INTRODUCTION
Cement in the general sense of the word, can be described as a material with an adhesive and cohesive properties which make it capable of bonding mineral fragments into a compact mass. This definition embraces a large variety of cementing material.
For constructional purposes the meaning of the term cement is restricted to the bonding materials used with stones, sand, bricks blocks etc. cement is the most important material in structural constructions as it is used at different stages of construction as it is used at different stages of construction in the form of mortar or concrete.
1.1.
Cement Production
With 502 million tonnes per year (mtpa) of cement production capacity as of 2018, India is the second largest cement producer in the world. The cement production capacity is estimated to touch 550 MT by 2020. Of the total capacity, 98% lies with the private sector and the rest with the public sector. The top 20 companies account for around 70 % of the total production. In FY19, cement demand is expected to grow by 7-8 per cent.
A total of 210 large cement plants together account for 410 million tonnes of installed capacity in the country, while 350 mini cement plants make up the rest. Of the total 210 large cement plants in India, 77 are located in the states of Andhra Pradesh, Rajasthan and Tamil Nadu. Cement production in India increased from 230.49 million tonnes in 2011-12 to 297.56 million tonnes in 2017-18
Chart 1: Cement demand in year per capita
Note:*As per CRISIL, ^CAGR is up ot FY18, October 2018
Source: Media sources, Aranca Research, CRISIL, CARE Ratings, Ultratech Cement
2.
INDUSTRIAL SOLID WASTE AND ITS
PRODUCTS
The nation’s solid wastes are increasing, posing a severe threat to the environment.
2.1.
Red Mud
The red mud is one of the major solid wastes coming from Bayer process of alumina production. At present about 3 million tons of red mud is generated annually, which is not being disposed or recycled satisfactorily.
The conventional method of disposal of red mud in ponds has often adverse environmental impacts as during monsoons, the waste may be carried by run-off to the surface water courses and as a result of leaching may cause contamination of ground water: Further disposal of large quantities of Red mud dumped, poses increasing problems of storage occupying a lot of space.
2.2.
Fly-ash
© 2019, IRJET | Impact Factor value: 7.211 | ISO 9001:2008 Certified Journal | Page 7295 tons of flyash is produced per year by 60 Thermal plants
located in different parts of the country.
The common environmental pollution problems created by disposal of flyash, besides air and water pollution are wastages of large tracts of land which otherwise could be utilized for useful purposes. It has been estimated that a one thousand megawatt station, using coal of calorific value of 3500 kilo cal per kg and ash content of 40-50 percent for an operational period of 30 years requires about 500 acres of land.
2.3.
Phosphogypsum
Phosphogypsum is the waste generated by the phosphoric acid, ammonium phosphate and hydrofluoric acid manufacturing plants.
There is an accumulation stock or more than 10 million tons of Phosphogypsum at different at different plant sites. The fluoride content of gypsum generated is 0.7-1.5% which is the source of land and water pollution.
2.4.
Steel and furnace slags
About 35 million tons of steel and blast furnace slags are produced in the country during manufacture of iron and steel.
[image:2.595.38.286.490.729.2]It has been estimated that the quantity of slags will increase to about 60 million tones around 2000. The large quantity of slags generated in plants is dumped on land nearby, which not only results in wastages of land but also causes surface and ground water pollution.
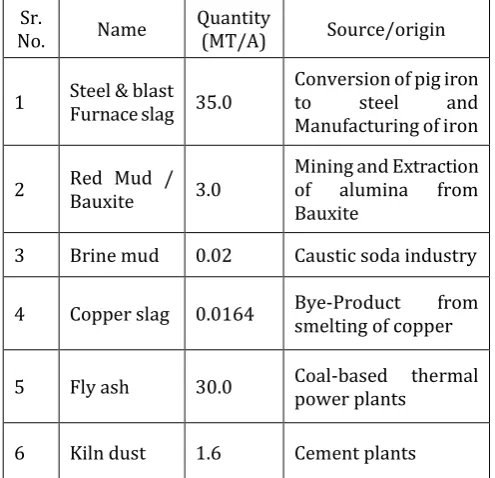
Table 2: Sources and Quantum of Generation of some Major Industrial wastes (As in 1992)
Sr.
No. Name Quantity (MT/A) Source/origin
1 Steel & blast Furnace slag 35.0 Conversion of pig iron to steel and Manufacturing of iron
2 Red Mud / Bauxite 3.0 Mining and Extraction of alumina from Bauxite
3 Brine mud 0.02 Caustic soda industry
4 Copper slag 0.0164 Bye-Product smelting of copper from
5 Fly ash 30.0 Coal-based thermal power plants
6 Kiln dust 1.6 Cement plants
Sr.
No. Name Quantity (MT/A) Source/origin
7 Lime sludge 3.0
Sugar, paper, fertilizer, tanneries, soda ash &calcium carbide industries
8 Mica Scraper
waste 0.005 Mica Mining areas
9 Phosphogypsum 4.5 Phosphoric acid plant, Ammonium phosphate
3.
REVIEW OF BAUXITE WASTE IN
CONSTRUCTION:
3.1.
Geotechnical Properties of Red Mud
Dr. K. K. Jain, S. K. Singh & Laljee Sahu, Institute of Technology. B. H. U. Varanasi, have studied geotechnical properties of Red mud and red mud lime mixtures.
Red mud obtained from Hindalco Industries Limited, Renukoot, U. P. has been used for their study. The properties of which were – as under:-
Grain size distribution has 12 % of clay, 80 % of silt and 8 % of sand sizes.
Specific Gravity 3.15
Optimum moisture content : 25.6 percent Maximum dry density: 1.619 gm/cm3.
Chemical composition shown that Fe2O3 - 35%, Al2O3 – 19%, TiO2 – 20%, SiO2 – 8 %, Na2O – 5%, CaO – 3 %, and loss of ignition 10 %.
3.2.
Use of Red Mud in mortar for masonry and
plastering
Dr. R. P. Joshi, V. G. M. Desai and B. S. Setty, Gogate Institute of Technology, Belgaum, Karnataka, in their paper on “The use of locally available materials for low cost housing” has studied the use of red mud as mortar and as a plastering material and its suitability for bricks.
3.2.1.Suitability As Mortar
The plasticity characteristics with cohesion suggested that the red mud could be suitable for use as mortar for plastering as well as for binding brick work. To check this, following tests were evolved and conducted.
3.2.2.Shear Test
© 2019, IRJET | Impact Factor value: 7.211 | ISO 9001:2008 Certified Journal | Page 7296 a universal testing machine, with the force applied on the
central protruded brick till the mortar sheared off.
3.2.3.Tension Test
To measure induced tension the mortar could withstand, the bricks were jointed with mortar. The bricks were connected to the spring balance and loaded, until failure due to tension occurred.
The specimens tested with plain soil and cement stabilized soil. (With cement up to 6 %) showed very poor shear strength. However, the results of shear strength and tensile strength in the case of soil stabilized with sand resulted in a good mortar.
The rate analysis of sand stabilized soil mortar and its comparison with the cement mortar rates showed that a large economy to the extent of 80% would be achieved in using the stabilized soil as mortar.
The study showed that the mortar could safely be used for load bearing and partition walls which are not directly exposed to rain water.
3.2.4.Suitability As A ‘Plastering Material
The adhesiveness of clayey soil in presence of water led to the investigation.
An adequate quantity of water was added to the plain red mud soil and mixed thoroughly to obtain a uniform mix. The plaster was applied on a set of three bricks. After obtaining a smooth surface the set up was left to dry outside. Thus subjecting, it to the action of heat and wind. The resistance to rain water was tested by simulating a water shower to rain water.
After subjecting it to above weathering agents, it was seen that the plaster made of plain red mud soil and with 2-6% of cement as additives failed by giving out cracks throughout. However, once again the soil stabilized with sand and straw retained with a smooth surface. The above results were confirmed by applying the plaster of all types of the wall surfaces.
The cost analysis of the sand and straw stabilized soil was made and it was seen that a saving of 60-75% could be achieved by the use of stabilized soil plaster instead of cement mortar.
Another noteworthy factor observed was since, the red soil is of alkaline nature, it shows resistance to termite attack and as such it is extremely suitable for use as mortar and also as a plastering material.
3.3.
Suitability for Bricks
The bricks of size 10 cm x 15 cm x 25 cm prepared by using a simple mould and sun dried were tested for strength. But it was found that plain red soil stabilized with cement, sand and straw failed to give the required strength. Hence, it was inferred that the waste red mud soil renders itself unsuitable for using it in the manufacture of bricks.
Thus the study was useful in identifying the waste soil as an effective and economical mortar and a plaster material. However, the suitability of red mud for rammed earth wall is being studied.
4.
USE OF NEUTRALIZED RED MUD AS A
PARTIAL REPLACEMENT OF CEMENT IN
CONCRETE
4.1.
Aim of neutralization of Red mud
It is found from digital ph meter, that the ph of red mud procured from site is alkaline with ph value ranges from 10 to 11.58. Since the alkalinity is determined to the life of cement and concrete, they propose to reduce the alkalinity of red mud (pH=10.58), so that it can be used as cement replacement material and may improve the strength characteristics of cement and concrete.
Commercially available of normality in hydrochloric acid has been used for present neutralization process, because it enriches the silicon oxide and aluminum oxide content of red mud and it also eliminates harmful sodium oxide.
4.1.1.Neutralization of Red Mud-Experimental Procedure
About 5 kg of red mud was mixed with 10 liters of tap water in an aluminum container, and is stirred continuously for about half an hour to make the solution homogeneous. The acid was slowly mixed in the solution till pH value of solution becomes 7.0.
After neutralization the container was kept at room temperature for settlement of solids for about 5 hours. The water with other dissolved materials was decanted and the settled red mud was sundried first and then oven dried. The material was cooled in oven up to room temperature then taken out from it. This material was then reduced into powder by hand.
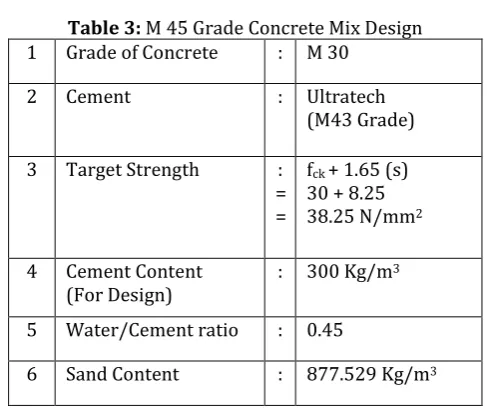
[image:3.595.311.555.554.758.2]4.2.
Design Mix Concrete of Grade M 45
Table 3: M 45 Grade Concrete Mix Design 1 Grade of Concrete : M 30
2 Cement : Ultratech
(M43 Grade)
3 Target Strength : = =
fck + 1.65 (s) 30 + 8.25 38.25 N/mm2
4 Cement Content
(For Design) : 300 Kg/m
3
5 Water/Cement ratio : 0.45
© 2019, IRJET | Impact Factor value: 7.211 | ISO 9001:2008 Certified Journal | Page 7297 7 Coarse Aggregate
Content : 1408.664 Kg/m
[image:4.595.34.556.46.682.2]3
Table 4: M 45 Grade Final Mix Proportion and Ratio Final Mix Proportion-
Cement Sand Aggregate Coarse Water Chemical
300.000 Kg/m3
877.529 Kg/m3
1408.664 Kg/m3
135 Kg/m3
1 % of Cement by Weight
1 2.925 4.969 0.45
4.3.
Identification marking for different %
[image:4.595.300.554.47.683.2]replacement of cement by Neutralized Red
Mud (NRM)
Table 5: ID Marking Neutralized Red Mud (NRM) Concrete
ID Mark Description
A1-0% Conventional Concrete (0% Replacement of Cement by NRM)
A2-5% NRM Concrete (5% Replacement of Cement by NRM)
A3-10% NRM Concrete (10% Replacement of Cement by NRM)
A4-15% NRM Concrete (15% Replacement of Cement by NRM)
A5-20% NRM Concrete (20% Replacement of Cement by NRM)
5.
RESULT ANALYSIS
5.1.
Tests on Blended Cement (CEMENT + NRM)
Five types test samples with cement replacements of 0%, 10%, 15% and 20% by equal weight of neutralized red mud were prepared and the tests for physical properties were carried out. The results obtained are tabulated below The cement and red mud (neutralized) passing 1.18mm sieve was mixed thoroughly to get uniform, homogeneous mixture.
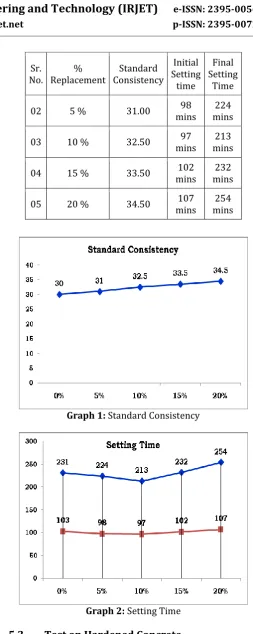
Table 6: Variations in Standard Consistency, Initial Setting and Final Setting
Sr.
No. Replacement % Consistency Standard
Initial Setting
time
Final Setting
Time
01 0 % 30.00 mins 103 mins 231
Sr.
No. Replacement % Consistency Standard
Initial Setting
time
Final Setting
Time
02 5 % 31.00 mins 98 mins 224
03 10 % 32.50 mins 97 mins 213
04 15 % 33.50 mins 102 mins 232
05 20 % 34.50 mins 107 mins 254
Graph 1: Standard Consistency
Graph 2: Setting Time
5.2.
Test on Hardened Concrete
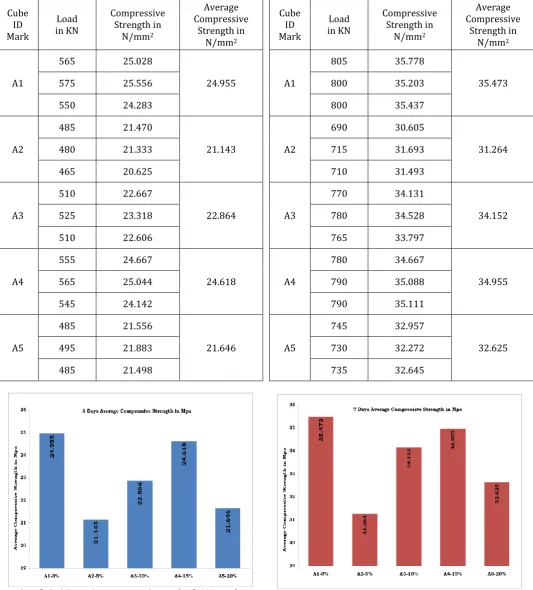
[image:4.595.39.288.332.511.2]© 2019, IRJET | Impact Factor value: 7.211 | ISO 9001:2008 Certified Journal | Page 7298 Table 7: 3 Days Compressive Strength of M30 grade
concrete design mix Cube
ID Mark
Load in KN
Compressive Strength in
N/mm2
Average Compressive
Strength in N/mm2
A1
565 25.028
24.955
575 25.556
550 24.283
A2
485 21.470
21.143
480 21.333
465 20.625
A3
510 22.667
22.864
525 23.318
510 22.606
A4
555 24.667
24.618
565 25.044
545 24.142
A5
485 21.556
21.646
495 21.883
485 21.498
Graph 3: 3 Days Compressive Strength of M30 grade concrete design mix
Table 8: 7 Days Compressive Strength of M30 grade concrete design mix
Cube ID Mark
Load in KN
Compressive Strength in
N/mm2
Average Compressive
Strength in N/mm2
A1
805 35.778
35.473
800 35.203
800 35.437
A2
690 30.605
31.264
715 31.693
710 31.493
A3
770 34.131
34.152
780 34.528
765 33.797
A4
780 34.667
34.955
790 35.088
790 35.111
A5
745 32.957
32.625
730 32.272
735 32.645
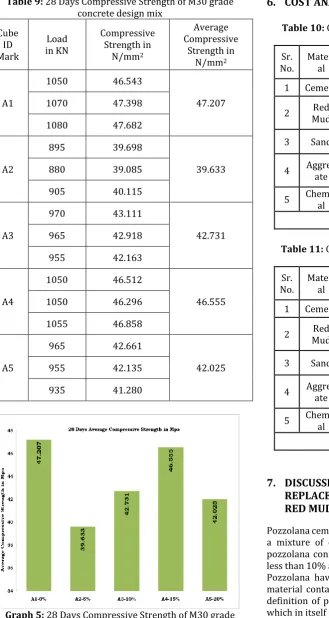
© 2019, IRJET | Impact Factor value: 7.211 | ISO 9001:2008 Certified Journal | Page 7299 Table 9: 28 Days Compressive Strength of M30 grade
concrete design mix Cube
ID Mark
Load in KN
Compressive Strength in
N/mm2
Average Compressive
Strength in N/mm2
A1
1050 46.543
47.207
1070 47.398
1080 47.682
A2
895 39.698
39.633
880 39.085
905 40.115
A3
970 43.111
42.731
965 42.918
955 42.163
A4
1050 46.512
46.555
1050 46.296
1055 46.858
A5
965 42.661
42.025
955 42.135
935 41.280
Graph 5: 28 Days Compressive Strength of M30 grade concrete design mix
[image:6.595.41.371.104.723.2]6.
COST ANALYSIS
Table 10: Cost Analysis of M30 Grade Conventional concrete
Sr.
No. Material Quantity Rate in Rs. Unit Amount
1 Cement 5.16 320 Bags 1651.20
2 Mud Red 0 3.1 Kg 0
3 Sand 0.526 1987.63 Cum 1045.50
4 Aggregate 0.844 581.88 Cum 491.11
5 Chemical 2.58 151.25 Liter 390.23
TOTAL 3578.04
Table 11: Cost Analysis of M30 NRM concrete (15% Replacement)
Sr.
No. Material Quantity Rate in Rs. Unit Amount 1 Cement 4.36 320 Bags 1395.20
2 Mud Red
38.7 3.1 Kg 119.97
3 Sand 0.526 1987.63 Cum 1045.49
4 Aggregate
0.844 581.88 Cum 491.11 5 Chemical 2.1801 151.25 Liter 329.74
TOTAL 3381.51
7.
DISCUSSION ON EFFECT OF PARTIAL
REPLACEMENT OF CEMENT BY NEUTRALIZED
RED MUD
© 2019, IRJET | Impact Factor value: 7.211 | ISO 9001:2008 Certified Journal | Page 7300 First the physical and chemical analysis of a red mud is
carried out. Then the effect of the presence of different percentages of neutralized red mud in cement and cement concrete were studied with respect to following properties.
1. Test on cement
a. Standard consistency of cement b. Initial setting time of cement c. Final setting time of cement 2. Test on Hardened Concrete
a. Compressive strength of neutralize
7.1.
Effect of Neutralized Red Mud on Standard
Consistency of Cement
Graph 1 shows the variation of standard consistency with different percentage of neutralized red mud in cement. The standard consistency of ordinary Portland cement is 30.00. It is observed from the table 6, that the standard consistency increases with increase in neutralized red mud content. The affinity for water increases with increase in neutralized red mud content in cement.
The affinity of water increases by 2.50 %, 5.50 %, 8.00 % & 10.5 % with 5%, 10%, 15% and 20% of replacement of cement by neutralized red mud respectively, compared with that of water required for standard consistency of ordinary Portland cement.
In general it is observed that with the increase in neutralized red mud content in the mix the water required for standard consistency increases and this increased requirement of water shows almost a linear relationship with standard consistency.
This increase may be due to the fact that the neutralized red mud being slightly lighter in weight has finer particles and occupies more volume which needs more water for the same consistency.
7.2.
Effect of Neutralized Red Mud on Initial
Setting Time of Cement
Graph 2 shows the variation of the initial setting time with different percentage replacement of cement by neutralized red mud in cement and the values can be observed from the table
As per IS: 269-1976 specification the minimum initial setting time for ordinary Portland cement is 30 minutes. The initial setting time for the cement used in the present studies is 90 minutes. It is observed from the table no. The initial setting time for 5% and 10% replacement by neutralized red mud gradually reduces whereas for 15% of replacement by neutralized red mud the initial setting is nearly the same as that of ordinary Portland cement. Future increase in neutralized red mud (20%) increases the initial setting time.
7.3.
Effect of Neutralized Red Mud on
Compressive Strength
With reference to the tables and graphs it is interesting to note that there was a decrease in the compressive strength of the design mix for the initial % replacement of cement (i.e. for 5% replacement). After that there was an increase in the compressive strength with the increase in the % of NRM up to 15 % replacement of cement. Further increase in the % of NRM reduces the compressive strength of the design mix concrete.
Table 12: 28 days Compressive strength 28 days Compressive strength of the M 30 grade concrete design mix
Target : 38.250 N/mm2
Conventional Concrete
(0 % replacement) : 47.207 N/mm2 NRM Concrete
(15% replacement) : 46.555 N/mm2 NRM Concrete
(20% replacement) : 42.025 N/mm2
8.
CONCLUSION
From this experimental study following points can be drawn: 1. After testing of blended cement samples (0% to 20 % replacement of Cement by NRM) with an increment of 5 %, it can be said that the optimum use of NRM is 15% as a partial replacement of cement by NRM. 2. The cost of M 30 grade NRM Concrete (i.e. 15 %
Replacement) is around 5.81 % less than the Conventional Concrete, with an increase of 21.712 % in the 28 days Compressive strength
REFERENCES
[1] New construction materials in India, RMP Corrugated roofing Sheets’, Civil Engineering and construction Review 2002.
[2] Cement News, ‘Cement Production’, International cement review, August 2009.
[3] Dr. K. K. Jain, S. K. Singh and Laljee Sahu, ‘The Geo Technical properties of Red Mud and Red Mud Lime Mixtures’, Indian Highways, October 2001.
[4] Dr. R. P. Joshi, V.G.M. Desai and B. S. Setty, ‘The use of locally available materials for low cost housing’, Proceeding of National seminar on ‘Recent advances in low cost building material and technology’, Anantapur 1992.
[5] Dr. S. K. Chopra, ‘Seminar on cement and its substitute’, Key note address.
[6] Dr. Y. P. Kakar, ‘Management of Industrial Solid Waste Need for Recycling’, Civil Engineering & Construction Review, February 1998
© 2019, IRJET | Impact Factor value: 7.211 | ISO 9001:2008 Certified Journal | Page 7301 cements prepared with the addition of red mud’,
Cimento ve Beton Dunyasi (1996), 1(3), 17-21
[8] J. Pera, R. Boumaza and J. Ambroise, ‘Development of a pozzolanic pigment from red mud Cement and Concrete Research’, Volume 27, Issue 10, October 1997, Pages 1513-1522.
[9] Mohan Rai, M. P. Jaising, CBRI Rookee, ‘Advances in Building Materials and Construction’
[10] P.E. Tsakiridis, S. Agatzini-Leonardou and P. Oustadakis, ‘Red mud addition in the raw meal for the production of Portland cement clinker’, Journal of Hazardous Materials, Volume 116, Issues 1-2, 10 December 2004, Pages 103-110.
[11] Paramguru, R.K., Rath, P.C., Misra, V.N., ‘Trends in red mud utilization - A review’, Miner. Process Extr. Metal. Rev. 26(1), (2005), 1-29.
[12] Venkatarama Reddy, B. V., Rao, S. M. and Arun Kumar, M. K., ‘Characteristics of stabilized mud blocks using ash modified soils’, Indian Concrete Journal, 2003, 77, 903– 911.
[13] Yogananda, M. R. and Jagadish, K. S., ‘Possolanic properties of rice husk ash, burnt clay and red mud’, Build Environ, 198