© 2019, IRJET | Impact Factor value: 7.211 | ISO 9001:2008 Certified Journal
| Page 1072
An Enhanced Grey Wolf Optimization and Random Forest Techniques
for Predicting Chronic Hepatitis
Parameswari
1, Samraj Lawrence
2,Manohar
3, Malaiarasan
41
PG Scholar, Department of Computer Science and Engineering, Francis Xavier Engineering College,
Tirunelveli, India.
2
Associate Professor, Department of Computer Science and Engineering, Francis Xavier Engineering College,
Tirunelveli, India.
3,4
Assistant Professor, Department of Computer Science and Engineering, Francis Xavier Engineering College,
Tirunelveli, India.
---***---Abstract - Hepatitis is one of the dangerous disease compare HIV [2], still the patient’s cant able to notice any symptoms of hepatitis disease in early stages, when patients noticed symptoms; the disease could be on advanced stage. Based on the 2017 medical survey fifty lakh people affected hepatitis disease in Chennai. Cost plays a major role in hepatitis treatment, and traditional biopsy also has some issues. The proposed algorithms Grey Wolf Optimization and Random Forest Classification to overcome drawbacks of biopsy, low cost and high accuracy.
Key words: Biopsy, Gwo, Hepatitis, optimization, prediction, Rfc.
1. INTRODUCTION
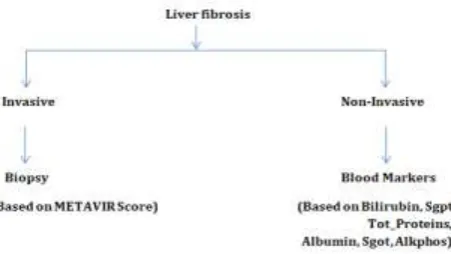
[image:1.595.185.411.541.668.2]Now a day’s machine learning approaches such as regression, classification and optimization are used in prediction, classification and act as diagnostic tools. Machine learning approaches used in various field especially in medical field, the machine learning techniques to overcome the invasive methods drawbacks [10] and detection of disease severity[1][2][3]. Hepatitis implies aggravation of the liver. Viral hepatitis is a noteworthy general wellbeing the issue around the world. Distinctive infections including hepatitis A, B, C, D and E infections cause viral contaminations of the human liver. Hepatitis B and C are comparable sorts of liver contamination, which spread for the most part through blood and blood items [1]. Liver biopsy conveys potential confinements including inspecting mistakes furthermore, inter-observer variation [2]. Biopsy is one of the gold standards [4] but biopsy is one of the invasive methods and it also have sampling error and complicated calculation, to overcome these disadvantages , propose machine learning techniques. Machine learning techniques are one of the Non-Invasive methods. Based on the METAVIR scoring system the biopsy report evaluated but machine learning is in-direct method , in this paper following features are used such as albumin, tot-protein, bilirubin, A/g_Ratio, Sgpt, Sgot, Alkphos. The following figure 1 explains the comparison of the both invasive and non-invasive methods for finding liver fibrosis. Biopsy is non-invasive and direct method based on METAVIR scoring system. Machine learning approaches based on blood markers and indirect method.
Figure 1. Comparison chart for liver fibrosis methods.
2. RELATED WORK A. PRE-PROCESSING
© 2019, IRJET | Impact Factor value: 7.211 | ISO 9001:2008 Certified Journal
| Page 1073
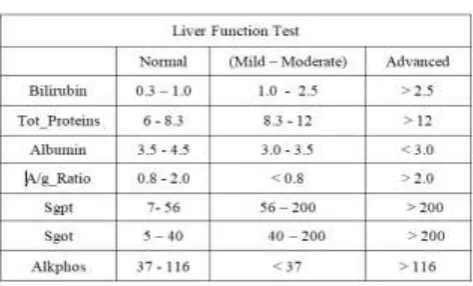
[image:2.595.180.417.125.268.2]table. Table 1 explain the liver function test. Based on the table 1 the patient’s data are divided into three categories that is normal, mild-moderate and Advanced stage of liver fibrosis.
Table 1: Liver Function Test
B. STATISTICAL FEATURE EXTRACTION
In statistical feature extraction data were analysed using Mat-Lab software and Excel while software performed the optimization and classification learning. That data should reported as mean and standard deviation values. The relationship between the two larger variables and the presence of significance of fibrosis has been analysed by using the KRUSKAL-WALLIS test and one way ANOVA table [2].
We implemented several optimization and classification techniques such as GWO, ANN, regression, Svm, random forest. The ROCs accuracy and predictive values were evaluate the performance of both training and test data sets.
C. GREY WOLF OPTIMIZATION
The GWO calculation imitates the authority chain of command and lead instrument of Wolf’s package. In these package four sets of wolves utilized for reproducing the initiative chain of importance, such as Alpha (α), Beta (β), Omega (ω) and Delta (δ). The GWO has been successfully applied for solving various engineering optimization problems [11].
Pseudo Code For GWO Algorithm Is As Follows
1: Generate initial search agents Gi (i=1, 2,…., n)
2: Initialize the vector’s a, A and C
3: Estimate the fitness value of each hunt agent Gα=the best hunt agent
Gβ=the second best hunt agent Gδ=the third best hunt agent
4: Iter=1 5: repeat
6: for i=1: Gs (grey wolf pack size)
Renew the location of the current hunt agent. End for
7: Estimate the fitness value of all hunt agents 8: Update the value of Gα, Gβ, Gδ
9: Update the vectors a, A and C 10: Iter=Iter+1
11: until Iter>= maximum number of iterations {Stopping criteria} 12: output Gα
End
D. RANDOM FOREST CLASSIFIER
© 2019, IRJET | Impact Factor value: 7.211 | ISO 9001:2008 Certified Journal
| Page 1074
Irregular Forest is a managed learning calculation. Would already be able to see from its name, it makes a backwoods and makes it by one way or another arbitrary. The "woodland" it manufactures, is a group of Decision Trees, more often than not prepared with the "stowing" technique. The general thought of the packing technique is that a mix of learning models builds the general outcome.
To state it in basic words: Random woodland constructs various choice trees and combines them to get a progressively exact and stable forecast.
One major favourable position of random forest is that it tends to be utilized for both order and relapse issues, which frame the lion's share of current machine learning frameworks. Talk about irregular woods in characterization, since order is in some cases considered the building square of machine learning. Underneath can perceive how a random forest would look like with two trees: The figure 4 shows the simple random forest classification graphical representation.
[image:3.595.75.521.249.391.2]3. RESULTS AND DISCUSSION
Figure 2: Pre-Processing
In this figure 2 explain the pre-processing of the features such as bilirubin, proteins, albumin, alkphos and display the minimum and maximum value of the features based on the liver function test table 1. Red colour and green colour dotted lines indicates the maximum and minimum level.
[image:3.595.194.403.469.764.2]© 2019, IRJET | Impact Factor value: 7.211 | ISO 9001:2008 Certified Journal
| Page 1075
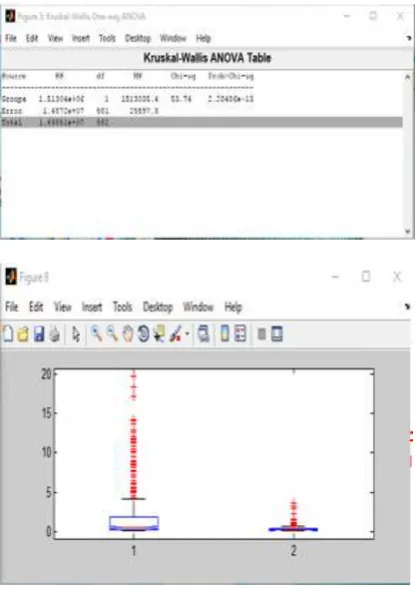
Figure 3 explain the statistical analysis using kruskal-Wallis test and one way ANOVA table. These calculations done by chi square distribution test. The kruskal-wallis test used for finding the difference between two large data sets.
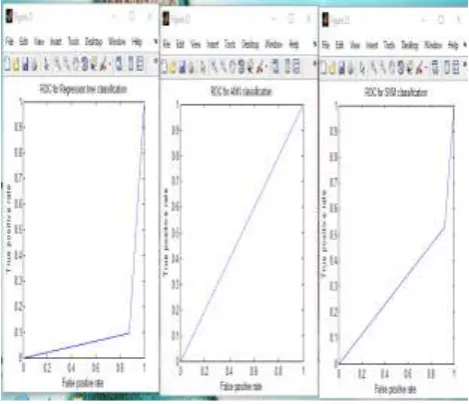
[image:4.595.199.399.382.565.2]Figure 4: Roc curves for CART, ANN, SVM.
Figure 4 explain the Roc curves the true positive rate is plotted in function of the false positive rate for different cut off points. Compare three classifier CART techniques gives the high accuracy than SVM and ANN.
Figure 5 : Comparison Accuracy Between Random Forest, ANN, SVM And Regression.
[image:4.595.69.535.656.721.2]In figure 5 represents the comparison accuracy between the Random forest, regression, ANN and SVM classifier. Following table 2 explain the accuracy rate, error rate and AUC. The performance of the machine learning algorithms were analysed with the help of confusion matrix parameters where the accuracy is considered as a valid parameter to measure the performance.
Confusion matrix Accuracy rate Error rate AUC
Regression tree 89.8973 10.1027 0.1066
Support vector 60 40 0.3032
Neural Network 71.5517 28.4483 0.5000
Random Forest 92.5041 7.4959 0.0301
4. CONCLUSION
© 2019, IRJET | Impact Factor value: 7.211 | ISO 9001:2008 Certified Journal
| Page 1076
parameters (bilirubin, alkphos, albumin, SGPT,SGOT,) observed to be the most imperative highlights in the forecast of the propelled fibrosis as they factually have a noteworthy relationship (P-esteem < 0.0001) and acknowledged connection coefficients ( jr j>0.1) with the nearness of advanced liver fibrosis as appeared in the outcomes. The proposed models could be utilized as an adequate, safe, and ease substituting for foreseeing propelled fibrosis as opposed to generally unsafe elective instruments, (for example, the liver biopsy) in unending hepatitis-infected patients.
5. REFERENCE