A Multi-objective Approach to Implement an
Integrated Management System: Quality,
Security, Environment
Ahmed Badreddine
∗Taieb Ben Romdhane
∗∗Nahla Ben Amor
∗Abstract—This paper proposes a partial implemen-tation of an integrated Quality, Security and Environ-ment manageEnviron-ment system [1] to deal with the defini-tion of an appropriate global management plan. This implementation is based on the multi-objective influ-ence diagrams [12] which are one of the most com-monly used graphical decision models for reasoning under uncertainty with multiple objectives.
Keywords: Integrated management system, Risk man-agement, Multi-objective influence diagram, Bow tie.
1
Introduction
The evolution of the current industrial context and the in-creasing of the competition pressure, led the companies to adopt new concepts of management. That’s why the im-plementation and certification of quality (ISO 9001) [5], environmental (ISO 14001) [6] and occupational health and safety (OHSAS 18001) [13] systems have been an important activity for many organizations and have be-come a widespread phenomenon around the world. The major problem with these three management systems is that they were proposed separately and thus their com-bination is not an obvious task since they have common and confused procedures. Generally, parallel manage-ment systems are used, leading to separate and indepen-dent implementations of each system. Such implemen-tations suffer from several weaknesses since they require many duplicate management tasks, such as written pro-cedures, checking, control forms and other paper work suggested by the three standards. Hence, proposing an integrated management system (IMS) including quality, environment and safety management systems also known as QSE management system have drawn the attention of both academics and practitioners. These researches studied the integration of the three systems from various viewpoints, including examining the possibility of inte-grating, analyzing the potential benefits of it and explor-ing possible ways and criteria for its success [10][8][20][9].
∗LARODEC, Institut Sup´erieur de Gestion de Tunis, 41
Av-enue de la libert´e, 2000 Le Bardo, Tunisie. **Institut National des Sciences Appliqu´ees et de la Technologie, Centre Urbain Nord BP 676 - 1080, Tunisie. Email: [email protected], [email protected], [email protected]
Nevertheless, a few studies have developed methodologies and approaches to implement an IMS. Recently, we have proposed a new process based approach to implement an IMS, on the basis of three aspects used as integrated fac-tors namely the process approach, the risk management
and aglobal monitoring system[1]. This approach is com-posed of three phases: thePlanphase, theDophase and theCheck and theAct phases.
This paper proposes an implementation of the most im-portant part of the plan phase, consisting in the defi-nition of an appropriate global management plan QSE. This implementation is based on the multi-objective in-fluence diagrams (MIDs)[12] which are one of the most commonly used graphical decision models for reasoning under uncertainty. More precisely, we propose to map existing bow ties which are a very popular and diffused risks analysis tool into a MID, then to evaluate it in order to generate an appropriate global management plan.
The remainder of this paper is organized as follows: Sec-tion 2 presents a brief recall on the new process based approach for implementing an IMS. Section 3 proposes a multi-objective approach to define an appropriate global management plan QSE. Indeed, a transformation algo-rithm from existingbow ties into a multi-objective influ-ence diagrams will be proposed.
2
A brief recall on the new process based
approach for implementing an IMS
This section presents a brief recall on the new process based approach for implementing an integrated Quality, Security and Environment management system. This approach is based on three integrated factors [1]: Risk management to increases the compatibility and the cor-respondence between the three systems,Process-based ap-proach to deal with coordination and the interactions be-tween the activities of a company,Monitoring System to ensure the monitoring of the global system and the inte-gration as a continuous improvement of the performance.
steps into three phases such that the first one concerns thePlan phase, the second, theDo phase and the third the Check and theAct phases. These three phases can be detailed as follows [1]:
Figure 1: Proposed process-based approach for IMS [1]
• Plan phase: This phase is composed of six steps: the first consists in setting up all quality, security and environment objectives issued from the require-ments and the expectations of stakeholders (i.e. cus-tomers, employees, population, environment, etc.). In the second, we will deploy all these objectives in each process. The third step consists in the analysis of each process with respect to the pre-set objectives defined in the second one in order to identify the sources of hazard and possible targets leading to a possible failure to reach up the objectives. In the fourth step, each identified risk has to be analyzed in term of potential consequences in each manage-ment area. In the fifth step we have to define a global management plan QSE to implement selected treatments as preventive and corrective actions, in order to reduce levels of risks already identified and to improve the efficiency of the IMS. To this end, we have to consider the interaction between the differ-ent managemdiffer-ent areas, indeed some decisions can be beneficial for some management areas and harmful for others. Finally, the sixth step is devoted to the definition of an appropriate monitoring plan, in or-der to ensure the well implementation of the global management plan.
• Do phase: This phase has as input the global man-agement plan QSE and the corresponding global monitoring plan generated from the plan phase and
will implement the selected treatments. Note that we have to define the appropriate Scheduling to op-timize the resources in order reach up the objectives more efficiently.
• Check and Act phase: Once the do phase
achieved, this phase will finalize the process of inte-gration by the measure of the effectiveness of differ-ent decisions and their readjustmdiffer-ents via three steps. In the first one, we have to measure all the indicators already defined in order to evaluate the effectiveness of selected treatments and to estimate the degree of achievement of objectives. For this reason, we have to aggregate the indicators of each objective. In the second step, a readjustment of the management plan will be done in order to satisfy unreached objectives. Although, some objectives may not be reached, that is why we should revise some of the initial assigned objectives in order to make their satisfaction possi-ble, in this context we propose the third step (i.e. revision of objectives) in order to contribute to sus-tainable development.
3
A multi-objective approach for a global
management plan QSE
In this section we propose an implementation of the most important part of the Plan phase consisting in the def-inition of an appropriate global management plan QSE. In fact, as indicated in section 2, our idea is to use the risk management as integrating factor and to con-sider the different interactions between policies, objec-tives and resources of the quality, security and environ-ment standards. Several approaches for risk evaluation exist, within the most famous ones we can mention, pre-liminary risk analysis (APR), hazard operability (HA-ZOP), failure mode and effects analysis (FMEA), and tree-based technique such that fault tree analysis, event tree analysis and bow tie analysis. Unfortunately, these methods are not appropriate to deal with many manage-ment areas simultaneously and they are usually limited to technical level. Moreover, since 2003 it is necessary to respect the law 2003-699 [7] relative to the introduction of probability concepts in any risk analysis which is not the case of all these tools. In the literature some researches has been carried out to take into account this law. Most of these researches are based on tree-based techniques which offer a flexible structure to be used with proba-bility concepts. Moreover, several approaches concerning the introduction of probabilistic concepts with risk analy-sis are particularly focalized onBayesian networkswhich are a popular tool for representing uncertainty in artifi-cial intelligence [15]. These approaches can be divided into three classes:
first introduced by Bibbio et al. [2] which propose a mapping from fault tree analysis into Bayesian net-works. In the same context, l´eger et al. [11] propose to extend the technical bow tie analysis to a global system, including human beings and organizations.
• The principle of the second class is the fusion of a risk analysis tool and a Bayesian network. We can mention in particular the work of Trucco et al. [18] where Bayesian networks are used as an extension of the fault tree in order to introduce the social activity in the evaluation of the latter.
• The third class does not require any risk analysis tools. In fact each identified risk will be directly modeled by a Bayesian network as proposed by Pala-niappan [14].
The first problem with these methods in that they deal with a unique management area, so they cannot be ap-plied in the context of a fully integrated management system. Moreover, the fact that these methods are based on Bayesian networks presents a real weakness since this graphical model is not really appropriate to generate opti-mal decisions. In fact, the powerful of Bayesian networks consists in their ability in reasoning under uncertainty and not in decision making area. For this reason, sev-eral extensions where proposed in order to extend them to the decisional aspect. Thus, our objective is to model a more efficient risk management tool by using an ap-propriate graphical decisional model. More precisely, we propose to use influence diagrams which are an exten-sions of Bayesian networks able to provide optimal solu-tions while maximizing decision makers utilities. More-over, given the multi-objective aspect of our problem, we will usemulti-objective influence diagrams(MIDs) which are a new variant of influence diagrams dedicated to such a problems. Thus our idea is to map existing bow ties
which are a very popular and diffused risks analysis tool into a MID, then to evaluate it in order to generate an appropriate global management plan QSE. Before detail-ing our approach we propose a brief recall on bow tie analysis and multi-objective influence diagrams.
3.1
Bow tie method
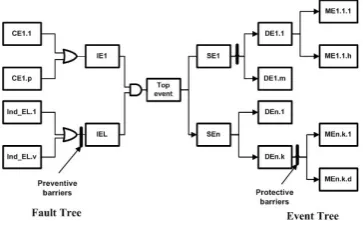
The bow tie method is a very popular and diffused prob-abilistic technique developed by shell for dependability modeling and evaluation of large safety-critical systems. The principle of this technique is to built for each iden-tified risk Ri (also calledtop event (TE)) a bow tie rep-resenting its whole scenario on the basis of two parts, as shown in figure 2: The first part corresponds to the left part of the scheme which represents a fault tree defin-ing all possible causes leaddefin-ing to the (TE). These causes can be classified into two kinds: the first are the initia-tor events (IE) which are the principal causes of the TE, and the second are the undesired or critical events (IndE
and CE) which are the causes of the IE. The construc-tion of the left part proceeds in top down manner (from TE to IndE and CE). The relationships between events and causes are represented by means of logical AND and OR gates. The second part corresponds to the right part of the scheme which represents anevent tree to reach all possible consequences of the TE. These consequences can be classified into three kinds: second events (SE) which are the principal consequences of the TE, dangerous ef-fects (DE) which are the dangerous consequences of the SE and finally majors events (ME) of each DE. The con-struction of the event tree proceeds as the fault tree i.e. in top down manner.
The bow tie also allows to define in the same scheme the
[image:3.595.337.519.343.458.2]preventive barriersto limit the occurrence of the TE and the protective barriers to reduce the severity of its con-sequences. In spite its widely use in many organizations, this method remains limited by its technical level and by the graphical presentation of different scenarios with-out any suggestion abwith-out optimal decisions regarding the objectives expected.
Figure 2: A bow tie analysis model
3.2
Multi-objective influence diagrams
Influence diagrams (IDs), initially proposed by Howard and Matheson [4], are within most commonly used graph-ical decision models for reasoning under uncertainty. Their success is due their clarity and their simplicity since their topology (chance node, value node and de-cision node) is easily comprehensible by dede-cision makers. Moreover their evaluation provides the optimal solutions while maximizing the decision makers utilities. Formally, an influence diagram has two components:
1. Graphical component(or qualitative component)
is a directed acyclic graph (DAG) denoted by G = (N, A) where A is the set of arcs in the graph and N its node set. The node set N is partitioned into subsetsC,DandV such that:
• D={D1...Dm}is a set of decision nodes which depict decision options. These nodes should re-spect a temporal order. Decision nodes are rep-resented by rectangles.
• V ={V1...Vk}is a set of value nodes which resent utilities to be maximized, they are rep-resented by lozenges.
Arcs inAhave different meanings according to their targets. We can distinguish Conditional arcs (into chance and value nodes), those that have as target chance nodes represent probabilistic dependencies and Informational arcs (into decision nodes) which imply time precedence.
Influence diagrams are required to satisfy some con-straints to beregular, in particular value nodes can-not have children and there is a directed path that contains all of the decision nodes. As a result of this last constraint, influence diagrams will satisfy the no-forgetting property in the sense that a deci-sion node and its parents should be parents to all subsequent decision nodes.
2. Numerical component (or quantitative
compo-nent) consists in evaluating different links in the graph. Namely, each conditional arc which has as target a chance node Ci is quantified by a condi-tional probability distribution of Ci in the context of its parents. Such conditional probabilities should respect the probabilistic normalization constraints. Chance nodes represent uncertain variables charac-terizing decision problem. Each decision alternative may have several consequences according to uncer-tain variables. The set of consequences is character-ized by a utility function. In IDs, consequences are represented by different combinations of value node’s parents. Hence, each value node is quantified by a utility function, denoted by U, in the context of its parents. The definition of the numerical component is in general done by experts and decision makers.
Once the ID constructed it can be used to identify the optimal policy, this can be ensured via evaluation algo-rithms which allow to generate the best strategy yield-ing to the highest expected utility. In 1990, Cooper has shown that this problem is NP-hard. Within proposed evaluation algorithms, we can distinguishdirect methods which operate directly on influence diagrams [16] [17] or
indirect ones [3] [19] which transform them into a sec-ondary structure (s.t. a Decision tree or a Bayesian net-work) and then operate on it.
Standard IDs are usually limited to single objectives or a combined one. Recently, they have been extended to deal with multiple objectives decision problems (MIDs) [12] by gathering different objectives in a unique value node. Ob-viously, to consider such a node, some modifications are
required on the functional and numerical level. The basic modifications required to evaluate a (MIDs) compared to a (IDs) are defined in the:
1. Chance Node removal: where two cases have to be considered.
Case A: is performed when no decision nodes have been removed prior to the removal of the current chance node, In this case, the conditional expecta-tion procedure is very similar to that in a single ob-jective influence diagram. So, for each unique com-bination of alternatives and outcomes of the other influences to the value node, the expectation oper-ation is performed on each outcome of the chance node being removed. The only difference is that the expectation operation is performed on each objective in the vector, instead of on a single objective only.
Case B: is performed when one or more decision nodes have been removed prior to the current chance node. For this case, each possible outcome of the chance node can have associated with it a set of one or more noninferior decision rules. A decision rule is simply defined as a particular decision alternative chosen when a certain outcome of a chance node oc-curs.
2. Decision Node Removal: the required modification is that the simple maximizing operation must be re-placed with an operation that can determine the set of noninferior solutions.
Otherwise, the extension to (MIDs) has no effect on the arc reversal and the barren node (a node without a suc-cessor) removal transformations.
To evaluate such diagrams Micheal et al. [12] have pro-posed a direct evaluation algorithm based on arc reversal and node deletion. This algorithm is defined as follows:
1. Make sure that the influence diagram is oriented and regular.
2. Eliminate any barren nodes.
3. If a chance node exists with the value node as its sole successor, remove this chance node with the modified transformation If any nodes remain in the diagram return to step 3. Otherwise, terminate algorithm
5. Find a chance i node that is a direct predecessor to the value node such that it has no decision node successors.
6. Find a chance nodej that is a direct successor ofi
such that there is no other directed path between i
andj and reverse the arc betweeniandj . If chance node has any other successors repeat step 6.
7. Remove chance i node with the modified transfor-mation. If any nodes remain in the diagram return to step 3. Otherwise, terminate algorithm.
The final output of this algorithm is the optimal decisions satisfying all the objectives defined in the utility node.
3.3
Transformation of bow ties into a MID
In order to generate the optimal global management plan satisfying all the objectives, we propose a mapping from existing bow ties to build a multi-objective influence dia-gram. In fact, our idea is to gather all the QSE required objectives in the same value node, then each identified risk and its respective scenario occurrence from initia-tors to final consequences will represent the chance nodes, and finally the barriers operations considered by the bow tie analysis as preventive and corrective actions will be mapped as decision nodes in order to define the appropri-ate management plan. Once this building phase achieved, we should quantify the resulted multi-objective influence diagram as explained in subsection 3.2.
To deal with, we propose a transformation procedure (i.e. Algorithm 1) to provide an automatic transforma-tion from the bow ties model to an alternative model (MID) that facilitates the calculation of optimal strate-gies.
Let BT1..BTn the set of bow ties and O1..Ok the set of objectives. Let Ri be top event ofBTi andFi be its oc-currence. Let IEi (resp. CEi, IndEi, SEi, DEi, M Ei) be the set of initiator (resp. critical, undesired, second, dangerous, majors) events in BTi. LetCqi (resp. Csi, Cei ) be the consequence on quality (resp. security, en-vironment) in BTi. Let Xi and Yi be any set of events in BTi, then Ar(Xi, Yi) is a function which returns the set of arcs relative to all links betweenXiandYiinBTi. For instance Ar(IEi, CEi) is the set of arcs relative to all links betweenIEi andCEi inBTi. LetArCqi (resp. ArCsi,ArCei) the set of major events which have a pos-sible links to Cqi (resp. Csi, Cei) in BTi. Let P reBi (resp. P roBi) be the set of preventive barriers (resp.
protective) barriers in BTi. Let P E(.) (resp. SE(.)) be a function which returns the set of precedent (res. suc-cessive) events of any barrier in BTi. Let D the set of all barriers. LetArpB the set of additional arcs relative to the links between each element of D to each event. Let ordbe the order relative to different decision nodes
relative to existing barriers in BT1..BTn, this order can be difined by experts. Let nb(.) be a function return-ing the nb of elements of a given set. Then the followreturn-ing algorithm outlines the major steps of our approach:
Algorithm 1: Transformation of bow ties into a
regular MID
Data: BT1..BTn;O1..Ok;ArCq1..ArCqn; ArCs1..ArCsn; ArCe1..ArCen; ArpB;ord
Result: MID
begin
Building phase:
-C← ∅,D← ∅,V ← ∅,A← ∅
- Gather all the QSE objectivesOi(i=1..k) in the same value nodeVQSE
-V ←VQSE
fori←1..ndo
% CreateRi andFiand connect them C←C∪Ri∪Fi
A←A∪(Ri→VQSE)∪(Fi→Ri)
% Create all the events and connect them C←C∪IEi∪CEi∪IndEi∪SEi∪DEi∪M Ei
∀IEij∈IEi, A←A∪(IEij→Fi)
∀SEij∈SEi, A←A∪(Fi→SEij)
A ← A ∪ Ar(IEi, CEi) ∪ Ar(IEi, IndEi) ∪ Ar(SEi, DEi)∪Ar(DEi, M Ei)
% CreateCqi,Csi,Cei and connecte them C←C∪Cqi∪Csi∪Cei,
A←A∪(Cqi→Ri)∪(Csi→Ri)∪(Cei→Ri)
∀ArCqij∈ArCqi, A←A∪(ArCqij→Cqi)
∀ArCsij∈ArCsi, A←A∪(ArCsij→Csi)
∀ArCeij∈ArCei, A←A∪(ArCeij→Cei)
% Handel barriers D←D∪P reBi∪P roBi
∀P reBij ∈ P reBi,∀P roBij ∈ P roBi, A ← A∪(P reBij → P E(P reBij))∪(P roBij → SE(P roBij))
% Additional links A←A∪ArpB
% Connect decision nodes while respecting the precedence order.
n1←nb(D)
fork←1..(n1−1) do
forl←(k+ 1)..n1 do
A←A∪(Dord(k)→Dord(l))
Quantification phase: Assign the numerical values for each node in the MID.
end
It is important to note that this algorithm provide a reg-ular influence diagram satisfying the no-forgetting prop-erty.
3.4
Illustrative example
relative to quality, security and environment management systems. We will also consider a unique Bow tie (BT1)
relative to aProtective device broken(R1) which can take
three states high, medium, low. The first step is to pro-ceed to the bow tie analysis of the identified risk (R1)
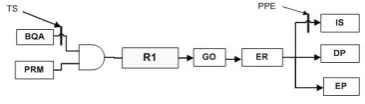
con-sidered as the top event. As shown in figure 3, we consider two initiator events (i.e. Bad quality of assembly(BQA) and Problems related to the maintenance(PRM)), a sec-ond event i.e Gas outburst(GO), a dangerous effect i.e
Explosion risk(ER), three major events (i.e. Injured staff(IS),Destruction of products(DP) and Environmen-tal pollution(EP)), a preventive barrier i.e. Training staff(TS) to reduce the occurrence of the (TE) due to the quality of assembly, and a protective barrier to reduce the risk of explosion bySetting up personnel protective equip-ments(PPE).
Figure 3: A bow tie analysis of R1
Once the bow tie analysis achieved, we will apply our transformation procedure (i.e. Algorithm 1). the re-quired data are: BT1; Oq,Os,Oe; ArCq1 ={DP} since
destruction of products has consequences on quality; ArCs1={IS} since injured staff has consequences on
se-curity, ArCe1 ={EP}since environmental pollution has
consequences on the environment. The additional arcs defined in ArpB1 are (Ts, PRM) since successive
train-ings can increase equipments failures rates; (Ts, Cs1)
since successive trainings can increase increases the in-jury rates, (PPE,Ce1) since some protection equipments
are considered as pollutant for the environment (e.g. ex-tinguisher). Regarding the precedence order between the two decision nodes, we suppose thatSetting up personnel protective equipments precedes Training staff, therefore ord1={1,2}.
First our algorithm gather all the Q,S,E objectives in the same value node VQSE, then it creates the chance node R1 and F1. After, it connects R1 to VQSE and F1 to R1. Next, it creates BQA, PRM, GO, ER, IS, DP andEP chances nodes, once created it connects first
BQA and PRM to F1, then F1 to GO, and finally it
connectsGO toER, andERto (IS,DP andEP). After, it creates three chance nodesCq1,Cs1,Ce1, once created
it connects them toR1, then it connectsDE toCq1,IS to
Cs1andEP toCe1. After that, the algorithm creates the
two decision nodesTS, PPE, and connectsTS to BQA, and PPE to IS. Then, the algorithm proceeds with the additional links and connects TS to PRM, TS to Cs1
andPPE toCe1. And finally, it connectsTS toPPE in
order to respect the precedence order.
The building phase generates the multi-objective influ-ence diagram MID illustrated by figure 4 where C = {R1, Cq, Cs, Ce, F, BQA, P RM, GO, ER, DP, IS, EP}, D={T S, P P P}and V ={VQSE}.
Then, we should proceed to thequantification phase. For the lack of space we cannot give numerical data here. Once the transformation achieved, we can apply the eval-uation algorithm proposed by [12] and presented in sub-section 3.2. The final output of this algorithm is the opti-mal decisions satisfying all the objectives defined, which represent the global management plan QSE. For our illus-trative example the final output is the one given by table 1, this means that the optimal decision is not totrain the staff and to set up the personal protective equipments
[image:6.595.77.260.280.332.2]since it is the unique non-inferior solution regarding the three objectives (i.e. O1, O2, O3).
Figure 4: A multi-objective influence diagram of a gas bottle manufacturer
Table 1: Final numerical value results
O1 O2 O3 Training staff Personal protective equipements 5.52 5.01 4.02 Yes Yes
4.48 5.5 4 Yes No
5.58 5.53 4.83 No Yes
4.33 3.58 2.46 No No
4
Conclusion
[image:6.595.322.531.286.455.2]scheme the whole scenario from initiators events to fi-nale consequences. Moreover, it defines all the possible actions and decisions as preventive and corrective barri-ers to reduce the occurrence and the severity of each risk identified. Also the multi-objective influence diagram are one of the most appropriate graphical decision models for reasoning under uncertainty in addition to the fact that they allow the manipulation of different objectives which feats well with our problem since we deal with the three standard QSE. To obtain the optimal and appropriate global management plan QSE, we have proposed a trans-formation procedure (i.e. Algorithm 1) to provide an automatic transformation from the bow ties model to an alternative model (MID) that facilitates the calculation of optimal strategies. This implementation will directly affect the remaining parts of our integration system since it will provide the global management plan QSE, which should be executed in the Do phase. As a future work we propose to implement a whole decision support system including additional tools in order to implement all steps of integration approach.
References
[1] Badreddine, A., Ben Romdhane, T., Ben Amor, N., “ A New Process-Based Approach for Implement-ing an Integrated Management System: Quality, Se-curity, Environment,”Proc. The 2009 International Conference on Industrial Engineering, IMECS 2009, Hong Kong, March 2009.
[2] Bobbio A., Portinale L., Minichino M., Ciancamerl E., “ Improving the analysis of dependable systems by mapping fault trees into Bayesian networks,” Re-liability Engineering and System Safety, N71, pp. 249-260, 2001.
[3] Cooper, G.F., “A method for using belief networks as influence diagrams,”Fourth Workshop on Uncer-tainty in Artificial Intelligence, pp. 5563, 1988.
[4] Howard R. A., Matheson J. E., “Influence diagrams. The Principles and Applications of Decision Analy-sis,” N2, pp. 719762, 1984.
[5] ISO 9001:2008,Quality managment system. Require-ments, ISO, 2008.
[6] ISO 14001:2004,Environmental managment system. Requirements with guidance for use, ISO, 2004.
[7] J0 175 ., “ Law n 2003-699 concerning the prevention of technological and natural risks, and to the repair of damage,”Official Journal of July 30, 2003.
[8] Jorgensen, TH., Remmen, A., Mellado, MD.,“Integrated Management Systems-three different levels of integration,” Journal of Cleaner Production, N14, pp. 713-722, 2006.
[9] Jorgensen, TH., “Towards more sustainable manage-ment systems:Through lide cycle managmanage-ment and in-tegration,” Journal of cleaner production, N16, pp. 1071-1080, 2008.
[10] Labodova, A., “Implementing integrated manage-ment systems using a risk analysis based ap-proach,”Journal of Cleaner Production, V12, N6, pp. 571-580, 2004.
[11] L´eger A., Duval C., Weber P., Levrat E., Farret R., “Bayesian network modelling the risk analysis of complex socio technical systems,” 4th Workshop on Advanced Control and Diagnosis, Nancy-France, 2006.
[12] Micheal D., Yacov Y.H., “Influence diagrams with multiple objectives and tradeoff analysis,” IEEE transactions on systems, man and cybernetics, N34, pp. 293-304, 2004.
[13] OHSAS 18001:2000,Occupational health and safety management systems-specification, BSI: British standard institution, 2007.
[14] Palaniappan R., “Bayesian networks: Application in safety instrumentation and risk reduction,” ISA Transactions, N46, pp. 255-259, 2007.
[15] Pearl J., Probabilistic reasoning in intelligent sys-tems, Morgan Kaufmann, Los Altos, CA, 1989.
[16] Shachter, R.D., “Evaluating influence diagrams,”
Operation Research, N34, pp. 871882, 1986.
[17] Tatman, J.A., Shachter, R.D., “Dynamic program-ming and influence diagrams,” IEEE Transactions on Systems, Man and Cybernetics, N20, pp. 365379, 1990.
[18] Trucco P., Cagno E., Ruggeri F., Grande O., “A Bayesian Belief Network modelling of organisational factors in risk analysis: A case study in maritime transportation,”Reliability Engineering and System Safety, N93, pp. 845-856, 2008.
[19] Xiang, Y., Ye, C., “A simple method to evaluate influence diagrams,” The Third International Con-ference on Cognitive Science, 2001.
![Figure 1: Proposed process-based approach for IMS [1]](https://thumb-us.123doks.com/thumbv2/123dok_us/1312330.661339/2.595.55.286.131.344/figure-proposed-process-based-approach-for-ims.webp)