warwick.ac.uk/lib-publications
Original citation:
Shevchenko, Nikita A., Xu, Tianhua, Lavery, Domaniç, Liga, Gabriele, Ives, David J., Killey, Robert I. and Bayvel, Polina. (2017) Modeling of nonlinearity-compensated optical
communication systems considering second-order signal-noise interactions. Optics Letters, 42 (17). pp. 3351-3354.
Permanent WRAP URL:
http://wrap.warwick.ac.uk/93672
Copyright and reuse:
The Warwick Research Archive Portal (WRAP) makes this work of researchers of the University of Warwick available open access under the following conditions.
This article is made available under the Creative Commons Attribution 4.0 International license (CC BY 4.0) and may be reused according to the conditions of the license. For more details see: http://creativecommons.org/licenses/by/4.0/
A note on versions:
The version presented in WRAP is the published version, or, version of record, and may be cited as it appears here.
Modeling of nonlinearity-compensated
optical communication systems considering
second-order signal-noise interactions
N
IKITAA. S
HEVCHENKO,
1,†T
IANHUAX
U,
1,*
,†D
OMANIÇL
AVERY,
1G
ABRIELEL
IGA,
1D
AVIDJ. I
VES,
2R
OBERTI. K
ILLEY,
1 ANDP
OLINAB
AYVEL11Optical Networks Group, Department of Electronic & Electrical Engineering, University College London (UCL), London WC1E 7JE, UK 2Electrical Engineering Division, Department of Engineering, University of Cambridge, Cambridge CB3 0FA, UK
*Corresponding author: [email protected]
Received 24 May 2017; revised 19 July 2017; accepted 20 July 2017; posted 21 July 2017 (Doc. ID 296674); published 22 August 2017
An analytical model considering modulation-dependent nonlinear effects and second-order interactions between signal and optical amplifier noise is presented for Nyquist-spaced wavelength-division-multiplexing optical communi-cation systems. System performance of dual-polarization modulation formats, such as DP-QPSK, DP-16QAM, and DP-64QAM, is investigated using both the analytical model and numerical simulations. A good agreement between analytical and numerical results shows that, in the case of full-field nonlinearity compensation, accounting for second-order interactions becomes essential to predict system performance of both single- and multi-channel sys-tems at optimum launched powers and beyond. This effect is validated via numerical simulations for signal bandwidths up to∼1THz.
Published by The Optical Society under the terms of theCreative Commons Attribution 4.0 License. Further distribution of this work must maintain attribution to the author(s) and the published article’s title, journal citation, and DOI.
OCIS codes:(060.0060) Fiber optics and optical communications; (060.1660) Coherent communications; (060.4370) Nonlinear optics, fibers.
https://doi.org/10.1364/OL.42.003351
Over the past four decades, data rates in optical communica-tions systems have seen a dramatic increase. The development of a series of new technologies have contributed to this increase. These include techniques such as wavelength-division multi-plexing (WDM), advanced optical signal modulation formats, optical amplifiers and novel fibers, coherent detection, and fast signal processing for mitigating linear and nonlinear (NL) op-tical effects. Suppressing opop-tical nonlinearity, which is mainly due to the optical Kerr effect, has now become the greatest chal-lenge for enhancing the achievable capacity of optical commu-nications [1,2]. A multitude of nonlinearity compensation
techniques have been proposed and demonstrated to mitigate Kerr nonlinearity-induced distortions, including single- and multi-channel (MC) digital backpropagation (DBP), optical phase conjugation, eigenvalue communication, NL Fourier transform, etc., as recently reviewed in [2].
Regardless of the specific scheme, when nonlinearity com-pensation is ideally operated over the entire transmitted band-width, complete suppression of all“deterministic”signal–signal (S–S) interactions can be achieved, while “stochastic” NL distortions consisting of NL signal–noise (S–N) interactions are left uncompensated. This leads to an increased optimal signal-to-noise ratio (SNR) and optimal transmitted power compared with conventional receiver schemes, such as elec-tronic dispersion compensation (EDC). In addition, operating beyond the optimum power may enable potential advantages, e.g., in submarine transmission [3] and for improved detection schemes (Section 10, [4]).
In the range of powers, which are of interest for nonlinearity-compensated systems, first-order perturbation analysis is no longer sufficient for accurate characterization of system perfor-mance, and second-order nonlinear effects need to be taken into consideration. For instance, in [5] it was pointed out that, be-yond the optimum power threshold and in the case of full-field (FF) DBP, the SNR decreases with a rate of 3 SNR [dB]/power [dB], rather than 1 SNR [dB]/power [dB] as conventional first-order analytical models predict [6]. This rapid SNR degradation has been attributed to second-order S–N interactions [5]. This term arises from the additional NL mixing process between sig-nal and residual first-order S–N interactions, originating in the previous uncompensated fiber spans within a“virtual”DBP link, as schematically shown in Fig.1. This effect was studied in [5] for single-channel optical transmission systems with a dual-polarization (DP) quadrature phase-shift keying (QPSK) signal. The analysis was based on analytical closed-form expressions derived for orthogonal frequency division multiplexing transmis-sion, assuming that NL interference has a Gaussian distribution as well as being independent of input signal modulation format. Hence, the dependence on the number of channels as well as the impact of modulation format on the effective variance of NL
distortions have not been analyzed. However, the implementa-tion of a model accounting for number of channels and modu-lation format dependency in second-order S–N interactions enables an accurate investigation of the system achievable infor-mation rate (AIR), which is a natural figure of merit in coded communication systems [7,8].
In this Letter, within the framework of regular perturbation analysis [9], an analytical model for Nyquist-spaced WDM optical communication systems employing nonlinearity com-pensation is developed. Such a model extends the work in [5] by accounting for the modulation format dependency of second-order S–N interactions in a multi-channel transmission scenario. Different modulation formats, including DP-QPSK, DP 16-ary quadrature amplitude modulation (DP-16QAM), and DP-64QAM, were investigated. The SNR and optimum launched power for FF DBP schemes were analyzed as a function of transmission distance, accounting for first- and second-order S–N contributions. Finally, the relevance of second-order S–N interactions was quantified for different transmission distances and bandwidths. The developed analyti-cal model allows us to predict the system performance at optimum power and beyond, which gives rise to further inves-tigations of AIRs in coded transmission systems.
The performance of a dispersion-unmanaged optical commu-nication system can be evaluated by introducing the so-called effective receiver SNR, which includes the impact of linear amplified spontaneous emission (ASE) noise and NL distortions due to the optical Kerr effect, as follows [6,10]:
SNR≈ P
Nsσ2
ASEPs−sPs−n;
(1)
whereP is the average optical power per channel, σ2 ASE is the
overall ASE noise power, arising from erbium-doped optical fiber amplifiers (EDFAs) at the end of each span in a link [11],Ns is
the total number of fiber spans in a link,Ps−sandPs−nare the NL distortion powers due to S–S and S–N interactions, respectively. The contribution of the deterministic S–S interactions is de-scribed asPs−sNϵs 1ηP3, whereηis the NL distortion
coef-ficient for one span, andϵ∈0;1characterizes the decorrelation of the NL distortions between each fiber span in a link. In the case of EDC (solid lines in Figs.2and3), the contribution of S–N term Ps−n is negligible, whereas, for the DBP case, such term can be expressed as [5,6]
Ps−n≈3ξ1ησ2ASE·P29ξ2η2σ2ASE·P4; (2)
withξ1andξ2being first- and second-order distance-dependent factors, respectively, which account for the accumulation of NL optical distortions due to the S–N interactions in propagation.
The closed-form expression for the factorξ1is already provided in [Eq. (5),8], and the factor ξ2 can be approximated as
ξ2≜XNs n2
Xn−1
m1
mϵ1≈ζ−ϵ−1−ζ−ϵ−1; Ns
2
ζ−ϵ−2−ζ−ϵ−2; Ns
ϵ2 ; (3)
whereζzandζz; rdenote the Euler–Riemann zeta function and its extension as the Hurwitz’s generalized zeta function, respectively.
[image:3.594.52.287.52.136.2]Assuming that all the WDM channels have the same modu-lation format and launched power, the NL distortion coeffi-cient in Eq. (2) is quantified by the following [12]:
[image:3.594.313.551.53.174.2]Fig. 1. Schematic of S–N noise interactions accumulation process in an optical communication system using FF DBP.
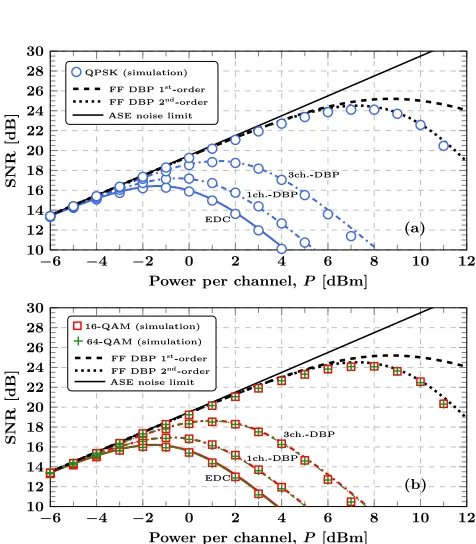
Fig. 2. Theoretical predictions (lines) and numerical simulation results (marks) of SNR as a function of launched power per channel for a single-channel system using EDC and FF DBP. Colors refer to modulation formats.
[image:3.594.313.551.234.506.2]ηη0−η0
0; (4)
where the first termη0 does not depend on the signal modu-lation format because the signal is assumed to be strongly dis-persed and, hence, Gaussian distributed. The second termη00is modulation format-dependent and includes the corrections needed for non-Gaussian input signal distribution [12]. Following the model developed in [12,13], this modulation-dependent term can be decomposed as follows:
η0
0≈κ4η1κ24η2κ6η3; (5)
where the pre-factorsκ4andκ6are directly related to the excess kurtosis and the sixth standardized moment of the input signal constellation, respectively. Values ofκ4andκ6 for typical signal distributions are provided in Table1. Considering ideal Nyquist WDM transmission, i.e., each channel has a rectangular spectra of width exactly equal to the symbol rate, the NL scaling factors
η1,η2, andη3 in Eq. (5) have been numerically computed by means of Monte Carlo integration including both intra-channel and inter-channel effects, similar to the approach in [12,14].
Employing FF DBP, closed-form expressions for the opti-mum launched power, i.e., the power corresponding to the maximum SNR at a given number of fiber spans, for the case of first-order S–N interactions only is Popt1
ffiffiffiffiffiffiffi
Ns
3ξ1η
q
and for first- and second-order S–N interactions is derived as
P2
opt 1
3pffiffiffi2
ffiffiffiffiffiffiffi ξ1 ξ2η
s ffiffiffiffiffiffiffiffiffiffiffiffiffiffiffiffiffiffiffiffiffiffiffiffi
112Nsξ2
ξ2 1 s
−1
!1∕2
: (6)
If DBP is applied over a partial bandwidth (dashed–dotted lines in Figs. 2 and 3), the residual S–S interactions Ps−s in
Eq. (1) can be obtained by using an approach similar to the one in [8,15]. It is also worth mentioning that, in the case of partial-bandwidth DBP, the nonlinear distortions owing to residual uncompensated S–S interactions are still more prevalent in comparison with both first- and second-order S–N inter-actions. Hence, the dramatic effect of second-order S–N inter-actions can be properly distinguished in the case of FF DBP only, i.e., when S–S interactions are completely suppressed [5,6].
Numerical simulations have been performed to assess the accuracy of the analytical model. The investigated scenario was a Nyquist-spaced WDM optical transmission system, using DP-QPSK, DP-16QAM, and DP-64QAM, with parameters shown in Table2. A factor of 8 is used to oversample the sim-ulation bandwidth, and the SNR is estimated over217symbols
based on the received constellation clusters, similar to [8,16,17]. The transmitted symbol sequences in each channel and polarization are independent and randomly generated. The signal propagation in standard single-mode optical fiber was simulated using the split-step Fourier method to solve the Manakov equation, where a logarithmic step-size distribution
was adopted for each fiber span [18]. EDFAs were used to com-pensate for fiber attenuation. At the receiver, the signal was mixed with an ideal free-running local oscillator to ensure ideal coherent detection of the optical signal. EDC was implemented using an ideal frequency domain filter [19], whereas MC DBP was realized using the reverse split-step Fourier solution of the Manakov equation using the same step-size as in the forward propagation [20,21] to ensure an ideal operation of MC DBP. An ideal root-raised-cosine filter with a roll-off factor of 0.1% is applied to select the backpropagated bandwidth for MC DBP, whereas no filtering is applied for the case of FF-DBP. Laser phase noise and polarization-mode dispersion are neglected.
Analytical model and numerical simulations were carried out for a single- and five-channel WDM transmission system over a transmission distance of 2000 km. The results are shown in Figs.2and3for the single-channel and five-channel cases, respectively. Excellent agreement between the analytical and numerical calculations is observed. It can be seen that the second-order interactions have a significant impact on perfor-mance in the case of FF DBP, whereas it is negligible when DBP is applied over a fraction of the transmitted bandwidth. In the case of FF DBP, for values of launched power per chan-nel beyond 7 dBm for a single-chanchan-nel system (with the opti-mum power of 9 dBm) and beyond 5 dBm for the five-channel system (where the optimum power is 7 dBm), accounting only for first-order S–N interactions (dashed black lines) yields in-accurate predictions. It also can be seen that the input signal modulation format does not have any substantial influence on the S–N NL distortions, when FF DBP is applied.
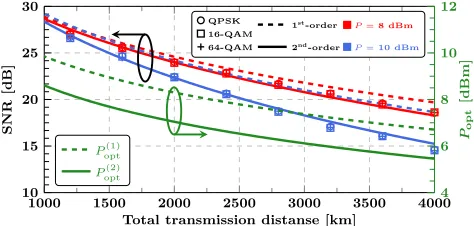
[image:4.594.311.552.66.166.2]Figure4shows the variation of the SNR as a function of trans-mission distance and a fixed launched power in a five-channel Nyquist-spaced system using FF DBP. It can be observed that
Table 1. Overview of pre-factorsκ4andκ6 in Eq. (5) for different input modulation formats and distributions
Modulation κ4 κ6
QPSK constellation 1 −4
16 QAM constellation 0.68 −2.08
64 QAM constellation 0.619 −1.797
Continuous uniform distribution 0.6 −1.716
Gaussian distribution 0 0
Table 2. System Parameter Values
Parameter Value
Carrier wavelength 1550 nm
Symbol rate 32 GBd
Channel spacing 32 GHz
Fiber attenuation 0.2 dB km−1
Fiber dispersion 17 ps nm−1km−1
Fiber nonlinearity 1.2 W−1km−1
Fiber span length 80 km
[image:4.594.314.551.558.671.2]EDFA noise figure 4.5 dB
[image:4.594.47.288.656.727.2]neglecting second-order S–N interactions leads to analytical pre-diction whose inaccuracy grows with both transmission distance and launched power. On the other hand, the“gap”between the predictions of optimum launched power given by the analytical models with and without accounting for the second-order inter-actions remains approximately constant with transmission dis-tance. Such a gap can be quantified in about 1.25 dB.
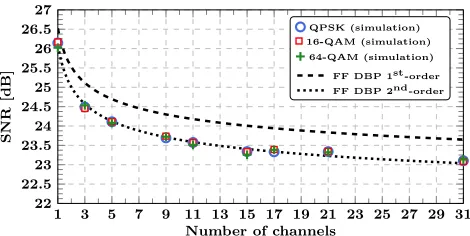
This effect persists in systems with wider bandwidths. Figure 5reflects the SNR at FF DBP versus the number of transmitted channels at optimum launched power for fixed 2000 km transmission distance. A perfect agreement between simulations and second-order S–N interaction model was dem-onstrated for a bandwidth up to 31 channels (∼1 THz) and across different modulation formats. Because numerical simu-lations become computationally intractable, the analytical model is highly beneficial for predicting the SNR performance of systems with wider transmission bandwidths (e.g., C-band). Figure 6 indicates the growth rate of second-order S–N interactions relative to the corresponding contribution of first-order S–N interactions as a function of launched power per channel for different transmission distances calculated for C-band (∼4.8 THz) system using the analytical model. The two horizontal dashed lines indicate the half- and equal contributions of second-order S–N interactions relative to first-order effects. It was found that, as both distance and launched power are increased, second-order effects become more significant. In particular, the contribution of second-order
effects grows faster with the launched power for longer trans-mission distances.
In summary, the impact of second-order S–N interactions in the presence of modulation-format-dependent NL distortion of a Nyquist-spaced WDM system with nonlinearity compensation has been analyzed, where the accurate assessment of this effect in the NL regime was presented. Analytical and numerical studies have been carried out for both single- and multi-channel WDM transmission systems. It was shown that, in the case of FF DBP, the consideration of second-order S–N interactions becomes sub-stantial at both optimum launched power and beyond. The pro-posed extended analytical model allowed us to accurately predict the performance of multi-channel transmission systems with full-field nonlinearity compensation. Additionally, the power thresh-olds, corresponding to half or equal contribution of second-order S–N interactions relative to the first-order S–N effects, have been quantified in the C-band transmission system for different trans-mission distances, which suggest a range of launched powers when second-order S–N interactions become important.
Funding. Engineering and Physical Sciences Research
Council (EPSRC) (UNLOC, EP/J017582/1); University College London (UCL) (GRS Scholarship).
†These authors contributed equally to this work.
REFERENCES
1. R.-J. Essiambre, G. Kramer, P. J. Winzer, G. J. Foschini, and B. Goebel, J. Lightwave Technol.28, 662 (2010).
2. P. Bayvel, R. Maher, T. Xu, G. Liga, N. A. Shevchenko, D. Lavery, A. Alvarado, and R. I. Killey, Phil. Trans. R. Soc. A374, 20140440 (2016). 3. S. Abbott, A. Pilipetskii, D. Foursa, and H. Li,SubOptic(2016). 4. E. Agrell, M. Karlsson, A. Chraplyvy, D. J. Richardson, P. M.
Krummrich, P. Winzer, K. Roberts, J. K. Fischer, S. J. Savory, B. J. Eggleton, M. Secondini, F. R. Kschischang, A. Lord, J. Prat, I. Tomkos, J. E. Bowers, S. Srinivasan, M. Brandt-Pearce, and N. Gisin, J. Opt.18, 063002 (2016).
5. M. A. Al-Khateeb, M. McCarthy, C. Sánchez, and A. Ellis, Opt. Lett. 41, 1849 (2016).
6. D. Rafique and A. D. Ellis, Opt. Express19, 3449 (2011). 7. M. Secondini, E. Forestieri, and G. Prati, J. Lightwave Technol.31,
3839 (2013).
8. T. Xu, N. A. Shevchenko, D. Lavery, D. Semrau, G. Liga, A. Alvarado, R. I. Killey, and P. Bayvel, Opt. Express25, 3311 (2017). 9. A. Vannucci, P. Serena, and A. Bononi, J. Lightwave Technol.20,
1102 (2002).
10. P. Poggiolini, J. Lightwave Technol.30, 3857 (2012). 11. G. P. Agrawal,Nonlinear Fiber Optics(Academic, 2007).
12. A. Carena, G. Bosco, V. Curri, Y. Jiang, P. Poggiolini, and F. Forghieri, Opt. Express22, 16335 (2014).
13. R. Dar, M. Feder, A. Mecozzi, and M. Shtaif, Opt. Express21, 25685 (2013).
14. R. Dar, M. Feder, A. Mecozzi, and M. Shtaif, Opt. Express22, 14199 (2014).
15. T. Tanimura, M. Nölle, J. K. Fischer, and C. Schubert, Opt. Express 20, 28779 (2012).
16. T. Fehenberger, A. Alvarado, G. Böcherer, and N. Hanik, J. Lightwave Technol.34, 5063 (2016).
17. R. Dar and P. J. Winzer, J. Lightwave Technol.35, 903 (2017). 18. G. Bosco, A. Carena, V. Curri, R. Gaudino, P. Poggiolini, and S.
Benedetto, IEEE Photon. Technol. Lett.12, 489 (2000).
19. T. Xu, G. Jacobsen, S. Popov, J. Li, E. Vanin, K. Wang, A. T. Friberg, and Y. Zhang, Opt. Express18, 16243 (2010).
20. E. Ip and J. M. Kahn, J. Lightwave Technol.26, 3416 (2008). 21. R. Maher, T. Xu, L. Galdino, M. Sato, A. Alvarado, K. Shi, S. J. Savory,
[image:5.594.51.286.52.170.2]B. C. Thomsen, R. I. Killey, and P. Bayvel, Sci. Rep.5, 08214 (2015). Fig. 5. SNR against the number of Nyquist-spaced WDM channels
[image:5.594.49.287.218.362.2]at optimum launched power after 2000 km transmission distance using FF DBP.