warwick.ac.uk/lib-publications
Manuscript version: Author’s Accepted ManuscriptThe version presented in WRAP is the author’s accepted manuscript and may differ from the published version or Version of Record.
Persistent WRAP URL:
http://wrap.warwick.ac.uk/62544
How to cite:
Please refer to published version for the most recent bibliographic citation information. If a published version is known of, the repository item page linked to above, will contain details on accessing it.
Copyright and reuse:
The Warwick Research Archive Portal (WRAP) makes this work by researchers of the University of Warwick available open access under the following conditions.
© 2018 Elsevier. Licensed under the Creative Commons Attribution-NonCommercial-NoDerivatives 4.0 International http://creativecommons.org/licenses/by-nc-nd/4.0/.
Publisher’s statement:
Please refer to the repository item page, publisher’s statement section, for further information.
Elsevier Editorial System(tm) for Ultrasonics Manuscript Draft
Manuscript Number:
Title: Coded waveforms for optimised air-coupled ultrasonic nondestructive evaluation
Article Type: Special Issue: Memory of Bernard Hosten
Section/Category: SI: memory of Bernard Hosten
Keywords: ultrasonic, air-coupled, coded waveforms, cross-correlation, non-destructive evaluation
Corresponding Author: Dr Dave Hutchins,
Corresponding Author's Institution:
First Author: Dave Hutchins, PhD
Order of Authors: Dave Hutchins, PhD; Lee Davis, PhD; Marco Ricci, PhD; Stefano Laureti, MSc
Coded waveforms for optimised air-coupled ultrasonic nondestructive evaluation
David Hutchins* and Lee Davis
School of Engineering, University of Warwick, Coventry CV4 7AL, UK
Marco Ricci and Stefano Laureti
Polo Scientifico Didattico di Terni, Università degli Studi di Perugia, 05100 Terni ITALY
Abstract—This paper investigates various types of coded waveforms that could be used for
air-coupled ultrasound, using a pulse compression approach to signal processing. These are needed because of the low signal-to-noise ratios that are found in many air-coupled ultrasonic nondestructive evaluation measurements, due to the large acoustic mismatch between air and many solid materials. The various waveforms, including both swept-frequency signals and those with binary modulation, are described, and their performance in the presence of noise is compared. It is shown that the optimum choice of modulation signal depends on the bandwidth available and the type of measurement being made.
Keywords—ultrasonic, air-coupled, coded waveforms, cross-correlation, non-destructive evaluation
*Corresponding author: [email protected]
*Manuscript
1. INTRODUCTION
Air-coupled ultrasound is a non-contact technique that is of interest to nondestructive
evaluation (NDE), because it can be used to test a wide range of materials, from polymers
and composites to metals [1,2], It can also be used in harsh environments, where
contamination is an issue, and when rapid scanning is required. The technique has been
proposed for application in many areas, including the inspection of composites [3-5], the
detection of contamination and changes in food quality [6] and for imaging many other
materials [7]. In all cases, it is the fact that air is used as the coupling medium which makes
the technique unique.
In pioneering work by Bernard Hosten and his colleagues at CNRS Bordeaux, this
approach has been used for the inspection of polymer composite plates using Lamb waves
[8,9]. Work was also done on the determination of the elastic constants of carbon fibre
reinforced polymer (CFRP) composites [10-12]. Here, the composite sample was positioned
between an ultrasonic capacitive source/receiver pair, and the angle of incidence changed by
rotation of the sample relative to the ultrasonic beam axis. The ultrasonic waveforms were
recorded at each angle, and the longitudinal and shear wave arrival times calculated in real
time (the latter created by mode conversion within the composite plate). Changes in arrival
time were then compared to theoretical predictions, and an optimum fit of one with the other
allowed the calculation of elastic constants. Elastic properties of other materials such as wood
were also examined [13]. The design of the electrostatic (also known as capacitive) device is
also important in determining performance [14].
Although air-coupled transducers can be scanned to form images, a higher resolution can
be obtained if the transducer beam is focused. A convenient way to do this is to use external
optics. This can be achieved using a Fresnel zone plate, which is aligned so as to focus
on-axis at a pre-selected frequency [15]. More commonly, however, a good focus in air can be
obtained across a wide bandwidth using external off-axis parabolic mirrors, which can be
used for imaging thin materials and other samples [16,17]. They can also be used for point
source experiments at solid surfaces with Lamb waves [18].
There is, however, a problem which must be overcome if air is used to transmit ultrasonic
energy into and out of a solid sample – there is a need to overcome the large acoustic
impedance mismatch between air and the solid object being tested. This causes several
problems. The first is that a large fraction of the incident energy is reflected at the air/solid
interface. This reduces the amount of energy both entering and leaving the sample. It also
operation becomes more complicated. In through-transmission, there are two basic
approaches to solving the lack of signal. The first is to choose a very narrow bandwidth, by
use of a highly resonant, high amplitude source and receiver. The frequency of operation is
then tuned to the through-thickness resonance of the sample, so as to maximize transmission
[19]. This lack of bandwidth is a problem when it comes to conventional imaging, as
discrimination of defects, for example, becomes very difficult.
The second approach is to use a wider bandwidth, together with some method of
retrieving very small ultrasonic signals that have passed through two separate air/sample
boundaries. This second method has been investigated by several authors [20,21], and the
general approach is to use a form of cross-correlation to detect the signal. The resulting
technique is known as pulse compression. The incident waveform, with a bandwidth usually
defined by the transduction method used, is chosen so that this type of signal processing can
be performed most effectively for a particular measurement. There are many types of signal
that can be used, but they can be broadly classified within two main types: a swept-frequency
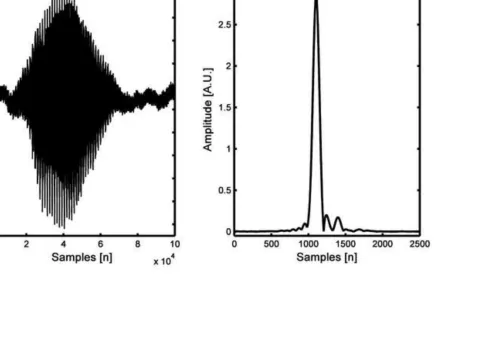
―chirp‖ signal or a form of binary sequence. Fig. 1 gives an example of a chirp signal buried in
noise to illustrate the pulse compression process. Cross-correlation between the output
―noisy‖ signal with a reference waveform, known in literature as matched filter, allows this
signal to be detected, with the smoothed rectified output shown. The resulting pulse
compression operation has allowed the signal to be enhanced in signal to noise ratio (SNR)
properties, allowing air-coupled measurements to be made. Usually the matched filter
coincides with a replica of the sent signal. Moreover, depending on the specific application,
the pulse compression procedure can use either periodic or aperiodic signals, and as a
consequence the cross-correlation step is then realized in a cyclic or non-cyclic mode
respectively.
Fig. 1. (a) Example of a linear chirp signal embedded in noise, and (b) the resultant pulse
compression output from a cross-correlation.
The operation shown in Fig. 1 is an example of a pulse compression operation that is not
modulation, and to determine the best approach for air-coupled ultrasound for a given
bandwidth of measurement.
2. THE CHOICE OF WAVEFORM FOR PULSE COMPRESSION
Various forms of both chirp signals and binary sequences have been investigated in this
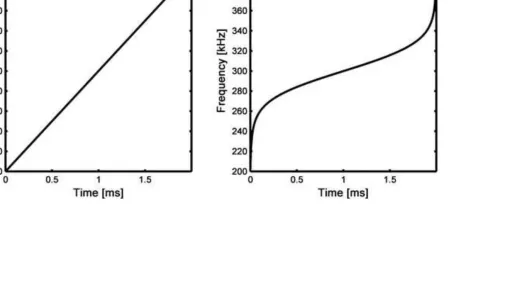
research. Consider first chirp signals. Here, the frequency can be swept in either a linear or
a non-linear way with respect to time. Two such signals sweeping from 100 kHz to 400 kHz
are shown in Fig. 2. While at first sight the waveforms do not appear to be very different,
their spectra indicate that the two signals have very different properties. This can be
illustrated further by looking at the trajectory followed by the instantaneous frequency in the
Time-Frequency plane, as shown in Fig. 3. In particular, the linear chirp is associated with a
straight line in this type of plot, whereas the trajectory of the non-linear chirp can be any
continuous monotonic curve, defined by the type of sweep function used.
Fig. 2.Examples of chirp signals in the form of (a) linear and (b) non-linear frequency
sweeps. Waveforms are on the left, and corresponding frequency spectra are on the right.
Fig. 3.Trajectories in the Time-Frequency planes of linear and non-linear chirps
In addition, it is usual to apply different types of widows to linear chirps. This reduces the
level of side-bands within the frequency spectrum, at the cost of a lower energy. There are
many different types of window that can be used, but this work has investigated three types:
Gaussian, Blackman and Tukey [22-23]. All three have different properties, depending on
The level of side-bands is determined by the cross-correlation of the input signal with the
matched filter applied to the output signal. According to theWiener–Khinchin theorem, the
cross-correlation function is equal to the Inverse Fourier Transform of the Cross-Spectral
Density of the input signal with the matched filter. Since in most cases the matched filter
coincides with a shifted replica of the signal itself, the side-bands are determined by the
Inverse Fourier Transform of the Power Spectral Density (PSD) of the input signal. It is well
known that PSDs with abrupt changes give rise to slow attenuating side-bands: by applying
a window function to a linear Chirp a smoothing of the PSD is obtained, thereby producing a
faster decay of side-bands. At the same time, the effective bandwidth of the signal is
reduced, causing a broadening of the main lobe of the cross-correlation, i.e. a worsening of
the resolution. A trade-off exists between side-band reduction and resolution achievable by
applying a windowing function and the three types here employed correspond to different
points of the trade-off boundary.
With respect to non-linear chirps, windowing should be applied with caution, since the linear
relationship between instantaneous frequency and time is no longer valid. However, the
reduction of side-band levels is still of the utmost importance for obtaining a good result
experimentally.
Thus, to tackle this problem, the possibility of performing windowing in the frequency domain
(i.e. spectral windowing) on a non-linear chirp signal has been investigated. This can be
achieved without relinquishing the constant envelope feature in the time-domain waveform.
In addition, the same transmitted energy as that of a non-windowed linear chirp is
maintained, while reducing side-band levels. As proposed in [24], this technique can be used
for both linear chirps, and for various non-linear chirp signal types (such as Gaussian,
Blackman and Tukey). This is achieved by starting from the PSDs of linear chirps, which are
then windowed by the corresponding function.
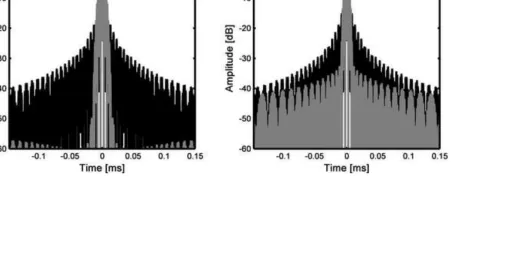
Figure 4 illustrates the effect of time and spectral windowing when applied to chirp signals. It
can be seen that time windowing of a linear chirp signal (on the left) provides very efficient
reduction in side-band levels, and exhibits a distinct central lobe. On the other hand, spectral
windowing of a non-liner chirp (to the right of the figure) ensures a resolution that is almost
the same as for the un-windowed linear chirp. It provides a significant reduction of the
side-band levels in the region close to the zero time point, while in the regions further away in
time the side-band levels are almost the same as for the un-windowed chirp.
Fig. 4 Comparison of the autocorrelation functions of chirp signals using both time
cases, the un-widowed signal is shown in black and the Gaussian-windowed chirp is shown
in grey.
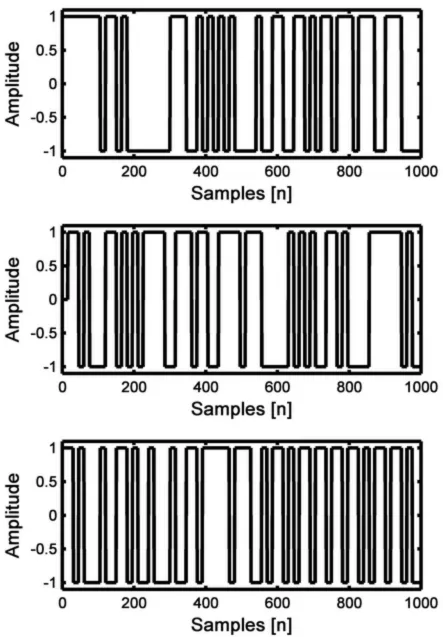
Binary sequences can also take various forms. Golay sequences have been used in the
past for ultrasonic measurements [25-26], and they exhibit the optimal auto-correlation
characteristics both in the cyclic and non-cyclic case. However, they have to be used in
pairs, and this aspect can be a limitation. This work has thus looked at other types of
sequences. Three examples are shown in Figure 5. These all use a frequency of 300 kHz to
represent a single bit within the sequences, but as can be seen, their appearance is very
different, depending on the generation scheme used.
Fig.5. Examples of three types of binary sequence, (a) MLS, (B) Legendre Sequence, (c)
Chaotic Sequence, that are useful for ultrasonic air-coupled signals, using a 300 kHz signal
to represent one bit. The horizontal axis is the number of sample points in the waveform.
There are advantages to each of these types of binary sequence. If AC systems are
considered, MLS and Legendre sequences allow the reconstruction of the impulse response
without bias, and they are also more effective from a computational point of view than Golay
sequences [27-29]. In particular, a fast transform exists for the MLS case, the
Fast-M-transform, and this can outperform the standard correlation calculation via an FFT [30]. This
could be important in real-time air-coupled imaging, for example. Note also that MLS and
related sequences can be used in multi-input / multi-output systems by exploiting their
pseudo-orthogonality [31]. Finally, MLS and Legendre sequences exhibit decimation
properties (in particular the Legendre sequences are decimable for any integer) and this
opens the possibility of sub-sampling the received signal efficiently in order to relax
hardware constraints. The research has also looked at Chaotic sequences. These gained
interest in communications systems, because of their flexible auto-correlation and
In the following, these signals will be compared for use in air-coupled ultrasound. Their
performance will be determined experimentally for various levels of noise, so that their
suitability in NDT can be determined.
3. EXPERIMENTAL INVESTIGATION OF MODULATION SCHEME PERFORMANCE
The experiments were performed using a pair of capacitive transducers, aligned on-axis
in air. These transducers have been described elsewhere [1,2], but can be used to generate
and detect ultrasonic signals in air with a high efficiency. They use a thin metallised Mylar
membrane attached to a micromachined backplate, and are designed to operate at
frequencies of up to 1 MHz. Note that at frequencies higher than this, ultrasonic attenuation
in air becomes very severe, limiting the range at which experiments can be performed for
NDE purposes. The experimental impulse response of these devices is shown in Fig. 6. It
can be seen that the experimental amplitude response for a pair of transducers peaks at
approximately 300 kHz, and this is the reason for selecting this frequency for the binary
sequences. The response also led to the choice of a frequency sweep range of 100 – 400
kHz for the chirp signals. The voltage drive signals were generated in LabViewTM software,
and sent to the transmitter via a National Instruments PXI system, as shown in Fig. 7. A DC
bias was applied to the transmitter via a decoupling circuit. Signals were transmitted across
the air gap, and detected by a capacitive transducer as an ultrasonic receiver. A charge
amplifier was used to provide amplification and a DC bias to the receiver, before being
recorded via the PXI system.
Fig. 6. Experimental ultrasonic transducer characteristics, showing (a) impulse response
and (b) corresponding spectrum
Fig. 7 Schematic diagram of the apparatus for experiments in air
The first experiments recorded signals that were transmitted by each of a set of sequences
across the air gap. This was done to determine the initial properties of the recorded signals in
driving voltage sequences, due to the amplitude and phase response of the transducers, the
effect of diffraction by the finite apertures of the transducers themselves, and
frequency-dependent ultrasonic attenuation in air. It was thus important to determine the actual
experimental response.
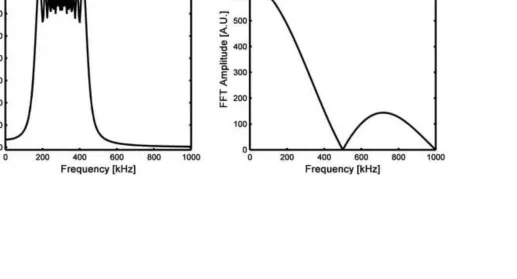
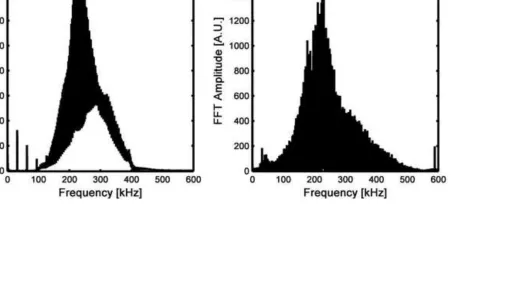
The experimental results can be illustrated by looking at two particular examples – a linear
chirp and an MLS binary sequence. Fig. 8 illustrates the spectral content of these two types of
signal used for the voltage drive waveforms. The chirp had a bandwidth defined by the
chosen start and finish frequencies (100 - 400 kHz), whereas the MLS sequence had a
spectrum resulting from the 300 kHz frequency used to define the repetition rate of a single
bit. These signals were used to drive the ultrasonic air-coupled transmitter, and the signals
detected by the receiver after propagation through air were recorded. The received
experimental spectra in each case are shown in Fig. 9. Note that, as expected from Fig. 8, the
MLS sequence exhibited the wider bandwidth. The received signal was now cross-correlated
with the input, and the results obtained are shown in Fig. 9. It is clear from these results that
the received MLS signal was not only an order of magnitude greater in amplitude, but that the
width of the main cross-correlation peak was narrower.
Fig. 8. Spectral content of (a) chirp and (b) MLS signals used to drive the transducers in
the experiments
Fig. 9. Received spectra derived from the ultrasonic waveforms of Fig. 7, for (a) chirp and
Fig.10. Cross-correlation outputs for experimental ultrasonic waveforms transmitted across
air, for (a) chirp and (b) MLS signals. Also labeled are areas defined as the near and far
regions of the outputs (see text).
The chirp and MLS signals were now examined for their performance in the presence of
noise. The SNR was estimated by introducing artificial Additive White Gaussian Noise
(AWGN) to the recorded data, before the cross-correlation/pulse compression procedure was
implemented. The SNR was then measured in two ways: by increasing the noise in the near
region (see Fig. 10), thereby investigating the influence of side lobes to the performance, and
by increasing the noise in the far region to quantify the effect of noise on measurement
resolution. The results are presented in Table 1. Here, the performance of MLS is compared
in relative terms to those of the standard and cyclic forms of linear and nonlinear chirps. As
previously indicated, in order to retrieve the impulse response of a system excited by a coded
signal, two algorithms can be exploited: Cyclic and non-Cyclic Algorithm (henceforth called
Standard). Cyclic algorithm exploits periodic excitation signal and process the steady-output
signal in order to retrieve the impulse response by Cyclic Cross-Correlation. In the Standard
Algorithm, the acquisition and cross-correlation is performed for a single shot of the excitation
signal. As described further, Cyclic algorithm ensure a better SNR of the measurement than
the Standard one, even if it introduces some constraints on the impulse response duration.
It is evident from Table 1 that all the signals achieved similar results, even though the
non-linear chirp worked better than the others in the suppression of near side-lobes, while the
standard linear chirp guarantee the best performances in the far side-lobe region. As an
example, if the amplitude of input signals is 1V, for MLS you can still distinguish signal from
noise in the near region at a value of 1/97 = 10.3 mV.
Table 1: Relative SNR levels in the near and far regions of the cross-correlation outputs
In order to explain the above results, consider first the binary sequences such as MLS.
E = A2T , (1)
noting that the duration of excitation is the same as that of the measurement. However, the
noise energy (Enoise) is given by
Enoise= σ2T. (2)
In the case of chirp signals, two types can be considered: those with a cyclic and those with
a standard acquisition algorithm. For the cyclic case, the duration of excitation is the same
as that of the measurement (as for the MLS binary sequence). However, now the excitation
signal energy is half that of the MLS sequence, whereas the noise energy is the same. In the
standard chirp measurement scheme, the excitation is ―on‖ for a time T, while the output
signal is measured for a time T + T1. The excitation signal energy is the same as for the
cyclic case, but now the noise energy is higher, and is given by
Enoise = σ2(T+T1) (3)
If the SNR values of the MLS sequence, the cyclic chirp and the standard chirp are SNRMLS,
SNRCYCLIC and SNRSTANDARD respectively, and if T1=T, it follows that
SNRMLS = A2/σ2; (4a)
SNRCYCLIC = A2/2σ2; (4b)
SNRSTANDARD = A2/4σ2. (4c)
This means that binary sequences such as MLS have the maximum theoretical SNR. In
order to fully exploit this higher input energy, both the amplifier and the transducers have to
match the broad bandwidth nature of the MLS sequence used, otherwise the overall energy
put into the system is reduced by exciting frequencies that are outside of the system band.
Table 1 shows that the actual SNR gain ensured by the pulse compression procedures is
fairly similar for binary sequences and chirp signals, although chirp signals obtain higher
values of SNR. Indeed the band-pass behavior of chirp signals counterbalances the higher
energy carried by MLS sequences by fitting better to the overall transfer function of the
experimental system, composed of the transducers and the amplifier. For the system
considered here, which uses broad bandwidth air-coupled transducers, this effect ensures
an extra factor of 2 in the SNR gain for the chirp signals with respect to MLS. This becomes
portion of the input energy can be transferred to the measurement system if a standard MLS
sequence is used. In contrast to this, the energy spectrum of a chirp signal can be tailored to
the transducer bandwidth. Hence, the input energy in this case is always almost effectively
delivered to the system, so that chirp signals are a good choice for transducers with a
narrow bandwidth.
Note that often it is desirable to use binary signals experimentally, both for hardware
reasons and for reduced computational costs. In addition, sub-modulation and spectrum
design techniques can also be applied, in order to further improve the resulting SNR. By
using such techniques, the binary sequences approach can be improved substantially.
4. THROUGH-TRANSMISSION ULTRASONIC EXPERIMENTS
Another important application of air-coupled ultrasonic systems is the NDE of solid samples.
Many characteristics can be measured, such as time of flight, attenuation, and thickness/
velocity changes, as well as the presence of defects or other structural changes. The
performance obtained will depend on the characteristics of the ultrasonic signal, and in
particular, the chosen waveform and processing methods. In Table 1 above, the relative
merits of the various approaches, based on MLs, linear and non-linear chirps, were
compared, and the linear cyclic chirp found to perform the best in terms of SNR. In the
following, their performance in actual air-coupled through-transmission experiments will be
examined. Here, a sample was placed normal to the ultrasonic beam, as shown in Fig. 11 for
a Plexiglas plate. This material has a longitudinal velocity of 2,700 ms-1, and plates of
thicknesses 0.1 mm, 1 mm and 5 mm were examined.
Fig. 11. Through-transmission experiments using a pair of capacitive ultrasonic transducers.
Figure 12 shows the cross-correlation outputs (equivalent to the impulse response of the
whole measurement system) for the MLS signal and the three thicknesses of Plexiglas. The
two responses are effectively similar for the two thinner samples. This is because their
thickness is small enough that the frequency of the sample’s fundamental resonance (at ~1.3
MHz for a 1mm thickness) is above that of the highest frequencies transmitted. At a thickness
of 5 mm, however, where the solid plate through-thickness resonance would be expected at
~257 kHz, the impulse response is that of a decaying resonance. This is exactly what would
Fig. 12. Impulse response for the MLS sequence for three different thicknesses of Plexiglas:
(a) 0.1 mm, (b) 1mm and (c) 5 mm.
Fig. 13 shows the equivalent response for the standard linear chirp signal. Note that now the
impulse response for the 0.1 mm and 1 mm thick samples is of a different form to that for the
MLS sequence, as expected. Note again that there is no evidence of a through-thickness
resonance, simply a well-behaved time impulse with a very good SNR which is better than
that from the MLS sequence (a trend in agreement with the results shown in Table 1). For a 5
mm thick plate, the response is closer to a step function, with a fast rise and a slower fall, the
latter indicative of the form of the through-thickness resonance within the plate.
Fig. 13. Impulse response for the standard linear chirp signal for three different thicknesses of
Finally, the results for the standard non-linear chirp are presented in Fig. 14. Note that the
response is similar in form to that from the linear chirp, shown in Fig. 13. However, there is a
less rapid rise in the initial response for the 5 mm thick sample, and a cleaner ―tail‖ with
evidence of the resonance seen in Fig. 12 (c) as a small modulation of the decaying
amplitude.
Fig. 14. Impulse response for the standard non linear chirp signal for three different
thicknesses of Plexiglas: (a) 0.1 mm, (b) 1mm and (c) 5 mm.
It is interesting to look at the frequency spectra corresponding to the impulse responses for
the 5 mm thick Plexiglas sample, and these are shown in Fig. 15 for the three signals. All
three have produced a good spectral response, indicating that the frequency of resonance
could be estimated from the peak value. Both MLS and the linear chirp give thickness values
of 5.2 mm, assuming a longitudinal velocity of 2,700 ms-1, and the non-linear chirp estimates
the value at 5.3 mm. However, the larger received amplitude of the impulse response for the
MLS sequence (Fig. 12 (c)), and the narrower spectral response, shows that it represents the
induced resonance more accurately, and is thus the preferred waveform for thickness
measurements.
Fig. 15. Frequency spectra arising from the impulse responses for the 5 mm thick Plexiglas
plate: (a) MLS, (b) linear chirp and (c) non-linear chirp. All vertical scales are arbitrary.
CONCLUSIONS
This paper has demonstrated that the types of signal used for air-coupled ultrasound must
be chosen with care. The results have demonstrated that it is extremely important that the
type of excitation signal used is chosen so as to match the bandwidth available in the
experimental system. With respect to the enhancement of the SNR, MLS and Chirp signals
achieve very similar results for wide bandwidth measurements. For a narrower available
introduced into the MLS sequence. For Time-of-Flight measurement, the MLS has been
seen to be the best choice. It gives the highest received amplitude, and the shortest impulse
response when used in a through-transmission measurement. For defect detection purpose,
where very low side-bands level are needed, linear and non-linear windowed chirps appear
as the best solution.
ACKNOWLEDGEMENTS
MR and SL gratefully acknowledge Prof. Pietro Burrascano for his scientific support and
PRIN 2009 project ―Diagnostica non ditruttiva ad ultrasuoni tramite sequenze pseudo-ortogonali per imaging e classificazione automatic di prodotti industriali‖ for financial support.
REFERENCES
[1] Hutchins DA, Neild A, ―Air-borne ultrasound transducers‖, in Ultrasonic Transducers, K. Nakamura ed., Woodhead publishers (2012).
[2] Lionetto F, Tarzia A, Maffezzoli A. Air-coupled ultrasound: a novel technique for monitoring the curing of thermosetting matrices. IEEE Trans Ultrason Ferroelectr Freq Control. 54 (2007)1437.
[3] Castaings M, Cawley P, Farlow R, Hayward G, ―Single Sided Inspection of Composite Materials Using Air Coupled Ultrasound‖, Journal of Nondestructive Eval. 17 (998) 37.
[4] Kazys R, Demcenko A, Zukauskas E, Mazeika L. Air-coupled ultrasonic investigation of multi-layered composite materials. Ultrasonics. 44 Suppl. 1 (2006) 819.
[5] Masmoudi M, Castaings M. Three-dimensional hybrid model for predicting air-coupled generation of guided waves in composite material plates. Ultrasonics 52 (2012) 81.
[6] Pallav P, Hutchins DA, Gan TH. Air-coupled ultrasonic evaluation of food materials, Ultrasonics 49 (2009) 244.
[7] Delrue S, Van Den Abeele K, Blomme E, Deveugele J, Lust P, Matar OB. Two-dimensional simulation of the single-sided air-coupled ultrasonic pitch-catch technique for non-destructive testing. Ultrasonics 50 (2010) 188.
[8] Hosten B, Biateau C. Finite element simulation of the generation and detection by air-coupled transducers of guided waves in viscoelastic and anisotropic materials. Acoust Soc Am. 123 (2008) 1963.
[9] Castaings M, Hosten B. Lamb and SH waves generated and detected by air-coupled ultrasonic transducers in composite material plates. NDT&E International 34 (2001) 249. [10] Hosten B, Hutchins DA, Schindel DW. Air-Coupled Ultrasonic Bulk Waves to Measure Elastic Constants in Composite Materials, Review of Progress in Quant. NDE, (1996) 1075. [11] Hosten B, Hutchins DA, Schindel DW. Measurement of elastic constants in composite materials using air-coupled ultrasonic bulk waves. J. Acoust. Soc. Am. 99 (1996) 2116. [12 ] Castaings M, Hosten B. Air-coupled measurement of plane wave, ultrasonic plate transmission for characterising anisotropic, viscoelastic materials. Ultrasonics 38 (2000) 781. [13] Dahmen S, Ketata H, Ben Ghozlen MH, Hosten B. Elastic constants measurement of anisotropic Olivier wood plates using air-coupled transducers generated Lamb wave and ultrasonic bulk wave. Ultrasonics. 50 (2010) 502.
[15] Schindel DW, Bashford AG, Hutchins DA. Chromatic aberration of an air-coupled ultrasonic Fresnel zone-plate‖. IEEE Trans. Ultras. Ferr. Freq. Contr. 46 (1999) 242.
[16] Hosten B, Castaings M. Parabolic mirror and air-coupled transducer for multimodal plate wave detection. Review of Progress in Quantitative Nondestructive Evaluation, edited by D. O. Thompson and D. E.Chimenti , AIP Press, New York, Vol. 22 (2002) 1243.
[17] Gan TH, Hutchins DA, Billson DR, Schindel DW. High resolution air-coupled imaging of thin materials. IEEE Trans. Ultras. Ferr. Freq. Contr. 50 (2003) 1516.
[18] Holland SD, Teles SV,. Chimenti DE. Air-coupled, focused ultrasonic dispersion spectrum reconstruction in plates. J. Acoust. Soc. Am. 115 (2004) 2866.
[19] Kelly SP, Farlow R, Hayward G. Applications of through-air ultrasound for rapid NDE scanning in the aerospace industry. IEEE Tran. Ultras. Ferr. Freq. Control. 43 (1996) 581. [20] Gan TH, Hutchins DA, Green RJ, Andrews M, Harris PD., Non-contact high-resolution ultrasonic imaging of wood samples using coded chirp waveforms. IEEE Trans. Ultras. Ferr. Freq. Contr. 52 (2005) 280.
[21] Yanez Y, Garcia-Rodriguez M, Garcia-Hernandez MJ; J. Salazar, Turo A, Chavez JA. Lamb Wave Generation with an Air-Coupled Piezoelectric Array Using Different Square Chirp Modulation Schemes. Proc. 2007 IEEE Ultrasonics Symposium, 1844.
[22] Pallav P, Gan TH, Hutchins DA. Elliptical-Tukey chirp signal for high-resolution, air-coupled ultrasonic imaging. IEEE Trans. Ultras. Ferroelect. Freq. Contr. 54 (2007) 1530. [23] Ricci M, Senni L, Burrascano P, Borgna R, Neri S, Calderini M. Pulse-compression ultrasonic technique for the inspection of forged steel with high attenuation. Insight 54 (2012) 91.
[24] Pollakowski M, Ermert H. Chirp signal matching and signal power optimization in pulse-echo mode ultrasonic nondestructive testing. IEEE Trans. Ultrason., Ferroelectr., Freq. Control. 41 (1994) 655.
[25] Golay MJE. Complementarv Series, IRE Trans. on Information Theory, IT-7 (1961) 82. [26] Garcia-Rodriguez M, Yañez Y, Garcia-Hernandez MJ, Salazar J, Turo A, Chavez JA. Application of Golay codes to improve the dynamic range in ultrasonic Lamb waves air-coupled systems. NDT & E Intl. 43 (2010) 677.
[27] Golomb S. Shift Register Sequences. San Francisco, CA: Holden-Day, 1967.
[28] Schroeder M R. Integrated-impulse method measuring sound decay without using impulses. J. Acoust. Soc. Amer. 66 (1979) 497.
[29] Ricci M, Senni L, Burrascano P. Exploiting Pseudorandom Sequences to Enhance Noise Immunity for Air-Coupled Ultrasonic Nondestructive Testing. IEEE Trans. Instr. Meas. 61 (2012) 11.
[30] Cohn M, Lempel A. On fast M-sequence transforms. IEEE Trans. Inf. Theory IT-23 (1977) 135.
[31] Sarwate D V, Pursley M B. Cross-correlation properties of pseudo-random and related sequences. Proc. IEEE, 68 (1980) 593.
Figure 1
Figure 2
Figure 3
Figure 4
Figure 5
Figure 6
Figure 7
Figure 8
Figure 9
Figure 10
Figure 11
Figure 12
Figure 13
Figure 14
Figure 15
Field Region
Type of signal
MLS
Standard linear chirp
Cyclic linear chirp
Standard non-linear chirp
Cyclic non-linear chirp
Near 97 98 103 104 105
[image:33.595.105.494.72.173.2]Far 97 112 111 104 105
We demonstrate that pulse compression is a powerful tool for air-coupled ultrasound The result is very dependent on the choice of waveform used
Binary sequences are a good choice where a wide bandwidth is available More limited bandwidths are best suited to the use of chirps