http://wrap.warwick.ac.uk
Original citation:
Gong, Jian, Campos, Hannia, Fiecas, Mark, McGarvey, Stephen T, Goldberg, Robert,
Richardson, Caroline and Baylin, Ana. (2013) A case-control study of physical activity
patterns and risk of non-fatal myocardial infarction. BMC Public Health, Volume 13
(Number 1). Article number 122. ISSN 1471-2458
Permanent WRAP url:
http://wrap.warwick.ac.uk/64455
Copyright and reuse:
The Warwick Research Archive Portal (WRAP) makes this work of researchers of the
University of Warwick available open access under the following conditions.
This article is made available under the Creative Commons Attribution 2.0 Generic (CC
BY 2.0) license and may be reused according to the conditions of the license. For more
details see:
http://creativecommons.org/licenses/by/2.0/
A note on versions:
The version presented in WRAP is the published version, or, version of record, and may
be cited as it appears here.
R E S E A R C H A R T I C L E
Open Access
A case-control study of physical activity patterns
and risk of non-fatal myocardial infarction
Jian Gong
1, Hannia Campos
2, Mark Joseph A Fiecas
3, Stephen T McGarvey
1, Robert Goldberg
4,
Caroline Richardson
5and Ana Baylin
1,6*Abstract
Background:The interactive effects of different types of physical activity on cardiovascular disease (CVD) risk have not been fully considered in previous studies. We aimed to identify physical activity patterns that take into account combinations of physical activities and examine the association between derived physical activity patterns and risk of acute myocardial infarction (AMI).
Methods:We examined the relationship between physical activity patterns, identified by principal component analysis (PCA), and AMI risk in a case-control study of myocardial infarction in Costa Rica (N=4172), 1994-2004. The component scores derived from PCA and total METS were used in natural cubic spline models to assess the association between physical activity and AMI risk.
Results:Four physical activity patterns were retained from PCA that were characterized as the rest/sleep,
agricultural job, light indoor activity, and manual labor job patterns. The light indoor activity and rest/sleep patterns showed an inverse linear relation (Pfor linearity=0.001) and a U-shaped association (Pfor non-linearity=0.03) with AMI risk, respectively. There was an inverse association between total activity-related energy expenditure and AMI risk but it reached a plateau at high levels of physical activity (Pfor non-linearity=0.01).
Conclusions:These data suggest that a light indoor activity pattern is associated with reduced AMI risk. PCA provides a new approach to investigate the relationship between physical activity and CVD risk.
Keywords:Physical activity patterns, Myocardial infarction, Costa Rica
Background
Numerous observational epidemiologic studies have demonstrated that physical activity is inversely related to cardiovascular morbidity and mortality [1-4]. Physical activity may contribute up to 20% - 30% reduced risk of coronary heart disease [5,6]. However, studies have shown that different types of physical activities may have different effects on the risk of cardiovascular disease (CVD) and may interact together [7-12]. For example, some leisure time activities such as walking, stair climbing, and cycling provide protection against CVD [7-12], whereas others, such as intensive domestic physical activity, may not offer protection against CVD [11]. There are also interactive
effects between lack of exercise and sitting at work and between demanding household work and sitting at work on the association with increased risk of acute myocardial infarction (AMI) [9]. Therefore, if we use a single sum-mary measurement to reflect physical activity, such as METS, the association between physical activity and risk of CVD might be biased because subjects who have the same measured value may have a distinct combination of physical activities. Furthermore, studying different types of physical activity in isolation may not adequately consider any joint and interactive associations on the risk of CVD.
Previous models that incorporate one type of physical activity of interest and other types of physical activity (as potential confounders) for exploring the effects of each type of physical activity on CVD may be problematic because of the concomitant change in total physical ac-tivity. As one type of physical activity increases, total physical activity increases as well, given that the other
* Correspondence:[email protected]
1
Department of Community Health, Brown University, Providence, RI 02912, USA
6
Department of Epidemiology, School of Public Health, University of Michigan, Ann Arbor, MI 48109, USA
Full list of author information is available at the end of the article
© 2013 Gong et al.; licensee BioMed Central Ltd. This is an Open Access article distributed under the terms of the Creative Commons Attribution License (http://creativecommons.org/licenses/by/2.0), which permits unrestricted use, distribution, and reproduction in any medium, provided the original work is properly cited.
physical activities are fixed. Hence, the effect estimate of one type of physical activity does not present its pure ef-fect, but includes the effects of total physical activity.
In order to overcome these challenges in the analysis of physical activity data, we used the method of principal component analysis (PCA) [13] to identify physical activity patterns that take into account combinations of physical activities. We used both parametric and semi-parametric regression models to examine the association between derived physical activity patterns and risk of acute myocar-dial infarction (AMI). Data from a population-based, case-control study in Costa Rica were utilized for purposes of this investigation.
Methods
Study population
In Costa Rica, CVD has been the country’s leading cause of death since 1970 and the mortality rate for CVD has been declining since 2002 according to 2007 Health in the Americas, a report from World Health Organization. The participants in this study are cases and controls from a case-control study of non-fatal myocardial infarc-tion conducted in the Central Valley in Costa Rica from 1994 to 2004. The study design and population have been described previously [14,15]. In brief, eligible cases were men and women who were diagnosed as survivors of a first AMI by two independent cardiologists at any of the six recruiting hospitals in the Central Valley of Costa Rica during the period 1994-2004. All cases met the World Health Organization criteria for AMI [16]. Enroll-ment was carried out while cases were in the hospital’s step-down-unit. One free-living control subject for each case, matched for age (± 5 years), sex, and area of resi-dence (county), was randomly selected using information available at the National Census and Statistics Bureau of Costa Rica. Participation rates were 98% for cases and 88% for controls. Cases and controls provided informed consent on documents approved by the Human Subjects Committee of the Harvard School of Public Health and the University of Costa Rica.
Data collection
Trained interviewers visited all study participants at their homes for purposes of collecting sociodemographic characteristics, physical activity, lifestyle, medical history, smoking, and dietary data by use of a standardized ques-tionnaire [15]. They visited cases, on average, within 3 weeks of hospital discharge (for controls, hospital dis-charge of the corresponding case subject) and when pos-sible, by the same interviewer. Identical questionnaires and data collection procedures were used for cases and controls. The standardized activity questionnaire con-sisted of 18 questions and physical activity was determined by asking subjects the average frequency and time spent
[image:3.595.305.538.450.725.2]on several occupational and leisure time activities during the last year. These activities were grouped into six categories according to their intensity or metabolic equivalents (METs): lying quietly in bed: afternoon nap or rest and night sleep (0.9 METs); sitting (1.0 METs); light indoor activity such as standing at work or at home (2.4 METs); moderate outdoor activity such as gardening, light agriculture and construction, and walking on flat sur-faces (3.6 METs); vigorous aerobic activity such as heavy agriculture and construction, walking uphill, climbing stairs, jogging and other sports (7.1 METs); strenuous an-aerobic activity such as carrying, pushing and lifting heavy objects (7.8 METs). Energy expenditure for each activity was calculated as the product of frequency, time, and in-tensity (METs). Total activity-related energy expenditure per day was calculated by the sum of energy expenditure on each activity listed in our questionnaire and was mea-sured by total METs of activity performed each day. This questionnaire was previously used in a study of 465 people conducted in Costa Rica [17,18]. The data showed that the reported time spent on different types of daily activ-ities using the questionnaire predicted higher fitness scores, lower LDL levels, and lower BMI. These results allow us to consider that the predictive validity of the questionnaire is reasonable.
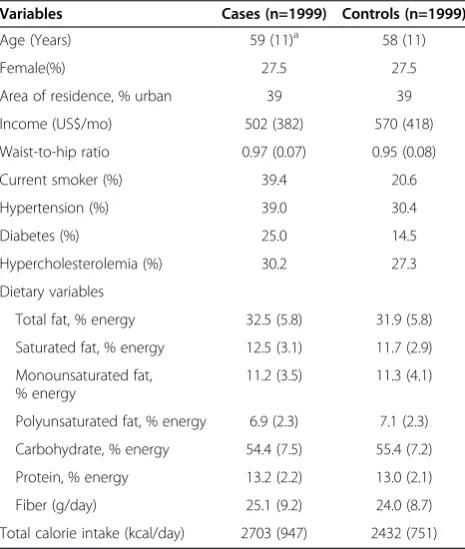
Table 1 Basic characteristics of first AMI survivors and matched controls in a case control study, Costa Rica, 1994 - 2004
Variables Cases (n=1999) Controls (n=1999)
Age (Years) 59 (11)a 58 (11)
Female(%) 27.5 27.5
Area of residence, % urban 39 39 Income (US$/mo) 502 (382) 570 (418) Waist-to-hip ratio 0.97 (0.07) 0.95 (0.08)
Current smoker (%) 39.4 20.6
Hypertension (%) 39.0 30.4
Diabetes (%) 25.0 14.5
Hypercholesterolemia (%) 30.2 27.3 Dietary variables
Total fat, % energy 32.5 (5.8) 31.9 (5.8) Saturated fat, % energy 12.5 (3.1) 11.7 (2.9) Monounsaturated fat,
% energy
11.2 (3.5) 11.3 (4.1)
Polyunsaturated fat, % energy 6.9 (2.3) 7.1 (2.3) Carbohydrate, % energy 54.4 (7.5) 55.4 (7.2) Protein, % energy 13.2 (2.2) 13.0 (2.1) Fiber (g/day) 25.1 (9.2) 24.0 (8.7) Total calorie intake (kcal/day) 2703 (947) 2432 (751)
a
Data analysis
All analyses were carried out with SAS (Version 9.1; SAS Institute, Cary, NC). The original sample size was com-posed of 2,273 cases and 2,274 controls. A total of 274 cases and 275 controls were excluded due to missing in-formation on physical activity and the covariates in the data analysis (n=139), implausible total activity-related energy expenditure (> 2 SD from the mean energy ex-penditure, n=187), and losing matched controls/cases
[image:4.595.57.540.114.251.2]after performing rematching based on the original match-ing criteria (n=223). The final study sample consisted of 1999 case-control pairs (total n=3998). We used PCA on the 18 questions of the standardized activity questionnaire to identify physical activity patterns. The components (i.e. physical activity patterns) were extracted using an or-thogonal matrix to achieve a simple structure that facili-tates interpretability and makes the derived patterns independent of each other. The following three criteria
Table 2 Activity-related energy expenditure and time spent on different daily activities in a case control study, Costa Rica, 1994 - 2004
Activity-related energy expenditure (METs/day) Time(h:min/day)
Cases Controls Cases Control
All physical activities 30.9 (13.3)a 32.4 (12.9) 21:01 (5:17) 21:30 (5:01)
Sitting 4.5 (5.5) 4.5 (5.5) 4:30 (5:30) 4:30 (5:30)
Lying and napping 1.5 (2.3) 1.2 (2.1) 1:41 (2:17) 1:17 (2:17)
Light indoor activities 10.4 (13.6) 10.7 (12.7) 4:30 (6:00) 4:38 (5:30) Light-moderate activities 1.3 (5.2) 1.6 (5.0) 0:30 (1:37) 0:35 (1:28)
Vigorous activities 0.2 (1.3) 0.3 (1.2) 0:01 (0:10) 0:02 (0:09)
Sports 0.0 (0.0) 0.0 (1.3) 0:00 (0:00) 0:00 (0:13)
Sleeping 6.3 (1.8) 6.3 (1.8) 7:00 (2:00) 7:00 (2:00)
a
Median (interquartile range).
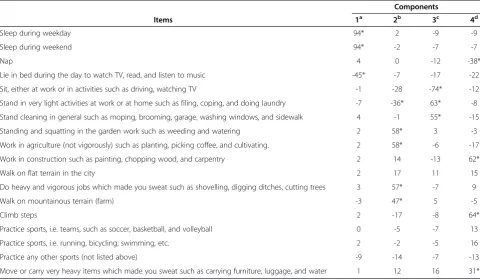
Table 3 Physical activity patterns from PCA in a case control study, Costa Rica, 1994 - 2004
Components
Items 1a 2b 3c 4d
Sleep during weekday 94* 2 -9 -9
Sleep during weekend 94* -2 -7 -7
Nap 4 0 -12 -38*
Lie in bed during the day to watch TV, read, and listen to music -45* -7 -17 -22 Sit, either at work or in activities such as driving, watching TV -1 -28 -74* -12 Stand in very light activities at work or at home such as filing, coping, and doing laundry -7 -36* 63* -8 Stand cleaning in general such as moping, brooming, garage, washing windows, and sidewalk 4 -1 55* -15 Standing and squatting in the garden work such as weeding and watering 2 58* 3 -3 Work in agriculture (not vigorously) such as planting, picking coffee, and cultivating. 2 58* -6 -17 Work in construction such as painting, chopping wood, and carpentry 2 14 -13 62*
Walk on flat terrain in the city 2 17 11 15
Do heavy and vigorous jobs which made you sweat such as shovelling, digging ditches, cutting trees 3 57* -7 9
Walk on mountainous terrain (farm) -3 47* 5 -5
Climb steps 2 -17 -8 64*
Practice sports, i.e. teams, such as soccer, basketball, and volleyball 0 -5 -7 13
Practice sports, i.e. running, bicycling, swimming, etc. 2 -2 -5 16
Practice any other sports (not listed above) -9 -14 -7 -13
Move or carry very heavy items which made you sweat such as carrying furniture, luggage, and water 1 12 16 31*
a
Rest/sleep pattern;bagricultural job pattern;clight indoor activity patter;dmanual labor job pattern.
Note: Component loadings are multiplied by 100 and rounded to the nearest integer. Values greater than 0.3 are flagged by an '*'. The patterns are named based on activities that have high positive loadings, for example the agricultural job pattern have high positive loadings on activities like“standing and squatting in the garden work”or“work in agriculture”, while it has high negative loadings in activities that are more representative of other patterns (i.e.“Stand in very light activities at work or at home such as filing, coping, and doing laundry”).
Gonget al. BMC Public Health2013,13:122 Page 3 of 10
[image:4.595.57.538.412.692.2]were used to determine the number of components to re-tain: the criterion of eigenvalues exceeding one, the scree plot, and the interpretability of each component [13]. The component score of each pattern for each subject was cal-culated by summing the hours spent on physical activities weighted by their component loadings. The higher com-ponent scores indicate better adherence to a certain phys-ical activity pattern. As part of a sensitivity analysis, we performed PCA stratified by sex.
We used paired t-tests and McNemar tests to compare means and proportions between cases and controls, given the matched design. We used parametric regression mod-els (conditional logistic regression) and semi-parametric regression models (natural cubic splines) to assess the as-sociation of AMI risk with extracted physical activities patterns and total activity-related energy expenditure. In the parametric regression models, component scores of each extracted pattern and total activity-related energy ex-penditure (total METs per day) were divided into quintiles. Quintiles of those variables were entered in multivariate conditional logistic regression analysis to calculate odds ratios (OR) and 95% confidence intervals. Tests for trend were derived from conditional logistical regression with a single term representing the medians of quintiles 1-5. In semi-parametric regression models, natural cubic splines were fitted to conditional logistic regression models to examine the relationship between total activity-related en-ergy expenditure and risk of AMI and the association be-tween extracted physical activity patterns and risk of AMI. Natural cubic splines are smooth polynomial functions that can be used to fit data and accommodate potential changes in the direction of the association across the dis-tribution of an exposure. They are useful to examine non-parametrically the potential non-linear relation between the exposure and the outcome of interest. They are con-structed of piecewise third-order polynomials which pass through a set of control points and it is linear in its tail be-yond the boundary knots [19-21]. Since they are numer-ically stable and allow computation of fit with great accuracy, natural cubic splines are widely used in semi-parametric regression. A SAS macro named‘lgtphcurv9’ [22] was used which implements natural cubic spline methodology to fit potential non-linear dose-response curves in logistic regression models. Likelihood ratio tests were performed to test non-linear and linear rela-tions [22]. In semi-parametric regression models, the median value of the first quintile of exposure was used as reference.
Results
The baseline characteristics of the study population are shown in Table 1. Compared to controls, cases had lower annual income and higher total daily caloric intake. Cases were more likely to be current smokers, have hypertension,
diabetes, hypercholesterolemia, and a sedentary lifestyle. The median total activity-related energy expenditure was 30.9 METs/day (interquartile range: 13.3) for cases and 32.4 METs/day (interquartile range: 12.9) for controls (Table 2). Cases spent more time on lying and napping compared to controls. In contrast, controls spent more time on light in-door activities and light-moderate activities (Table 2).
[image:5.595.306.539.422.725.2]The loadings for the first four components of our PCA are presented in Table 3. The first pattern had high posi-tive loadings on sleep measures and high negaposi-tive load-ings on lying in bed during the day to watch TV, read books, or listen to music, and we labeled it as the rest/ sleep pattern. The second pattern had high positive load-ings on items which are used to measure activities relevant to gardening and farming and high negative loadings on standing in very light activities at work or at home, and we labeled it as the agricultural job pattern. The third pattern had high positive loadings on items which are related to activities performed in the office or at home (i.e. high positive loadings on standing and moving and high negative loadings on sitting in the office or at home), and we labeled it as the light indoor activity pattern. The last pattern had high positive load-ings on items which are used to assess activities related
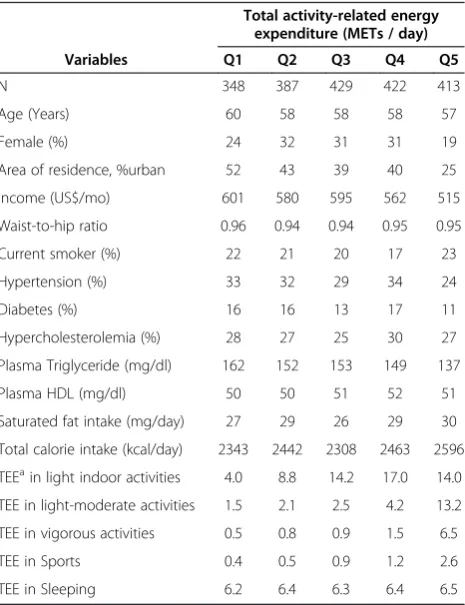
Table 4 Characteristics by quintiles of total activity-related energy expenditure (METs/day) among controls in a case control study, Costa Rica, 1994 - 2004
Total activity-related energy expenditure (METs / day)
Variables Q1 Q2 Q3 Q4 Q5
N 348 387 429 422 413
Age (Years) 60 58 58 58 57
Female (%) 24 32 31 31 19
Area of residence, %urban 52 43 39 40 25 Income (US$/mo) 601 580 595 562 515 Waist-to-hip ratio 0.96 0.94 0.94 0.95 0.95
Current smoker (%) 22 21 20 17 23
Hypertension (%) 33 32 29 34 24
Diabetes (%) 16 16 13 17 11
Hypercholesterolemia (%) 28 27 25 30 27 Plasma Triglyceride (mg/dl) 162 152 153 149 137
Plasma HDL (mg/dl) 50 50 51 52 51
Saturated fat intake (mg/day) 27 29 26 29 30 Total calorie intake (kcal/day) 2343 2442 2308 2463 2596 TEEain light indoor activities 4.0 8.8 14.2 17.0 14.0 TEE in light-moderate activities 1.5 2.1 2.5 4.2 13.2 TEE in vigorous activities 0.5 0.8 0.9 1.5 6.5
TEE in Sports 0.4 0.5 0.9 1.2 2.6
TEE in Sleeping 6.2 6.4 6.3 6.4 6.5
a
to construction (e.g. painting, chopping wood, roofing, moving or carrying heavy items, climbing steps, etc.) and high negative loadings on napping, and we labeled it as the manual labor job pattern. We performed PCA strati-fied by sex. There was no manual labor pattern in women, but the other three physical activity patterns were similar between women and men. Thus, we only report the results from the combined analysis to maximize power.
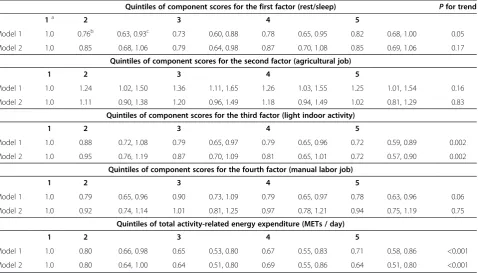
Increased activity-related energy expenditure was asso-ciated with area of residence, less annual income, hyper-tension, higher saturated fat intake, and higher total calorie intake per day among controls (Table 4). Table 5 summarizes conditional logistic regression models that were used to evaluate the associations between four extracted physical activity patterns, total activity-related energy expenditure, and risk of AMI. The first models were controlled by matching factors (age, sex, and area of residence), and the fully adjusted models were con-trolled by matching factors plus adjustment for annual income, smoking status, and saturated fat intake per day. Among the four extracted physical activity patterns, only the light indoor activity pattern was significantly asso-ciated with AMI risk. As compared to subjects in the lowest level of component score, the OR for those in the highest level was 0.72 (95% CI: 0.59, 0.89; Pfor trend = 0.002) in the model adjusted for matching factors. This
association remained statistically significant in the fully adjusted model (OR = 0.72, 95% CI: 0.57, 0.90; P for trend =0.002). However, we observed a U-shaped relation-ship between the rest/sleep pattern and AMI risk. In the fully adjusted model, compared to subjects in the first quintile of component score, the ORs were 0.85 (95% CI: 0.68, 1.06) for subjects in the second quintile, 0.79 (95% CI: 0.64, 0.98) in the third quintile, 0.87 (95% CI: 0.70, 1.08) in the fourth quintile, and 0.85 (95% CI: 0.69, 1.06) in the highest quintile. No statistically significant associa-tions were found between the remaining two physical ac-tivity patterns (agricultural job and manual labor job) and risk of AMI. Total activity-related energy expenditure was negatively associated with risk of AMI. The OR for sub-jects in the highest vs. lowest category was 0.71 (95% CI: 0.58, 0.86;P for trend < 0.001) in the model adjusted for matching factors. This association did not change in the fully adjusted model.
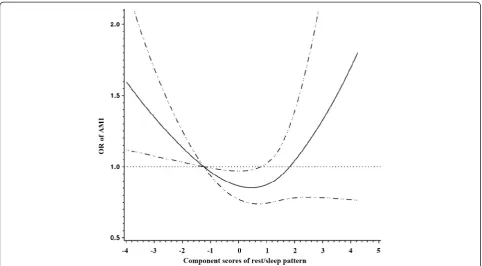
[image:6.595.61.540.435.708.2]To further explore the association of AMI risk with the rest/sleep pattern, the light indoor activity pattern, and total activity-related energy expenditure, we fitted natural cubic splines. Models were controlled for the matching factors and potential confounders including an-nual income, smoking status, and daily saturated fat intake. As shown in Figure 1, there was a non linear relationship (a U-shaped relation) between the rest/sleep pattern and
Table 5 Odds ratios and 95% confidence interval for AMI according to quintiles of scores for four physical activity patterns and daily total activity-related energy expenditure in a case control study, Costa Rica, 1994 - 2004
Quintiles of component scores for the first factor (rest/sleep) Pfor trend
1a 2 3 4 5
Model 1 1.0 0.76b 0.63, 0.93c 0.73 0.60, 0.88 0.78 0.65, 0.95 0.82 0.68, 1.00 0.05 Model 2 1.0 0.85 0.68, 1.06 0.79 0.64, 0.98 0.87 0.70, 1.08 0.85 0.69, 1.06 0.17
Quintiles of component scores for the second factor (agricultural job)
1 2 3 4 5
Model 1 1.0 1.24 1.02, 1.50 1.36 1.11, 1.65 1.26 1.03, 1.55 1.25 1.01, 1.54 0.16 Model 2 1.0 1.11 0.90, 1.38 1.20 0.96, 1.49 1.18 0.94, 1.49 1.02 0.81, 1.29 0.83
Quintiles of component scores for the third factor (light indoor activity)
1 2 3 4 5
Model 1 1.0 0.88 0.72, 1.08 0.79 0.65, 0.97 0.79 0.65, 0.96 0.72 0.59, 0.89 0.002 Model 2 1.0 0.95 0.76, 1.19 0.87 0.70, 1.09 0.81 0.65, 1.01 0.72 0.57, 0.90 0.002
Quintiles of component scores for the fourth factor (manual labor job)
1 2 3 4 5
Model 1 1.0 0.79 0.65, 0.96 0.90 0.73, 1.09 0.79 0.65, 0.97 0.78 0.63, 0.96 0.06 Model 2 1.0 0.92 0.74, 1.14 1.01 0.81, 1.25 0.97 0.78, 1.21 0.94 0.75, 1.19 0.75
Quintiles of total activity-related energy expenditure (METs / day)
1 2 3 4 5
Model 1 1.0 0.80 0.66, 0.98 0.65 0.53, 0.80 0.67 0.55, 0.83 0.71 0.58, 0.86 <0.001 Model 2 1.0 0.80 0.64, 1.00 0.64 0.51, 0.80 0.69 0.55, 0.86 0.64 0.51, 0.80 <0.001
a
The first quintile as reference group;b
odds ratio;c
95% confidence interval. Model 1: adjusted for matching factors (age, sex, and area of residence).
Model 2: adjusted for matching factors, smoking status, annual income, and total saturated fat intake per day.
Gonget al. BMC Public Health2013,13:122 Page 5 of 10
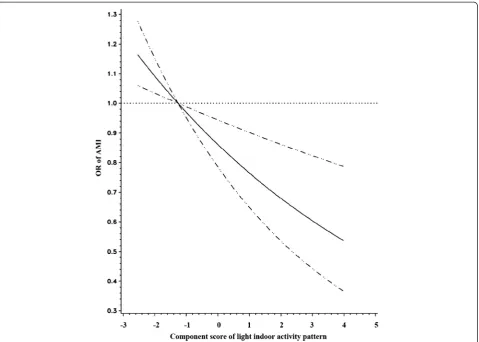
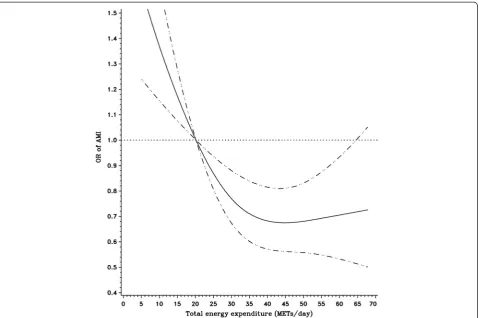
risk of AMI (Pvalue for the non-linearity = 0.03). Consist-ent with the parametric models, there was an inverse lin-ear association between the light indoor activity pattern and risk of AMI (Pvalues for linear relation test = 0.001) (Figure 2). Figure 3 shows that the risk of AMI declined with the increase of total activity-related energy expend-iture, but flattened out at high levels of physical activity (Pvalue for the non-linearity = 0.01).
Discussion
Four major physical activity patterns were identified from PCA in this Costa Rican population. The light in-door activity pattern was linearly and inversely asso-ciated with risk of AMI, whereas a U-shaped association was found for the rest/sleep pattern. No association was found between the agricultural job pattern and the man-ual labor job pattern and risk of AMI. In addition, we observed an inverse relationship between total activity-related energy expenditure and AMI risk that reached a plateau at high levels.
In this study, we utilized two approaches for exposure-response modeling: quintile presentation of the exposure and continuous presentation of the exposure fitting semi-parametric models. Compared to the former approach, the latter one has several advantages: no need for the se-lection of cut-points to categorize exposure, which can
influence the shape of a fitted dose-response curve; no power loss; and ease of comparisons across studies [20,23]. The results from these two analytic approaches were consistent, indicating that semi-parametric models are valuable and powerful to explore the shape of an exposure-response relationship.
[image:7.595.57.540.88.354.2]and BMI were not associated in this population (data not shown)
Study results on the association between domestic physical activity and CVD risk vary from protective [9] to null [11]. Likewise, studies on the effects of occupa-tional related physical activity on the risk of CVD also have shown inconsistent results ranging from protective effects [29,30] and null effects [31,32], to harmful effects [33,34]. These inconsistencies might be due to residual confounding effects, distinct definitions of domestic or occupational physical activity, measurement error, and different characteristics of the study population. In our study, the occupational physical activities in the light in-door activity pattern mainly correlated positively with standing and moving at work and inversely with sitting. These activities have been associated with a lower risk of CVD in previous studies [7,9]. On the other hand, the light indoor activity pattern did not include some strenu-ous or very strenustrenu-ous work (e.g. lifting, carrying, and planting workload), which have been found to increase the risk of AMI [9]. We found no associations between
the agricultural job pattern and the manual labor job pat-tern and risk of AMI. While walking and climbing steps could provide beneficial effects on CVD [9,12], some strenuous or very strenuous work such as lifting, carrying, and planting could increase the risk of AMI [9]. Thus, it is possible that the protective effects of some activities in the agricultural job and manual labor job patterns, such as walking and climbing steps, are overshadowed by the po-tential detrimental effects of some very strenuous activities such as lifting and carrying. It is noteworthy that agricul-tural and manual labor jobs in Costa Rica still include very strenuous activities as opposed to other countries like the US. On the other hand, our null findings may also be the result of measurement error and residual confounding be-cause of imperfect adjustment for socioeconomic status and other lifestyle factors such as diet and smoking.
[image:8.595.60.540.88.430.2]A dose-response relation between physical activity and risk of CVD has been well documented in several large-scale prospective studies [35-38]. However, the exact shape of the dose-response curve remains unclear. Con-sistent with previous studies [35-38], our study indicated Figure 2Relationship between light indoor activity component score and risk of AMI fitted with natural cubic splines in a case control study, Costa Rica, 1994-2004.(The reference line (OR=1.0) goes through the median value of the first quintile; the solid line for ORs; the dashed lines for 95% confidence interval boundaries).
Gonget al. BMC Public Health2013,13:122 Page 7 of 10
that the association between total activity-related energy expenditure and AMI risk is protective. However, we observed that the decreasing risk flattened out at high levels. Occupational physical activities contributed to high levels of total activity-related energy expenditure in our study (Table 4), and we did not find an association of AMI risk with the agricultural or manual labor job patterns.
Our study has several limitations that must be kept in mind in interpreting our study findings. Our study is a case-control study and, thus, the temporal relationship between physical activity and AMI risk is unclear. As in all observational studies, we cannot establish causal asso-ciations. Self-reported physical activity measurements con-tain large measurement error [39,40], which may lead to underestimate the effect of physical activity on AMI risk [41]. Recall bias is an issue in case-control studies. If con-trols are more likely to under-report daily physical activities than cases, the results could be biased towards the null hy-pothesis; if controls, due to social desirability, overestimate their physical activities while cases do not, then the effects of physical activity could be overestimated. However, our results on total activity-related energy expenditure are
consistent with those from previous studies. Thus, recall bias is less likely to play a role in our study. Another poten-tial limitation is that cases only included survivors of a first AMI. We cannot exclude residual confounding in our estimates. For example, occupation stress, a potential con-founder, was not accounted for in our study because the information was not available. Our results may not be generalizable to other populations, since physical activity patterns are likely to vary according to many factors such as population level economic development, individual level socioeconomic status, the built environment, and distribu-tion of leisure and occupadistribu-tional activities.
Conclusion
[image:9.595.60.540.88.406.2]related energy expenditure and AMI risk. Further research on different populations is required to validate the applica-tion of PCA to deriving physical activity patterns and con-firm our findings.
Competing interests
The authors declare that they have no competing interests.
Authors’contributions
JG performed the statistical analysis and drafted the manuscript. MJAF participated in the statistical analysis. STM, RG, and CR helped to draft the manuscript. AB and HC conceived of the study, and participated in its design and coordination and helped to draft the manuscript. All authors read and approved the final manuscript.
Acknowledgements
This work was supported by the National Institutes of Health (HL49086, HL60692, and HL081549).
Author details
1Department of Community Health, Brown University, Providence, RI 02912,
USA.2Department of Nutrition, Harvard School of Public Health, Boston, MA 02115, USA.3Department of Psychiatry, University of California, San DiegoLa
JollaCA 92093, USA.4Department of Quantitative Health Sciences, University of Massachusetts Medical School, Worcester, MA 01655, USA.5Deparment of
Family Medicine, University of Michigan, Ann Arbor, MI 48109, USA.
6Department of Epidemiology, School of Public Health, University of
Michigan, Ann Arbor, MI 48109, USA.
Received: 5 July 2012 Accepted: 4 February 2013 Published: 8 February 2013
References
1. Kokkinos P, Myers J, Kokkinos JP, Pittaras A, Narayan P, Manolis A, Karasik P, Greenberg M, Papademetriou V, Singh S:Exercise capacity and mortality in black and white men.Circulation2008,117(5):614–622.
2. Manson JE, Hu FB, Rich-Edwards JW, Colditz GA, Stampfer MJ, Willett WC, Speizer FE, Hennekens CH:A prospective study of walking as compared with vigorous exercise in the prevention of coronary heart disease in women.N Engl J Med1999,341(9):650–658.
3. Myers J, Prakash M, Froelicher V, Do D, Partington S, Atwood JE:Exercise capacity and mortality among men referred for exercise testing.N Engl J Med2002,346(11):793–801.
4. Oguma Y, Shinoda-Tagawa T:Physical activity decreases cardiovascular disease risk in women: review and meta-analysis.Am J Prev Med2004, 26(5):407–418.
5. Sofi F, Capalbo A, Cesari F, Abbate R, Gensini GF:Physical activity during leisure time and primary prevention of coronary heart disease: an updated meta-analysis of cohort studies.Eur J Cardiovasc Prev Rehabil
2008,15(3):247–257.
6. Physical Activity Guidelines Advisory Committee Report:Physical Activity Guidelines advisory Committee.: Physical Activity Guidelines advisory Committee; 2008.
7. Barengo NC, Hu G, Lakka TA, Pekkarinen H, Nissinen A, Tuomilehto J:Low physical activity as a predictor for total and cardiovascular disease mortality in middle-aged men and women in Finland.Eur Heart J2004, 25(24):2204–2211.
8. Boreham CA, Kennedy RA, Murphy MH, Tully M, Wallace WF, Young I: Training effects of short bouts of stair climbing on cardiorespiratory fitness, blood lipids, and homocysteine in sedentary young women.
Br J Sports Med2005,39(9):590–593.
9. Fransson E, De Faire U, Ahlbom A, Reuterwall C, Hallqvist J, Alfredsson L: The risk of acute myocardial infarction: interactions of types of physical activity.Epidemiology2004,15(5):573–582.
10. Fransson EI, Alfredsson LS, de Faire UH, Knutsson A, Westerholm PJ:Leisure time, occupational and household physical activity, and risk factors for cardiovascular disease in working men and women: the WOLF study.
Scand J Public Health2003,31(5):324–333.
11. Stamatakis E, Hamer M, Lawlor DA:Physical activity, mortality, and cardiovascular disease: is domestic physical activity beneficial? The Scottish Health Survey–1995, 1998, and 2003.Am J Epidemiol2009, 169(10):1191–1200.
12. Yu S, Yarnell JW, Sweetnam PM, Murray L:What level of physical activity protects against premature cardiovascular death? The Caerphilly study.
Heart2003,89(5):502–506.
13. Johnson RA, Wichern DW:Principal components. InApplied multivariate statistical analysis. 5th edition. Edited by Johnson RA, Wichern DW. Upper Saddle River, N.J: Prentice Hall; 2002:767.
14. Baylin A, Kabagambe EK, Ascherio A, Spiegelman D, Campos H:Adipose tissue alpha-linolenic acid and nonfatal acute myocardial infarction in Costa Rica.Circulation2003,107(12):1586–1591.
15. Campos H, Siles X:Siesta and the risk of coronary heart disease: results from a population-based, case-control study in Costa Rica.Int J Epidemiol
2000,29(3):429–437.
16. Tunstall-Pedoe H, Kuulasmaa K, Amouyel P, Arveiler D, Rajakangas AM, Pajak A:Myocardial infarction and coronary deaths in the World Health Organization MONICA Project. Registration procedures, event rates, and case-fatality rates in 38 populations from 21 countries in four continents.
Circulation1994,90(1):583–612.
17. Campos H, Mata L, Siles X, Vives M, Ordovas JM, Schaefer EJ:Prevalence of cardiovascular risk factors in rural and urban Costa Rica.Circulation1992, 85(2):648–658.
18. Campos H, Bailey SM, Gussak LS, Siles X, Ordovas JM, Schaefer EJ:Relations of body habitus, fitness level, and cardiovascular risk factors including lipoproteins and apolipoproteins in a rural and urban Costa Rican population.Arterioscler Thromb1991,11(4):1077–1088.
19. Durrleman S, Simon R:Flexible regression models with cubic splines.
Stat Med1989,8(5):551–561.
20. Ruppert D, Wand MP, Carroll RJ:Semiparametric regression. New York: Cambridge University Press; 2003.
21. Herndon JE 2nd, Harrell FE Jr:The restricted cubic spline as baseline hazard in the proportional hazards model with step function time-dependent covariables.Stat Med1995,14(19):2119–2129. 22. Govindarajulu US, Spiegelman D, Thurston SW, Ganguli B, Eisen EA:
Comparing smoothing techniques in Cox models for exposure-response relationships.Stat Med2007,26(20):3735–3752.
23. Willett W:Nutritional epidemiology. 2nd edition. New York: Oxford University Press; 1998.
24. Meisinger C, Heier M, Lowel H, Schneider A, Doring A:Sleep duration and sleep complaints and risk of myocardial infarction in middle-aged men and women from the general population: the MONICA/KORA Augsburg cohort study.Sleep2007,30(9):1121–1127.
25. Ayas NT, White DP, Manson JE, Stampfer MJ, Speizer FE, Malhotra A, Hu FB: A prospective study of sleep duration and coronary heart disease in women.Arch Intern Med2003,163(2):205–209.
26. Qureshi AI, Giles WH, Croft JB, Bliwise DL:Habitual sleep patterns and risk for stroke and coronary heart disease: a 10-year follow-up from NHANES I.Neurology1997,48(4):904–911.
27. Chen JC, Brunner RL, Ren H, Wassertheil-Smoller S, Larson JC, Levine DW, Allison M, Naughton MJ, Stefanick ML:Sleep duration and risk of ischemic stroke in postmenopausal women.Stroke2008,39(12):3185–3192. 28. Ohayon MM:From wakefulness to excessive sleepiness: what we know
and still need to know.Sleep Med Rev2008,12(2):129–141. 29. Salonen JT, Slater JS, Tuomilehto J, Rauramaa R:Leisure time and
occupational physical activity: risk of death from ischemic heart disease.
Am J Epidemiol1988,127(1):87–94.
30. Menotti A, Lanti M:Coronary risk factors predicting early and late coronary deaths.Heart2003,89(1):19–24.
31. Rosengren A, Wilhelmsen L:Physical activity protects against coronary death and deaths from all causes in middle-aged men. Evidence from a 20-year follow-up of the primary prevention study in Goteborg.
Ann Epidemiol1997,7(1):69–75.
32. Wagner A, Simon C, Evans A, Ferrieres J, Montaye M, Ducimetiere P, Arveiler D:Physical activity and coronary event incidence in Northern Ireland and France: the Prospective Epidemiological Study of Myocardial Infarction (PRIME).Circulation2002,105(19):2247–2252.
33. Stender M, Hense HW, Doring A, Keil U:Physical activity at work and cardiovascular disease risk: results from the MONICA Augsburg study.
Int J Epidemiol1993,22(4):644–650.
Gonget al. BMC Public Health2013,13:122 Page 9 of 10
34. Tuomi K:Characteristics of work and life predicting coronary heart disease. Finnish research project on aging workers.Soc Sci Med1994, 38(11):1509–1519.
35. Lees SJ, Booth FW:Sedentary death syndrome.Can J Appl Physiol2004, 29(4):447–460. discussion 444-446.
36. Kesaniemi YK, Danforth E Jr, Jensen MD, Kopelman PG, Lefebvre P, Reeder BA: Dose-response issues concerning physical activity and health: an evidence-based symposium.Med Sci Sports Exerc2001,33(6 Suppl):S351–358. 37. Blair SN, Kampert JB, Kohl HW 3rd, Barlow CE, Macera CA, Paffenbarger RS
Jr, Gibbons LW:Influences of cardiorespiratory fitness and other precursors on cardiovascular disease and all-cause mortality in men and women.JAMA1996,276(3):205–210.
38. Kohl HW:3rd: Physical activity and cardiovascular disease: evidence for a dose response.Med Sci Sports Exerc2001,33(6 Suppl):472–483.
discussion S493-474.
39. Philippaerts RM, Westerterp KR, Lefevre J:Comparison of two
questionnaires with a tri-axial accelerometer to assess physical activity patterns.Int J Sports Med2001,22(1):34–39.
40. Adams SA, Matthews CE, Ebbeling CB, Moore CG, Cunningham JE, Fulton J, Hebert JR:The effect of social desirability and social approval on self-reports of physical activity.Am J Epidemiol2005,161(4):389–398. 41. Ferrari P, Friedenreich C, Matthews CE:The role of measurement error in
estimating levels of physical activity.Am J Epidemiol2007,166(7):832–840.
doi:10.1186/1471-2458-13-122
Cite this article as:Gonget al.:A case-control study of physical activity patterns and risk of non-fatal myocardial infarction.BMC Public Health
201313:122.
Submit your next manuscript to BioMed Central and take full advantage of:
• Convenient online submission
• Thorough peer review
• No space constraints or color figure charges
• Immediate publication on acceptance
• Inclusion in PubMed, CAS, Scopus and Google Scholar
• Research which is freely available for redistribution