warwick.ac.uk/lib-publications
Original citation:
Failla, M., Keller, J., Scalari, G., Maissen, C., Faist, J., Reichl, C., Wegscheider, W., Newell,
Oliver, Leadley, D. R. (David R.), Myronov, Maksym and Lloyd-Hughes, J.. (2016) Terahertz
quantum Hall effect for spin-split heavy-hole gases in strained Ge quantum wells. New
Journal of Physics, 18 (11). 113036.
Permanent WRAP URL:
http://wrap.warwick.ac.uk/85079
Copyright and reuse:
The Warwick Research Archive Portal (WRAP) makes this work of researchers of the
University of Warwick available open access under the following conditions.
This article is made available under the Creative Commons Attribution 3.0 (CC BY 3.0) license
and may be reused according to the conditions of the license. For more details see:
http://creativecommons.org/licenses/by/3.0/
A note on versions:
The version presented in WRAP is the published version, or, version of record, and may be
cited as it appears here.
PAPER
Terahertz quantum Hall effect for spin-split heavy-hole gases in
strained Ge quantum wells
M Failla1
, J Keller2
, G Scalari2
, C Maissen2
, J Faist2
, C Reichl3
, W Wegscheider3
, O J Newell1
, D R Leadley1
, M Myronov1
and J Lloyd-Hughes1
1 University of Warwick, Department of Physics, Gibbet Hill Road, Coventry, CV4 7AL, UK 2 Institute for Quantum Electronics, ETH Zürich, 8093 Zürich, Switzerland
3 Laboratory for Solid State Physics, ETH Zürich, 8093 Zürich, Switzerland
E-mail:[email protected]
Keywords:terahertz, quantum Hall effect, germanium, spin–orbit, strain, quantum well
Abstract
Spin-split heavy-hole gases in strained germanium quantum wells were characterized by
polarisation-resolved terahertz time-domain spectroscopy. Effective masses, carrier densities, g-factors, transport
lifetimes, mobilities and Rashba spin-splitting energies were evaluated, giving quantitative insights
into the in
fl
uence of strain. The Rashba coef
fi
cient was found to lower for samples with higher biaxial
compressive strain, while heavy-hole mobilities were enhanced to over
1.5
´
10
6cm
2V
−1s
−1at 3 K.
This high mobility enabled the observation of the optical quantum Hall effect at terahertz frequencies
for spin-split two-dimensional heavy-holes, evidenced as plateaux in the transverse
magnetoconduc-tivity at even and odd
fi
lling factors.
Introduction
The spin–orbit interaction(SOI)gives rise to fascinating physical phenomena, and offers potential application in spintronic devices as it can lift spin degeneracy even at zero external magneticfield[1]. The SOI can arise from bulk or structural inversion asymmetries(BIA or SIA, respectively). The SIA is particularly interesting as it can be provided in modulation-doped heterostructures, and can be controlled by applying an external electricfield or by changing the doping density. Two-dimensional hole gases(2DHGs)in strained Ge quantum wells( sGe-QWs)are attractive systems for spintronics due to their compatibility with CMOS technology andfinite SO effects, driven by the Rashba SOI[2–4]. Furthermore, as mobilities can approach or exceed 106cm2 V−1s−1in strained Ge[5,6], exotic many-body effects such as the quantum Hall effect(QHE)[3]and the fractional QHE
[7,8]have been observed in a dc electricfield.
In Ge quantum wells withSi1-xGexbuffer layers the degeneracy of the heavy hole(HH)and light hole(LH)
valence bands is lifted by strain, giving an energy differenceEHH,LH=∣EHH-ELH∣at zero wavevector[9,10], and making HHs lighter. The Rashba SOI further lifts the degeneracy of HHs and LHs,[2,11]giving spin-split states even at zero magneticfieldB, with an energy that depends on odd-powers of the in-plane wavevectork. As opposed to thek-linear Rashba SOI experienced by conduction band electrons and LHs, for HHs the Rashba SOI contributes with ak-cubic dependence, leading to a different effective magneticfield. The energy difference between spin-up and spin-down states isD =2bkF3, whereβis the cubic Rashba coefficient,kF= 2pr2Dis
the Fermi wavevector, andr2Dis the carrier sheet density. Sincebµ1 (EHH,LH)2, strain also plays an important role in determining properties for spintronic applications[2].
Intriguingly, recent years have shown an ac analogue of the QHE when a dc magneticfieldBand the ac electricfield of light are perpendicular: the optical quantum Hall effect(OQHE). A numerical study of the dynamical response[12]predicted plateaux-like features in the transverse(off-diagonal)magnetoconductivity
s wxy( ,B)at THz frequencies, at integer values of thefilling factorn=hr2D eB. Experimentally, plateaux in
s wxy( )or in the Faraday rotation angle have been witnessed only for electrons in GaAs heterostructures[13,14] or for Dirac fermions in graphene[15]. In this project we established and investigated the physics of the OQHE
OPEN ACCESS
RECEIVED 20 July 2016
REVISED 24 October 2016
ACCEPTED FOR PUBLICATION 27 October 2016
PUBLISHED 21 November 2016
Original content from this work may be used under the terms of theCreative Commons Attribution 3.0 licence.
Any further distribution of this work must maintain attribution to the author(s)and the title of the work, journal citation and DOI.
for HHs in strained germanium. Important distinctions about this system in comparison to previous studies are that:(i)the Rashba SOI can contribute in sGe, whereas it is negligible in the OQHE systems reported so far[13– 15],(ii)the Zeeman energym gJ *mBBis larger for HHs(which have magnetic quantum numbermJ = 3 2)
than for electrons(mJ = 1 2)for the same effectiveg-factorg*,(iii)the strength of the Rashba energyΔand
Zeeman energy are closely linked to the strain, and(iv)the valence band structure of sGe is more strongly non-parabolic than that of the GaAs conduction band.
In this work we used polarisation-resolved THz time-domain spectroscopy(THz-TDS)to study high
mobility 2DHGs in sGe-QWs in the quantum Hall regime. A comparison with a GaAs/AlGaAs 2DEG permitted
HHs to be uniquely identified by the ellipticity of the transmitted THz radiation. In contrast to our previous work, which examined the longitudinal conductivity of lower mobility samples with lower strain[4], here we report strain-enhanced lifetimes with mobilities exceeding1.5´106cm2
V−1s−1. The study ofs wxy( ,B)from
the complex Faraday spectra allowed the direct observation of the OQHE for 2D HHs, via distinct plateaux insxy
near integerfilling factors. A qualitative difference between samples with different well thicknesses is the presence or absence of plateaux at oddν. This difference is linked to the contrasting Landau fan dispersions that result from differentg-factors. The width of the OQHE plateaux for 2DHGs is compared with literature results for GaAs/AlGaAs 2DEGs. An experimental oscillation in the cyclotron resonance width with magneticfield is ascribed to the changing Landau level(LL)occupancy, as suggested by a model of the joint density of states
(JDOS). Finally, the enhanced strain lowers the Rashba interaction strengthΔas a consequence of an increased HH–LH splitting energy.
Experimental method
Modulation-dopedSi0.3Ge0.7/Ge/Si0.3Ge0.7heterostructures were grown using an ASM Epsilon 2000
RC-CVD reactor, with1.3%in-plane compressive strain[6]. Samples are labelled as Ge-10nm and Ge-20 nm, in accordance with the thickness of each Ge QW. Holes are supplied by a boron-doped SiGe layer(dopant density 2×1018cm−3). The low doping ensures that only the HH subband is occupied. Details of the GaAs/AlGaAs sample(4´30 nmQWs)can be found in[16]. Polarisation-resolved THz-TDS was performed by generating linearly polarised THz pulses using an interdigitated GaAs emitter photoexcited by femtosecond pulses from a Ti:sapphire laser oscillator. A wire grid polariser was placed after the THz emitter. THz pulses were focused on samples placed in a superconducting magnet in the Faraday geometry, whereB=0.0-7.5T was applied along the growth axis in 0.1 T steps, and atT=3 K. To investigate the longitudinal and transverse response of HHs to an ac electricfield, the orthogonal components of the THz radiation were probed using electro-optic sampling with a〈111〉-oriented ZnTe crystal[17,18]. This directly yields the complex transverse conductivity
s wxy( ,B)(Hall response)and longitudinal conductivitys wxx( ,B).
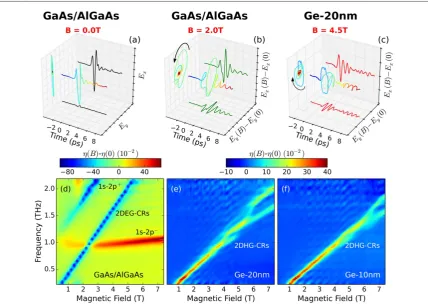
Infigure1(a)thex- andy-components(ExEy)of the transmitted THz pulse through the GaAs/AlGaAs
sample atB=0 T are shown in the time domain. For 2D electronic systems under a magneticfield CR
absorption arises from transitions between occupied LLs∣Nñand unoccupied LLs∣N+ ñ1. The selection rule is such that there are cyclotron resonance active(CRA)and inactive(CRI)modesE, where±denote right and left-handed light. Under an applied magneticfield the Faraday effect alters the amplitude, phase and polarisation of the transmitted THz pulse because of the different absorption coefficients and refractive indices of the CRA and CRI modesE[19].
The CR response can be resolved in the time domain by subtracting the transmitted THz electricfield at
B=0 T from that atfiniteB, i.e.Ex yCR, (B t, )=Ex y, (B t, )-Ex y, (0,t). Examples of the CR response in the time domain for the GaAs/AlGaAs and the Ge-20 nm samples are given infigures1(b)and(c). Beating effects are clearly visible inExCRandEyCR, as a consequence of multiple transitions with different frequencies[4]. In contrast to our previous work[4], which just examinedExCR, the additional knowledge ofEyCRallows the definitive identification of the type of quasiparticle undergoing CR. The total CR-waveformsECR( )t =ExCRx+EyCRy,
shown as multicoloured lines infigures1(b)and(c), are elliptically polarised with opposite helicity(arrows)for the 2DEG and the 2DHG. This is because the CRA modes for electrons are CRI for holes, as a consequence of the opposite sense of cyclotron rotation due to the opposite sign in the effective mass[20].
The time-domain data were Fourier transformed, and then converted to a circular basis set using
=
( ) ( ( ) ( ))
E B 1 2 E Bx iE By . This then permits the real and imaginary components of the complex
Faraday angle[21]QF(w,B)=q wF( ,B)+ih w( ,B)to be found. The transmitted pulse is rotated by the Faraday angleqF=(arg(E+)-arg(E-)) 2, while the ellipticity ish =(∣E+∣-∣E-∣) (∣E+∣+∣E-∣)[22]. To rule out any contribution toqFandηatB=0T due to the small butfinite ellipticity of the incident pulse
(figure1(a)), we consideredDqF=qF( )B -qF(B=0)andD =h h( )B -h(B=0). Determining the complex Faraday angleDQF(w,B)is important for studies of the OQHE, as the transverse
magnetoconductivity can be readily determined from:
2
w q w h w s w
DQ ( B)= D ( B)+ D ( B)= Z ( ) ( )
n B
, , i ,
2 xy , , 1
F F 0
wherenis the refractive index of the material sandwiching the confined carriers andZ0=377W. Hence, the
ellipticity changeDhcorresponds to the imaginary part ofsxy, andDqFto the real part ofsxy.
Infigures1(d)–(f)the ellipticity changeDhis shown for all samples in the magneticfield range 0–7.4 T. For the GaAs sample(figure1(d))the resonance with frequency proportional toBandD <h 0is ascribed to the CR of the 2DEG. The blue branch(above 1 THz frequency)corresponds to hydrogenic 1s–2p+transitions of donor-bound electrons in the n-type substrate, while the red region results from hydrogenic 1s–2p−transitions[23]. These contributions have opposite ellipticity because theB-field lifts the degeneracy of the 2p excited states for donor-bound electrons in the substrate. Infigures1(e)and(f), the positiveDhis assigned to the CRs of the 2DHG within the Ge quantum well. The opposite sign with respect to that for the GaAs 2DEG shows that holes are the dominant charge carrier in the sGe-QWs. The HH valence band of strained Ge is non-parabolic, and the Zeeman effect results in spin-split CRs at highB, while at allBthe Rashba interaction can split spin-up to spin-up and spin-down to spin-down CR energies[4,11,24].
Carrier density and effective mass
In order to know the magneticfield at which to expect quantum Hall plateaux the carrier densityr2Dof the 2DHG was found accurately. In this section we describe two methods to obtainr2Dfrom THz-TDS. Firstly, the experimental longitudinal conductivitysxx= ¢ +sxx isxxwas obtained from the transmission
w = w w
( ) ( ) ( )
Txx B, Exx B, Exx 0, usingsxx=2n Z0(1 Txx-1), whereExxis the transmitted THzfield along xfor an incident pulse alongx[25]. The real part ofsxxwas then used to determine the sheet density via the sum
rule:[26]
ò
rp w s w
= m* ¢ ( ) ( )
e 2
d . 2
f f
xx
2D
sum THz 2
1 2
[image:4.595.121.550.61.366.2]Here,mTHz* is an estimate of the effective mass given by a linearfit to the CR frequencies forB3T. The frequency interval(f f1, 2)can be varied to match a particular transition, for instance as required to isolate the
Figure 1.(a)Orthogonal componentsEx,Eyof the transmitted THz pulse through the GaAs/AlGaAs sample(black lines), and the
2DEG response of the GaAs/AlGaAs sample from the hydrogenic transitions in the substrate. For this sample, the obtained effective mass was0.069m0, and the electron density was4.4´1011cm−2, in excellent agreement
with device magnetotransport measurements[16], validating this procedure. Hole sheet densities within the Ge-QWs were averaged for data in the magneticfield range without well resolved split-CRs(B3.5T). The obtained values ofmTHz* andr2Dsumare reported in table1: the masses are similar, and the densities are
comparable.
The sheet density can be alternatively evaluated, together with the CR-frequencies and lifetimes, byfitting q
D FandDh, which are linked to the real and imaginary parts ofs wxy( )[13,21]. Here, the Drude–Lorentz
transverse magnetoconductivity was assumed[27], given bys wxy( )= åiAi(wc i, ((w+i ti)2-wc i2,), where theåiconsiders different CR-transitions having angular frequencieswc i, and lifetimeti. Theith amplitude is
given byAi =r2D,ie m2 i*, whereeis the carrier charge,mi*the cyclotron mass(frommi*=eB wc i,)andr2D,i
is the sheet density involved in theith CR. Parameters from frequency-domainfits were validated by time-domainfits[4,28], which can for instance give more accurate lifetimes if experimental time windows are comparable toti.
Fits toDhfor the GaAs 2DEG’s CR(figure1(d))usedn=3.6 in equation(1). As a proof of the reliability of the adopted model, an electron density ofr2D=4.5´10-11cm−2
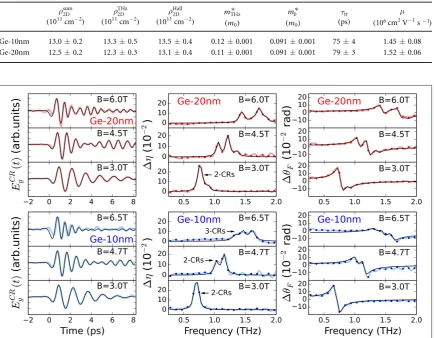
per quantum well was found, in good accord with the sum-rule result above. Infigure2, the experimental CRs in the time domain for the sGe-QWs, together withDhandDqF(coloured lines)andfits(black lines)usingn=3.8[29], are shown at variousB. The total
sheet density for the Ge samples,r2DTHz, averaged in the magneticfield range1.5B3.5T, is in line withr 2D sum,
as reported in table1.
A different evolution of the CRs withBis observable by comparing the Ge-20 nm and Ge-10 nm samples. At
B=3.0 T the ellipticityDhof the 20 nm well displays a prominent shoulder at high frequency. This appears for
>
[image:5.595.120.555.92.430.2]B 2.0T and is still present at 4.5 T whereDhconsists of three resonances. On the other hand, the Ge-10 nm sample exhibits a transition from one to two clearly resolved CRs at 4.7 T evolving into three CRs forB6.4T.
Table 1.Sheet carrier density evaluated from: equation(2) (r2Dsum);fits of time and frequency domain data(r2DTHz); classical Hall conductivity
(r2DHall). Effective mass from: linearfit of CRs(m*
THz);fits of the CR transition energies(mb*). The transport lifetimettrwas used to get the
mobilitym=ettr mb*.
rsum2D r
2D
THz r
2D
Hall *
mTHz mb* ttr μ
(1011cm−2) (1011cm−2) (1011cm−2) (m0) (m0) (ps) (106cm2V−1s-1)
Ge-10nm 13.0±0.2 13.3±0.5 13.5±0.4 0.12±0.001 0.091±0.001 75±4 1.45±0.08 Ge-20nm 12.5±0.2 12.3±0.3 13.1±0.4 0.11±0.001 0.091±0.001 79±3 1.52±0.06
Figure 2.CR waveforms in time domain,EyCR( )t, ellipticityDhand Faraday angleDqin the frequency domain for the Ge-10 nm and
Ge-20 nm samples. Points and coloured lines are experiment, and black lines arefits that allows wxy( ,B), the transverse(or Hall) conductivity, to be determined.
4
As the hole masses and densities are similar(table1)this implies that another material parameter differs between samples. In the following we examine whether the Zeeman or the Rashba energies drive these differences.
Zeeman and Rashba energies
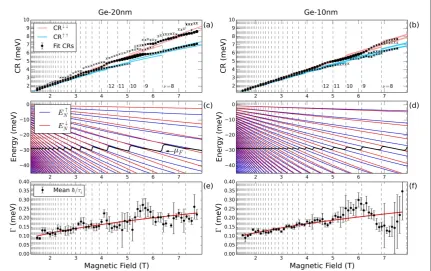
To investigate further, the CR-energies fromfits are reported as black circles infigures3(a)and(b). Landau fans, reported infigures3(c)and(d)for spin up(blue lines)and spin down(red)levels, were calculated in order to model the experimental CR energies, using the approach detailed in[4]. This includes the influence of the Rashba effect, through the splitting energyΔ, and the Zeeman effect(proportional to theg-factor). The energy dependence of the effective mass andg-factor due to non-parabolicity was considered using
= ( + )
* *
m mb 1 2E Eg andg*=g0*(1 -aNPE), respectively[30]. Here,mb*is theΓ-point effective mass,Egis
the energy gap of Ge andaNPis a non-parabolicity factor. The chemical potentialmF(black lines infigures3(c)
and(d))jumps between different LL energiesENwhenνis an integer, at values ofB(vertical dashed lines)
obtained consideringB=hr2D enwithr2D=r2DTHz. CRs appear and disappear at integerfilling factorν, owing to the evolution of the LL occupancy.
The energy of the strongest transitions in experiment(big black circles)are in agreement with the spin-down–down(CR, red lines)and spin-up–up(CR, blue lines)transition energies between spin-split LLs. Note that, for simplicity, we assumedδ-function LLs(widthG =0)in the Landau fan calculation, i.e. neglecting disorder[31]. For this reason, two CRand two CRare considered in the model becauseΓmay result in an overlap between the last two occupied LLs, giving rise to up to four CRs(as discussed later with regard to
figure5). The model will also underestimate the CR energy when the uppermost LL is more than half occupied as it does not include the JDOS; the LLs broadening is investigated later in the text.
The best agreement of the model with the experimental CRs energies was obtained withD =0.40.2meV andmb*=0.0910.001m0for both samples. Previously we foundD 2.0meV andmb*=0.103m0for a
Ge-QW with0.8%strain and a similar sheet density(9.7´1011cm−2)[
4]. Since the strain increasesEHH,LH(the HH–
LH band energy difference at theΓpoint)andD µ1 (EHH,LH)2, the lower values reported in the current work agrees with the expectation thatΔdecreases with strain[2,4,9]. The modelledg-factors wereg0*=2.80.5and 5.0±0.5 for the Ge-10 nm and Ge-20 nm samples, respectively, with a non-parabolicity constant
aNP=0.0250.005meV−1. As the Zeeman splitting is proportional to theg-factor, sample Ge-20 nm has a
[image:6.595.121.553.63.334.2]larger Zeeman energy than Ge-10 nm, with consequences for the OQHE plateaux reported later in the manuscript.
Figure 3.(a)and(b)Calculated spin down-down(red lines)and up-up(blue lines)transition energies compared with experiment
(solid black circles). The relative size of the black circles is proportional to the estimated carrier density of theith CR while the error bar depicts the linewidth of the resonance. The magneticfields at whichνis an integer are depicted as black dashed vertical lines.(c)and
For0.8%strained Ge-QWs with thickness 11 nm and 22 nm we found previously thatg0=3.2 and 7.0,
respectively[4].
The small size of the Rashba energy(Δ=0.4 meV)in the present case results in a small contribution to the CR splitting of<0.1meV(as assessed by a comparison of the Landau fan with and withoutΔ), and which is independent ofB.
Mobility
To verify that the sGe-QWs studied have sufficiently high mobility to enter the quantum Hall regime, the transport mobility was determined from theB-dependence of the CR linewidthG = tTHz. Here,tTHzis the
average of the differenttiobtained byfittingDh,DqFandEyCR( )t .G( )B is shown infigures3(e)and(f)for
Ge-10 nm and Ge-20 nm. The overall magneticfield evolution ofΓis consistent withG µ B, as expected when the mobility is mainly affected by a short-range scattering potential[32]. Thefit of this dependence, shown as the red line, allows the extrapolation of the transport lifetimettrand mobility[4]. We estimatettr=754ps
and 79±3ps for the Ge-10 nm and Ge-20 nm samples, with mobilitiesm=ettr mb*=(1.450.08)´
106cm2
V−1s−1and(1.520.06)´106cm2
V−1s−1respectively. The higher mobility than our previous report ofm~ ´6 105cm2
V−1s−1(ttr~30ps)for0.8%strain may be linked to the largerEHH,LH. The
apparent oscillation intTHzat differentfilling factors may be related to the variation in LL occupancy[32–34], as
the CR linewidth depends on the width of the unoccupied region of thefinal LL. This point is elucidated in the JDOS description later in the manuscript.
Optical QHE
Given the high mobility and precise knowledge of thefilling factor demonstrated above, we examined the transverse magnetoconductivity for signs of the OQHE. We adopted the approach of[12,13]wheresxywas
normalised by the CR response to gives˜xy. Here,s˜xyacts as an effective density which, for high mobility 2D systems, should show plateaux at integer values ofνsimilar to those seen in the dc QHE. Conversely, in the classical limit(lowBor highν)a straight line is expected, ass˜xyr2Dh eB.
The evolution ofs˜xy, obtained from thefits ofs wxy( ,B), is shown infigure5for both Ge-QWs(solid circles).
The classical limit is also shown(red lines)and was obtained using the sheet densitiesr2DHall=13.50.4´ 1011cm−2
for Ge-10 nm and13.10.4´1011cm−2
for Ge-20 nm. As can be seen in table1, these densities are in good accord with those from the sum-rule method and fromfittingDhandDqF. In the limit of smallerν
(largerB)clear plateaux are evident ins˜xyfor both samples at evenfilling factorsν=10, 12 and 14. In particular, these appear wider for the Ge-20 nm sample while for the Ge-10 nm a clear plateaux is resolved at the oddfilling factorn =11.
The observation of an OQHE plateaux at oddfilling factorn =11implies that there is substantial spin splitting: in the absence of spin splitting the spin up and down states are degenerate and plateaux are at evenν[4]. For instance, for a gated GaAs 2DEG the OQHE around odd values ofνwas attributed to the Zeeman effect[14]. Here, the relative weakness of the Rashba spin-splitting term suggests that the Zeeman term is responsible for the plateaux atn=11in Ge-10 nm. The insets infigure4show the evolution ofmFand the LL energies with the
filling factor for both samples. A plateaux insxyarises whenmFlies inbetween two LLs, where changingBdoes
not change the density of occupied states. Note that for Ge-10 nm, the LLs are well spaced in energy andν, and hence on sweepingνvia changingB(as in the experiment)plateaux insxymay be resolved at odd or evenν.
However for Ge-20 nm the larger effectiveg-factorg0*has modified the LL dispersion, and odd and even levels are close together(within the LL linewidth, see next section). This may explain the lack of odd plateaux in the experimental result for Ge-20 nm: while there is a well defined jump inmFfor evenν, the change is less pronounced for oddνand the plateaux should be correspondingly weaker, or narrower inB.
The widthDnof the OQHE plateaux reported infigure4in terms of thefilling factorνisD ~n 0.5for all the plateaux observed betweenn=10andn=14. This is relatively large in comparison to the OQHE plateaux widths reported for high mobility 2DEGs[13,14]. Ikebeet alreported thatD ~n 0.050.1for the THz OQHE aroundn =2, while the dc Hall plateaux were broader(D ~n 0.4)[13]. Similarly, Stieret alfound that
n
D ~0.1for OQHE plateaux in the Faraday angle(aroundn =4), with wider dc plateaux[14]. The difference between the dc and OQHE plateaux width was assigned by Ikebeet alto the difference in length scales probed by dc Hall measurements and ac THz spectroscopy[13]. A number of factors may contribute to the largerDn reported here: the OQHE plateaux width depends on factors that include the distance travelled by a carrier in one oscillation period of the THz electricfield, the characteristic length scale of disorder, and the LL index[13]. A comparison to the dc plateaux widths was not possible for devices made on these samples, although QHE plateaux have been seen in similar sGe QWs[3,7,8].
6
Figure 4.Normalised optical Hall conductivitys˜xyas a function offilling factor and magneticfield(solid circles). At integerfill factors sxyshows evident deviations from the Drude classical limit(red lines), with plateaux aroundν=10, 12, 14(Ge-20 nm)andν=10,
11, 12, 14(Ge-10 nm). The insets show the evolution of the chemical potential(black line)and LLs(blue and red lines)with thefilling factor.
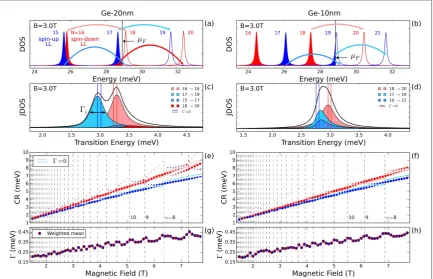
Figure 5.(a)and(b)Density of states(DOS)of LLs at atB=3.0 T assuming a Lorentzian shape. Arrows mark spin-conserving transitions between occupied and unoccupied LLs.(c)and(d)Joint DOS atB=3.0 T for the transitions in(a)and(b). The black line shows the total JDOS, while the shaded areas denote the contributions from individual transitions with different widthsGi.(e)and(f)
Evolution withBof the transition energies given by the maximum of the JDOS peaks. The dot size represents the amplitude of the different contributions. Red and blue lines depict theG =0transition energies.(g)and(h)Evolution withBof the mean ofGi,
[image:8.595.120.554.409.688.2]Joint density of states
To qualitatively clarify the oscillation ofΓwithB(figures3(e)and(f))and the differences between the two samples, the JDOS was calculated from the LL fans infigures3(c)and(d). LLs with a Lorentzian shape were assumed, with a width given by thefittedG( )B µ B(red lines infigures3(e)and(f)). A comparison between the DOS for the two samples atB=3 T is given infigures5(a)and(b). Adjacent odd and even LLs for Ge-20 nm overlap and, whenmFcrosses two adjacent LLs, four spin-conserving CR transitions are therefore allowed
(arrows infigure5(a)). A negligible overlap results for the Ge-10 nm sample infigures5(b)where, depending on the position ofmF, only two or three(pictured)CRs can appear. The shaded areas infigures5(c)and(d)show the JDOS contribution for each transition. The optical conductivity is proportional to the JDOS(black line), and can therefore exhibit shoulders or non-Lorentzian lineshapes as a result of partial LL occupancy. The two small contributions infigure5(c)as well as the two spin-up to spin-up transitions infigure5(d) (blue areas), differ in transition energy from theG =0case(blue and red vertical lines). The calculated JDOS infigures5(c)and(d) can be qualitatively compared with the experimental ellipticity reported infigure2. While two CRs are resolved in the experimental ellipticity at B=3.0T for Ge-20 nm, only one is resolved for Ge-10 nm, as in the JDOS model.
The overall trend at differentBis depicted infigures5(e)and(f), which can be compared withfigures3(a) and(b). Note that for Ge-20 nm, with largerg0*, the JDOS of the relatively weak, higher CR energy transitions is greater than that for Ge-10 nm, in agreement with experiment. Finally,figures5(g)and(h)illustrates the mean linewidthΓfrom the JDOS calculation(where each CR’s contribution is weighted by its amplitude)at different
B. The oscillation evident inΓpresent maxima at integerfilling factor and minima at half-integerν. The JDOS is narrowest when the uppermost LL is half-full, at half-integerν. This gives a qualitative explanation for the oscillation inG( )B from experiment reported infigures3(e)and(f).
Conclusion
In summary, the longitudinal and transverse magnetoconductivity of strained Ge quantum wells has been characterized, in a non-contact manner, by means of polarisation-resolved THz-TDS. An improved mobility, but a lower spin-splitting energy, was found in comparison to Ge-QWs with lower strain. By determining the off-diagonal component of the conductivity tensor experimentally the OQHE at terahertz frequencies was observed for spin-split HHs states, apparent as plateaux-like structures in the normalisedsxy. Samples with
different well width resulted in qualitatively different OQHE features, as a result of the suppressedg-factor in narrow quantum wells changing the Zeeman energy. This work expands the number of material systems known to exhibit the OQHE, and suggests a promising future for strained Ge in fundamental and applied physics. It is also important to undertake further experimental and theoretical studies of the OQHE to understand how localised and delocalised states contribute.
Acknowledgements
The authors would like to acknowledge funding from the EPSRC(UK, project EP/J003263/1‘Spintronic device physics in Si/Ge Heterostructures’)and the ERC(Advanced Grant,‘Quantum Metamaterials in the Ultra Strong Coupling Regime’).
References
[1]Manchon A, Koo H C, Nitta J, Frolov S M and Duine R A 2015Nat. Mater.14871 [2]Moriya Ret al2014Phys. Rev. Lett.113086601
[3]Morrison C, Myronov M, Wiśniewski P, Rhead S D, Foronda J and Leadley D R 2014Appl. Phys. Lett.105182401 [4]Failla M, Myronov M, Morrison C, Leadley D R and Lloyd-Hughes J 2015Phys. Rev.B92045303
[5]Dobbie A, Myronov M, Morris R J H, Hassan A H A, Prest M J, Shah V A, Parker E H C, Whall T E and Leadley D R 2012Appl. Phys. Lett.101172108
[6]Myronov M, Morrison C, Halpin J, Rhead S, Foronda J and Leadley D 2015Solid-State Electron.11035 [7]Shi Q, Zudov M A, Morrison C and Myronov M 2015Phys. Rev.B91241303
[8]Mironov O A, D’Ambrumenil N, Dobbie A, Leadley D R, Suslov A V and Green E 2016Phys. Rev. Lett.116176802 [9]Fischetti M V and Laux S E 1996J. Appl. Phys.802234
[10]Schäffler F 1997Semicond. Sci. Technol.121515
[11]Winkler R 2003Spin–Orbit Coupling Effects in Two-Dimensional Electron and Hole Systems(Berlin: Springer)
[12]Morimoto T, Hatsugai Y and Aoki H 2009Phys. Rev. Lett.103116803
[13]Ikebe Y, Morimoto T, Masutomi R, Okamoto T, Aoki H and Shimano R 2010Phys. Rev. Lett.104256802 [14]Stier A Vet al2015Phys. Rev. Lett.115247401
[15]Shimano R, Yumoto G, Yoo J Y, Matsunaga R, Tanabe S, Hibino H, Morimoto T and Aoki H 2013Nat. Commun.41841
8
[16]Maissen C, Scalari G, Valmorra F, Beck M, Faist J, Cibella S, Leoni R, Reichl C, Charpentier C and Wegscheider W 2014Phys. Rev.B90 205309
[17]van der Valk N C, van der Marel W A and Planken P C 2005Opt. Lett.302802
[18]Lloyd-Hughes J, Jones S P P, Castro-Camus E, Doig K I and MacManus-Driscoll J L 2014Opt. Lett.391121 [19]Arikawa T, Zhang Q, Ren L, Belyanin A A and Kono J 2013J. Infrared Millim. Terahertz Waves34724 [20]Akhiezer A I 1975Plasma Electrodynamics(Oxford: Pergamon)
[21]O’Connell R F and Wallace G 1982Phys. Rev.B262231 [22]Palik E D and Furdyna J K 1970Rep. Prog. Phys.331193
[23]Lloyd-Hughes J, Beere H E, Ritchie D A and Johnston M B 2008Phys. Rev.B77125322
[24]Engelhardt C M, Többen D, Aschauer M, Schäffler F, Abstreiter G and Gornik E 1994Solid-State Electron.37949 [25]Wang X, Hilton D J, Ren L, Mittleman D M, Kono J and Reno J L 2007Opt. Lett.321845
[26]Drew H D and Coleman P 1997Phys. Rev. Lett.781572 [27]Lloyd-Hughes J 2014J. Phys. D: Appl. Phys.47374006 [28]Some D and Nurmikko A V 1994Appl. Phys. Lett.653377
[29]Levinshtein M E, Rumyantsev S L and Shur M 2001Properties of Advanced Semiconductor Materials: GaN, AlN, InN, BN, SiC, SiGe(New York: Wiley)
[30]Scriba J, Wixforth A, Kotthaus J P, Bolognesi C, Nguyen C and Kroemer H 1993Solid State Commun.86633
[31]Davies J H 1998The Physics of Low-Dimensional Semiconductors: An Introduction(Cambridge: Cambridge University Press)http://loc. gov/catdir/toc/cam024/97000088.html
[32]Ando T, Fowler A B and Stern F 1982Rev. Mod. Phys.54437
[33]Englert Th, Maan J C, Uihlein Ch, Tsui D C and Gossard A C 1983Solid State Commun.46545