University of Twente.
Faculty of Behavioural, Management and Social Science
Age differences in Energy Drink
Consumption and its associated Factors
Using the Prototype Willingness Model to analyse the differences between adolescents, youngadults and adults in the determinants of Energy Drink Consumption
Janina Deiters
Date: 25 of June 2019
1
stSupervisor: N.J. Peeters
Abstract
Background: Consuming Energy Drinks can have a lot of serious health consequences
(Curran & Marczinski, 2017). That is why it is interesting to investigate why people consume it. Hereby, especially, differences in ages can be seen. The consumption of Energy Drinks is the highest for young adults whereas adolescents already start consuming those beverages (WHO, 2014). Further, the consumption of Energy Drinks seems to decline with age.
Consequently, it is interesting to see in what determinants for Energy Drink Consumption the age groups differ. In order to investigate the different determinants for Energy Drink
Consumption the Prototype Willingness Model is used.
Aim: The aim of this research is to find differences in the determinants of Energy Drink Consumption based on three different age groups, namely, adolescents (12-17years), young adults (18-25years) and adults (>25years) and to find out to what extent the Prototype Willingness Model can explain the Energy Drink Consumption in the three age groups.
Methods: 207 participants who either consumed or did not consume Energy Drinks, filled in a self developed questionnaire that investigated the components of the PWM.
Results: The results showed that the model could be best explained by the young adults. Overall, attitude and subjective norm seemed to be of importance with regard to the
consumption of Energy Drinks. Further, there are clear differences between the intention to consume Energy Drinks and the willingness to consume energy drinks between the age groups
Conclusion: Future intervention should focus on changing the attitude of Energy Drink Consumer. Moreover, the differences between the intention and the willingness to consume Energy Drinks should be regarded. In addition, as age differences seem to exist, future interventions should concentrate on age specific interventions.
Introduction
Nowadays consuming Energy Drinks (EDs) is very common. Advertising campaigns of energy drinks mainly target young adults. According to the WHO (2014), in Europe 68% of adolescents and 53% of young adults consume EDs. Further, about one-third of adults
consume these beverages. The reasons for them for consuming those drinks seem to be among others, to get more energy, to stay awake or to mix it with alcohol (Attila & Çakir, 2011). Marketing campaigns highlight the boosting effects of their EDs. The drinks are promoted in their effect of enhancing concentration, alertness, improving physical and mental activity (Buxton & Hagan, 2012). But these positive effects of the beverage are only short term (Smit & Rogers, 2000). EDs contain a high amount of caffeine, stimulants like taurine and other ingredients that can lead to several negative consequences (Attila & Çakir, 2011).
Consuming an ED has shown to be especially problematic for adolescents due to its ingredients (Ludden, O’Brien, & Pasch, 2017). Especially, the consumption of the caffeine in the beverage can have serious health effects on them due to their lower tolerance and smaller body size (Curran & Marczinski, 2017). According to Curran and Marczinski (2017) caffeine alone can increase blood pressure and heart rate. This is supported by Bichler, Swenson & Harris (2006), who state that the consumption of EDs raises and influences the mean arterial blood pressure level and promotes the change in heart rate. Further, as the brain is still developing, it is very sensitive to caffeine intake. Caffeine can even impair some cognitive abilities (Curran & Marczinski, 2017). In addition, also the level of taurine in an ED is problematic. High levels of taurine can naturally be found in the brain. An interruption of these levels is mentioned in studies concerning neurological disorders like epilepsy (Curran & Marczinski, 2017).
The association between energy drink consumption (EDC) and problem behaviour can also be found in adults (Malinauskas Aeby, Overton, Carpenter-Aeby & Barber-Heidal, 2007). Further, besides other, the consumption of the beverage can lead to a reduction of insulin sensitivity and chronic headaches (Bichler, et al. 2006; Schwer, Stewart, Liption, 2004). A study done by Malinauskas, et al. (2007) supported this by stating that ED
consumers reported weekly headaches and additionally heart palpitations. (Kim, Sim & Choi, 2017). Further, the association between chronic headaches and high caffeine consumption could be found especially among women (Scher, Stewart, & Lipton, 2014).
Summing up the gathered information about the consequences of EDs, it can be seen consuming these drink can be very harmful for the human body for every age group. In consequence, the question arises why people engage in such health risk behaviour of consuming energy drinks.
Prototype Willingness Model related to Energy Drink Consumption
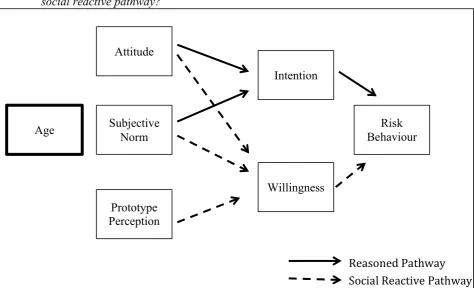
In answering the prior asked question, the model developed by Gibbons and Gerrad (1995), the Prototype Willingness Model (PWM), could help. The model was developed for the analysis of the prediction of such health-risk behaviour. It is used for health-promoting but also health-risk behaviour especially in adolescents (Gibbons & Gerrad, 1995). This model was already applied in other studies, especially in those that analysed smoking and alcohol drinking patterns. But it was rarely used for energy drink consumption. It was developed under the assumption that risk behaviours could be reactions to specific risk environments a person may face and that risk behaviours are not always planned. (Lewis, Litt, Tomkins, & Neighbors, 2017). The model is presented below the text (Figure 1). Although, there is not much research done in applying the PWM to EDC it seems to be a good conceptual framework in explaining this behaviour. Especially, as it already was used for other risk behaviours like alcohol consumption (Todd, Kothe, Mullan, & Monds, 2016) is not much research done about applying the Prototype Willingness Model to EDC.
EDs especially when experiencing social pressure to consume those beverages (Thorlton & Collins, 2017).
On the other side there is the Social Reactive Pathway, which demonstrate that Attitude, Subjective Norm and Prototype Perception leads to the Willingness to engage in the risk behaviour (Gerrad, Gibbons, Houlihan, Stock, & Promery, 2008). Due to the fact that research concerning Prototype Perception seems to be missing, no clear data concerning the Social Reactive Pathway could be found. As a result this paper could fill in this gap by researching the different components and their relations to EDC.
In the description of the two pathways it can be seen that overall, the model consists of five components namely attitude, social norm, prototype perception, intention and
willingness.
The first component is the attitude of the person with regard to the behaviour (Gibbons & Gerrad, 1995). Studies found out that with regard to EDC consumptions, students (between 18 and 25 years) consuming the beverage seem to have an overall positive attitude towards ED as they consume it to enhance their cognitive performance and to combat fatigue health (Thorlton & Collins, 2017). In addition, they thought it would be beneficial for their health, as they thought that EDs would improve weight loss, and that the vitamins, and herbal
ingredients contained in EDs would promote the health (Thorlton & Collins, 2017). Research concerning the attitude towards EDC is rare. As a consequence, this paper could fill in a gap by finding out how attitude is related towards EDC in the different age groups. Whereas this paper could also fill in the gab of research concerning adolescents attitude related to EDC, some interesting available research could be found about this age group for the second component of the model, namely Subjective Norm.
willingness to consume an ED is besides others influenced by the Prototype Perception of a person, it could reveal new insights into the determinants of EDC. Consequently, the aim of this paper is also to find out how the variable Prototype Perception is related to EDC
especially with regard age groups differences. Prototype Perception is separated into two components namely, the prototype perception and prototype similarity (Gibbons & Gerrad, 1995). The former describes the picture a person has of a typical person who engages in the specific behaviour (Gibbons & Gerrad, 1995). The latter regards in how far the person thinks to be similar or different from the typical person who engages in the behaviour (Gibbons & Gerrad, 1995).
In contrast to the Prototype Perception, the following components have been partly researched. Besides the determinants of Attitude, Subjective Norm and Prototype Perception, the PWM differentiates between the intention to engage in behaviour, and the willingness to engage in it (Todd, Kothe, Mullan, & Monds, 2016). The intention to e.g. consume EDs means that the behaviour is mostly planned. That means, the individual intends to engage in the behaviour (Todd, Kothe, Mullan, & Monds, 2016). According to Thorlton & Collins (2017), young adults (18-25) intent to consume EDs especially, in relation with a positive attitude towards EDC. As no research concerning the intention to consume EDs regarding the other age groups could be found, it is aimed to also investigate in this topic.
Speaking about the missing research concerning the component intention, also willingness needs to have more attention. Willingness means that a person does not
intentionally wants or plans to engage in the behaviour but still may engage in it when it is available (like in a social situation, when a friend offers a drink) (Todd, Kothe, Mullan, & Monds, 2016). Also here, information concerning the different age groups and their
willingness to engage in EDC is missing. Investigating the willingness to consume EDs, could reveal differences between the age groups. Consequently, this gap is tried to be filled with this research .
could bring more insights into the determinants of consuming energy drinks. That is why this research includes energy drink consumers and non-consumers split over different age groups.
Concluding, with this research it is tried to fill in the gaps about how far the different age groups differ in their determinants (Attitude, Subjective Norm; Prototype Perception, Intention and Willingness) of EDC. The PWM is used as a conceptual framework to examine the differences between various age groups in their EDC. To examine whether age has an effect on the PWM regarding the risk behaviour of consuming energy drinks the variable age
will be added to the model. By applying the model to the case of EDC for different age groups, it could reveal different determinants for engaging or not engaging in consuming energy drinks. In that way it could be found out which variable is most important when it comes to deciding in engaging in the behaviour of EDC. As a result, future interventions for preventing EDC due to its health risks could be based on the determinants that seemed to be important. In conclusion the two research questions are asked:
1.To what extent do the age groups differ in the consumption of ED and their underlying determinants of attitude, subjective norms, prototype perception, intention and willingness? 2.To what extent is EDC determined by the variables of the PWM and which variables are most important for each age group, especially with regard to the reasoned pathway and the social reactive pathway?
[image:7.595.30.505.429.717.2]Methods Study Design
A cross-sectional survey was conducted. It involved a self-developed questionnaire, which examined all five components of the PWM (Attitudes, Subjective Norms, Prototype
Perception, Intention, and Willingness) regarding EDC and its relation to age (Appendix 2). For this research, the sample was separated in three different age groups namely, Adolescents (age 12 – 17), Young Adults (age 18 – 25) and Adults (age> 25) to examine the different effects of age on the determinants of consuming ED. Age acted as the independent variable and EDC as the dependent variable. Further, as this research was a collaborative project with three other bachelor students also other variables were examined: gender, physical activity and sensation seeking; as these variables also could have had an influence on the consumption of energy drinks.
Participants and Procedure of the Study
The inclusion criteria for this study were being at least twelve years old. Further, having sufficient knowledge about the English language was necessary to take part, especially for the participants who were 18 years or older. The younger participants received a questionnaire in the Dutch language, to ensure comprehensiveness. Excluded were participants who were younger than 12 years old or who disagreed to the informed consent (or parental consent), as well as participants who did not complete the questionnaire.
After constructing the survey via the web-based tool Qualtrics, a hyperlink was established through which the access to the survey was possible. As soon as the study was ethically approved by the BMS Ethics Committee of the University of Twente, the study could be distributed. Hereby, three different distribution methods were used. First of all, the study was uploaded on SONA System. On this online platform, students from the University of Twente can take part in this study and receive course credit in return. Secondly, the
agree to the written informed consent in order to start the survey. The informed consent contained information about the confidentiality and anonymity of the data of the participants. As already stated the under-aged participants received a special consent for their legal
representatives beforehand so that they could take part. The survey took approximately 25 minutes to be completed. The different scales were shortly introduced with a descriptive sentence about what had to be done. A logic skip and display algorithm was used in order to be sure that all questions that need to be answered were answered and that other questions were skipped. That means, e.g.: participants, who indicated at the beginning that they do not consume ED, did not receive questions regarding their EDC patterns. It was also ensured that participants were not able to skip questions they were not supposed to skip.
When completed, the participants were thanked for their participation. Students who completed the questionnaire via SONA Systems received 0.5 credits as a reward from the researcher. After approximately 250 participants completed the questionnaire, the survey was stopped.
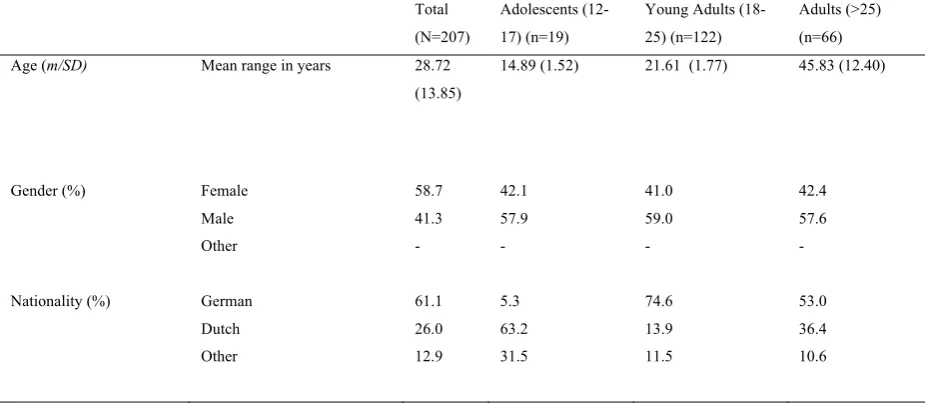
Overall, the study included N=207 participants with Mage=28.72 SDage=13.85 from which 58.7% were female and 41.3% were male (Table 1). The nationalities of the
Table 1
Demographic Data of Participants. Age (in M,SD), gender (in %) nationality, divided by three age groups and the total sample.
Total (N=207)
Adolescents (12-17) (n=19)
Young Adults (18-25) (n=122)
Adults (>25) (n=66) Age (m/SD) Mean range in years 28.72
(13.85)
14.89 (1.52) 21.61 (1.77) 45.83 (12.40)
Gender (%) Female 58.7 42.1 41.0 42.4
Male 41.3 57.9 59.0 57.6
Other - - - -
Nationality (%) German 61.1 5.3 74.6 53.0
Dutch 26.0 63.2 13.9 36.4
Measures
Overall, the questionnaire consisted of 42 items. It contained questions investigating the components of the PWM (Attitudes, Subjective Norms, Prototype Perception, Intention, and Willingness) in relation to the consumption of ED, a scale for sensation seeking, items regarding the physical activity of the individual and finally the demographic variables of the participants.
The questionnaire addressed the following topics applicable to this survey: 1) EDC Pattern
2) PWM
a. Attitude towards EDC b. Subjective Norm c. Prototype Perception d. Intention to consume EDs e. Willingness to consume EDs
3) Demographic Data (age, gender, nationality, level of education) In the following, each significant topic for this survey, covered by the questionnaire will be described in more detail.
ED consumption patterns.
The first topic covered in the questionnaire was the consumption patterns of EDs. The first item was asked to identify whether the participant had ever drunk an ED (e.g.: Have you ever drunk an energy drink?). Further, in case the participant had ever drunk an ED, it was asked how regularly and to what extent the consumption took place (e.g.: Over the last few months, on how many days during the week did you usually drink Energy Drinks?). The answer options varied from 1=one day to 7=seven days.
By creating this questionnaire the article of Ajzen (2006) was used as used as a support in building the items. The five components are Attitude, Subjective Norm, Prototype Perception, Intention, and Willingness.
Attitude towards EDC.
Firstly, for the investigation of the Attitude, the participant had to the consumption of energy drinks two scales were given. The first scale measured the Direct Attitude towards EDC and the second scale consisted of beliefs about advantages and disadvantages when consuming EDs. In order to measure the Direct Attitude towards EDC, a set of opposite adjectives was given. The participants had to rate on a five-point Likert scale (ranging from 1=strongly disagree to 5=strongly agree) towhich adjective they think EDC fits better (e.g.: For me, Energy Drink consumption is: unpleasant-pleasant; good-bad).The scores of the items were averaged into a Direct Attitude Scale. The reliability for this scale was 0.92. Further, the second scale consisted of a set of 15 beliefs, and the participants had to classify on a five-point Likert scale (1=strongly disagree to 5=strongly agree) in how far they agree/disagree with those beliefs (e.g.: Drinking Energy Drink improves one’s athletic performance). For the analysis, the scale was separated into positive and negative beliefs. The scores of the positive beliefs were averaged into a Advantages of ED scale and the scores of the negative scale were averaged into a Disadvantage of ED scale.The reliability of the Advantages scale was 0.71 and for the Disadvantages scale was 0.75. A high score (5) on the scales indicated a positive attitude towards EDC.
Subjective Norm.
Secondly, the Subjective Norm was measured in form of one scale. It investigated the normatives beliefs, the participant perceives on whether he or she should consume EDs (e.g:
Prototype Perception.
Thirdly, the component of Prototype Perception was separated into two topics, namely, Favourability and Similarity. The first topic was measured by asking the participants to think how they would describe a typical person who consumes energy drinks (e.g.: For me a typical energy drink consumer at my age is…). 20 Adjectivessuch as: cool, lazy or dynamic were presented to the participants and they should have rated on a five-point Likert scale (1=not at all to 5=very much) in how far they think the adjective represent a typical energy drink consumer. For calculating a score the scale was separated into positive and negative adjectives. As a result, the positive items were averaged into the Positive Prototype
Perception Scale and the negative items were averaged into the Negative Prototype Perception Scale. A high score (5) on both scales indicated a positive prototype peprception of ED
consumers. The reliability for the positive adjective scale was 0.90, and for the negative scale it was .87.
Then, in order to investigate the Prototype Similarity, four questions/statements were given to investigate, in how far the participants themselves think they are similar to the typical energy drink consumer at their age (e.g.: I am comparable to the typical person my age that regularly consumes Energy Drinks). The answers option were a five-point Likert scale, which differed for each question in their formulation due to the sentence structure of the statement (e.g.: 1=strongly disagree to 5= strongly agree). The items were averaged to a Prototype Similarity scale. A high score (5) on the Prototype Similarity scale suggested that the participant had a high Prototype Perception. The reliability for the similarity scale was .86.
Intention to consume EDs.
tired. Your co-driver offers you an Energy Drink. How willing are you to consume that drink?). The questions should be answered on a five-point scale (1= Definitely not willing, to 5= Definitely willing). The items were averaged into the Willingness scale. A high score (5) indicated a high willingness to consume ED. The reliability of the scale was .90.
Demographic Data.
The questions concerning the demographic data were placed at the end of the questionnaire. These questions regarded asking about gender, age, nationality and level of education.
Further, the participants were given the opportunity to make comments and recommendations with regard to the questionnaire.
Data Analysis
For the data analysis, the data was imported into the statistical program SPSS v. 24 (2017). Data applicable for this study was used, therefore, the data concerning the sensation seeking scale, and physical activity scale was removed from the dataset before the data analysis took place.
The first analysis concerned the inspection of the demographics of the participants. This analysis included the distribution of gender, nationality, age, and energy consumer/no energy drink consumer in the sample. Then, descriptive statistics (means, frequencies) were calculated to assess the drinking behaviour of the participants. Afterward, an ANOVA was applied to examine differences in the EDC between the three age groups. In order to assess the relationships between the variables of the model (Attitude, Subjective Norm, Prototype Similarity, Intention, Willingness, and EDC) Pearson correlations were computed.
Additionally, also for each age group, Pearson correlations were computed
Subsequently, to examine the relative contribution of the determinants from the model and the variable age, sets of three stepwise multiple regression analyses were applied. The first stepwise regression analysis examined EDC as the dependent variable and age,
Results Description of Drinking Behaviour
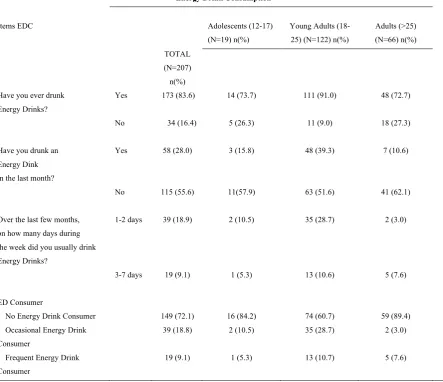
The description of the drinking behaviour of the participants is displayed in Table 2. It shows the frequencies on the EDC Scale for the total sample and the three different age groups. The sample included 72.1% ‘No ED Consumers’, 18.8% Occasional ED Consumers’ and 9.1% ‘Frequent ED Consumers’. This was against the expectations as most of the participants were between 18 and 25 years old, a higher amount of occasional or frequent ED consumers was predicted.
Due to the low amount of ED consumers, the overall distribution of ED consumer in the three different age groups was as expected. Most participants drinking EDs, both
Table 2
Frequencies of Energy Drink Consumptions separated for each age group (N=207)
Energy Drink Consumption
Items EDC Adolescents (12-17)
(N=19) n(%)
Young Adults (18-25) (N=122) n(%)
Adults (>25) (N=66) n(%) TOTAL
(N=207) n(%) Have you ever drunk
Energy Drinks?
Yes 173 (83.6) 14 (73.7) 111 (91.0) 48 (72.7)
No 34 (16.4) 5 (26.3) 11 (9.0) 18 (27.3)
Have you drunk an Energy Dink in the last month?
Yes 58 (28.0) 3 (15.8) 48 (39.3) 7 (10.6)
No 115 (55.6) 11(57.9) 63 (51.6) 41 (62.1)
Over the last few months, on how many days during the week did you usually drink Energy Drinks?
1-2 days 39 (18.9) 2 (10.5) 35 (28.7) 2 (3.0)
3-7 days 19 (9.1) 1 (5.3) 13 (10.6) 5 (7.6)
ED Consumer
No Energy Drink Consumer 149 (72.1) 16 (84.2) 74 (60.7) 59 (89.4) Occasional Energy Drink
Consumer
39 (18.8) 2 (10.5) 35 (28.7) 2 (3.0)
Frequent Energy Drink Consumer
Differences in Determinants and Drinking Behaviour between Groups
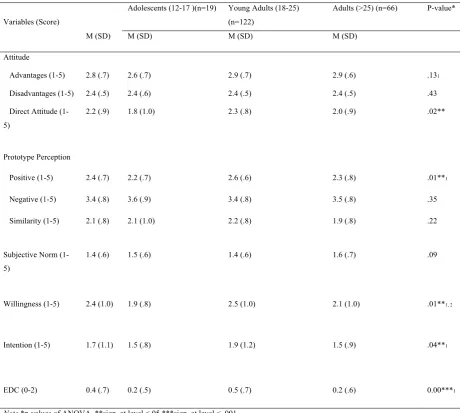
The different scores on the variables of the PWM and the drinking behaviour were calculated for the total group and for each sample. Further, in order to investigate whether the scores between the three groups differ significantly, the means were analysed with an ANOVA. The means, standard deviations, and p-values from the ANOVA are presented in Table 3.
Looking at the means, what was striking was that the means from the variables of Attitude, Prototype Perception and Willingness were on medium level. Next the table showed that the mean scores Intention were lower than medium, which was not surprising due to the low amount of ED consumers. Next, the low mean on Subjective Norm indicated that the participants had a low social pressure to consume EDs.
From the table it can be read that the young adults had significantly higher scores on EDC, Intention, Willingness, Positive Prototype Perception and Direct Attitude than the adults. That means, that the young adults consumed significantly more EDs, and also had a higher Intention and Willingness to drink these beverages. Further, the young adults had a significantly higher positive prototype perception and a more positive attitude towards EDC. In addition, from the table it can be seen that the adolescents scored significantly lower on the Willingness to consume EDs than the young adults. That means that overall adolescents had a lower Willingness to consume EDs than the other age groups.
Table 3
Results (M,SD) for each scale separated by three age groups (N=207), including p-value of the ANOVA
Variables (Score)
Adolescents (12-17 )(n=19) Young Adults (18-25) (n=122)
Adults (>25) (n=66) P-value*
M (SD) M (SD) M (SD) M (SD)
Attitude
Advantages (1-5) 2.8 (.7) 2.6 (.7) 2.9 (.7) 2.9 (.6) .131
Disadvantages (1-5) 2.4 (.5) 2.4 (.6) 2.4 (.5) 2.4 (.5) .43
Direct Attitude (1-5)
2.2 (.9) 1.8 (1.0) 2.3 (.8) 2.0 (.9) .02**
Prototype Perception
Positive (1-5) 2.4 (.7) 2.2 (.7) 2.6 (.6) 2.3 (.8) .01**1
Negative (1-5) 3.4 (.8) 3.6 (.9) 3.4 (.8) 3.5 (.8) .35
Similarity (1-5) 2.1 (.8) 2.1 (1.0) 2.2 (.8) 1.9 (.8) .22
Subjective Norm (1-5)
1.4 (.6) 1.5 (.6) 1.4 (.6) 1.6 (.7) .09
Willingness (1-5) 2.4 (1.0) 1.9 (.8) 2.5 (1.0) 2.1 (1.0) .01**1, 2
Intention (1-5) 1.7 (1.1) 1.5 (.8) 1.9 (1.2) 1.5 (.9) .04**1
EDC (0-2) 0.4 (.7) 0.2 (.5) 0.5 (.7) 0.2 (.6) 0.00***1
Note.*p-values of ANOVA, **sign. at level <.05 ***sign. at level < .001
Model Analysis
Correlation analysis.
The correlation from the model can be found in Table 4. Overall, like the model proposed there were strong associations between Intention, Willingness and the problem behaviour of EDC in the Total group. EDC. In addition, the model proposed an association between the variables of the reasoned pathway and Intention. Further, also the variables of the social reactive pathway showed significant associations with willingness only the variable Negative Prototype Perception showed no significant association.
Overall, against the expectations that the model proposed, there were only a few association between the variables for the groups of the adolescents (12-17). The only
association with the EDC could be found with Intention and Willingness. The age group with the young adults (18-25) showed significant associations with EDC and all other
determinants. On the other side the group of the adults showed only a few associations with EDC. Hereby, Intention, Willingness, and Attitude ( Advantages of EDC and Direct Attitude) showed significant association with EDC.
Significant associations in accordance with the reasoned pathway could be seen in all three age groups. In the group with the young adults, all variables associated with reasoned pathway showed a significant association. Whereas, in the group with the adolescents, the Advantages of EDC did not have an association with the Intention to consume EDs and in the group with adults, the Disadvantages did not have an association with the intention to
consume EDs.
The variables concerning the social reactive pathway, could only be significant for the young adults group (only Negative Prototype Perception did not have association with
Willingness). Whereas, for the group of Adults, no significant association with the Prototype Perception could be found, for the group of the adolescents only, the Negative Prototype perception showed a significant correlation.
Table 4
Bivariate Correlation Coefficient between the variables of the PWM with EDC, Intention and Willingness for the total group (N=207) and separated by the three age groups
Total Group (n=207) Adolescents (12-17) (n=19)
Young Adults (18-25) (n=122)
Adults (>26) (n=66)
Variables EDC Int. Will. EDC Int. Will. EDC Int. Will EDC Int. Will.
1 EDC 1 .78** .61** 1 .60** .46* 1 .79** .65** 1 .80** .53**
2 Intention 1 .64** 1 .47* 1 .63** 1 .68**
3 Willingness 1 1 1 1
Attitude
3 Advantage .32** .30** .35** .33 .39 .42 .31** .27** .29** .33** .34** .40** 4 Disadvantage .15* .20** .27** .05 .58* .29 .23* .21* .35** .09 .14 .19 5 Direct
Attitude
.56** .62** .69** .41 .62** .73** .66** .67** .67** .33** .49** .69**
6 Subjective Norm
.19** .30** .26** -.05 .47* .34 .35** .37** .25** .09 .26* .36**
Prototype Perception
7 Positive .20** .25** .32** .43 .29 .25 .18* .29** .40** .08 .09 .13 8 Negative .17* .13 .12 .-.00 .31 .51* .23* .11 .16 .18 .19 .04 9 Similarity .35** .42** .29** .20 .35 .07 .43** .48** .43** .18 .27* .07
Regression analysis.
For all three age groups, three different stepwise hierarchical multiple regression models were employed to predict the consumption of ED, the Intention to consume ED and the Willingness to consume an ED. In Table 5 the results of the hierarchical regression analysis are presented for each age group.
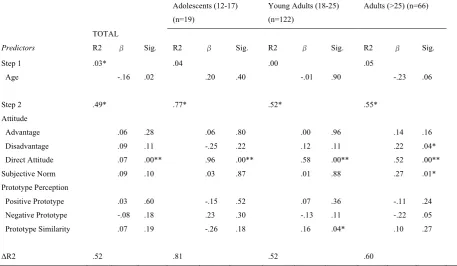
Prediction of EDC.
For the first stepwise hierarchical multiple regression analysis in accordance with the PWM EDC were used as the dependent variable with Age, Attitude, Subjective Norm, Prototype Perception, Intention, and Willingness used as a predictor (Table 5). The analyses were conducted for each age group separately.
Interesting was that the total explained variance was high for all the age groups. Only for the Adults age (-.33) could explain some of the behaviour of consuming EDs. In the age group with the young adults there were the most variables that could contribute to the
Table 5
Stepwise hierarchical multiple regression model to explain EDC, with age, Attitude, Subjective Norm, Prototype Perception, Intention and Willingness as predictors, separated per age group and total group (N=207)
Predictors for EDC
Adolescents (12-17) (n=19)
Young Adults (18-25) (n=122)
Adults (>25) (n=66)
TOTAL (n= 207)
Predictors R2 β Sig. R2 β Sig. R2 β Sig. R2 β Sig.
Step 1 .05* .05 .01 .11*
Age -.22 .00* 0.23 .34 .07 .44 -.33 .00*
Step 2 .34* .38 .51* .19
Attitude
Advantage .10 .13 -.30 .93 .04 .47 .30 .03* Disadvantage -.01 .93 -.33 .34 .02 .81 .08 .54 Direct Attitude .45 .00* .21 .19 .64 .00* .12 .38 Subjective Norm .06 .31 .27 .49 .13 .08 .05 .67 Prototype Perception
Positive -.05 .45 .30 .71 -.18 .03 -.04 .78 Negative .00 1.0 .21 .19 -.12 .15 .04 .80 Prototype Similarity .18 .00* .16 .47 .20 .01* .13 .28
Step 3 .27* .36 .19* .39*
Intention .66 .00* .86 .01* .58 .00* .82 .00* Willingness .16 .01* .57 .17 .20 .01* .06 .62
ΔR2 .66 .79 .71 .69
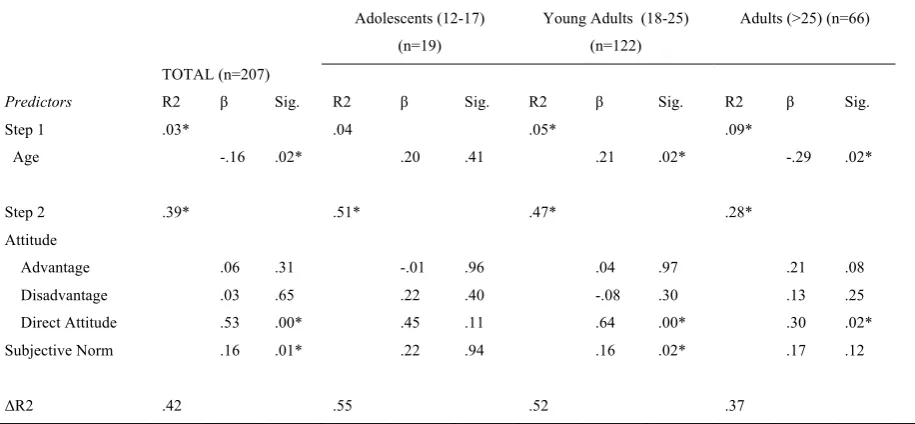
Prediction for the Intention to consume ED.
The second stepwise hierarchical multiple regression model was employed to predict the intention to consume ED, with age, Attitude, and Subjective Norm used as predictors for the, based on the assumptions of the PWM about the Reasoned Pathway. The results, separated per age groups are shown in Table 6.
Table 6
Stepwise hierarchical multiple regression model to explain Intention to consume ED, with age, Attitude and Subjective Norm, as predictors, separated per age group and total group (N=207)
Predictor for Intention to consume ED
Adolescents (12-17) (n=19)
Young Adults (18-25) (n=122)
Adults (>25) (n=66)
TOTAL (n=207)
Predictors R2 β Sig. R2 β Sig. R2 β Sig. R2 β Sig.
Step 1 .03* .04 .05* .09*
Age -.16 .02* .20 .41 .21 .02* -.29 .02*
Step 2 .39* .51* .47* .28*
Attitude
Advantage .06 .31 -.01 .96 .04 .97 .21 .08 Disadvantage .03 .65 .22 .40 -.08 .30 .13 .25 Direct Attitude .53 .00* .45 .11 .64 .00* .30 .02* Subjective Norm .16 .01* .22 .94 .16 .02* .17 .12
ΔR2 .42 .55 .52 .37
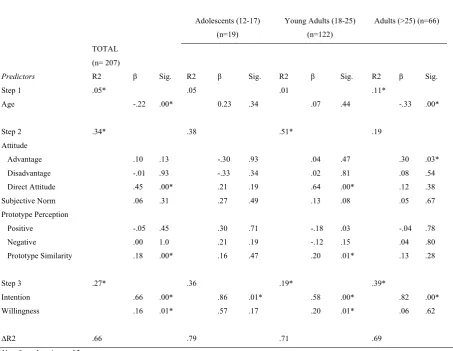
Prediction for Willingness to consume ED.
In the third stepwise hierarchical multiple regression model for the prediction of the
Willingness to consume EDs, age, Attitude, Subjective Norm, and Prototype Perception were used as predictors, which was in accordance with the social reactive model. In table 7, the results of the regression analysis can be found separated per age group.
Overall, the total explained variance varied for each age group. Interestingly, it was very high for the age group of the adolescents (81%). In this age group only Direct Attitude (β=.96) could significantly contribute to the explanation of the EDC. Age could not contribute to any explanation of the Model for no age group. In the age group with the young adults, Direct Attitude (β=.58), as well as, Prototype Similarity (β=.16) could significantly contribute to the explanation of the Willingness to consume EDs. In contrast to the other age group in the age groups with the adults, the Disadvantages of EDs (β=.22), Direct Attitude (β=.52) towards EDC and also Subjective Norm (β=.27) could significantly contribute to the
Table 7
Stepwise hierarchical multiple regression model to explain Willingness to consume ED, with age, Attitude, Subjective Norm, and Prototype Perception as, separated per age group and total group (N=207)
Predictors for Willingness to consume ED
Adolescents (12-17) (n=19)
Young Adults (18-25) (n=122)
Adults (>25) (n=66)
TOTAL
Predictors R2 β Sig. R2 β Sig. R2 β Sig. R2 β Sig.
Step 1 .03* .04 .00 .05
Age -.16 .02 .20 .40 -.01 .90 -.23 .06
Step 2 .49* .77* .52* .55*
Attitude
Advantage .06 .28 .06 .80 .00 .96 .14 .16 Disadvantage .09 .11 -.25 .22 .12 .11 .22 .04* Direct Attitude .07 .00** .96 .00** .58 .00** .52 .00** Subjective Norm .09 .10 .03 .87 .01 .88 .27 .01* Prototype Perception
Positive Prototype .03 .60 -.15 .52 .07 .36 -.11 .24 Negative Prototype -.08 .18 .23 .30 -.13 .11 -.22 .05 Prototype Similarity .07 .19 -.26 .18 .16 .04* .10 .27
ΔR2 .52 .81 .52 .60
Discussion
All in all, the topic of this paper was to find out age differences with regard to EDC and its determinants. In the following, the research questions will be answered. The first research question was: ‘To what extent do the age groups differ in the consumption of ED and their underlying determinants of Attitude, Subjective Norms, Prototype Perception, Intention, and Willingness?’. Overall, the three age groups differ in their consumption of EDs. In the group of the young adults (18 – 25) most people consumed EDs whereas the adults have the highest amount of non ED consumers. This can be supported by the WHO (2014) who suggests that mostly young adults between 18 and 25 consume EDs. That can be explained by the fact that mostly young adults are targeted in commercials for EDs. Further, in the group of adolescents there are more ED consumers than in the group of adults. This could be supported by the WHO (2014) who stated that almost 70% of adolescents consume EDs. Further, it is said that the EDC declines with age, which can be supported by the WHO (2014). On the other side, this result could also be explained by the fact that the sample size of the adolescents was very low in contrast to the adults, and as a consequence, both could not be comparable.
The difference based on the underlying determinants are not as distinct. Clear differences can be be seen between young adults and adults. Overall, young adults have a more positive attitude towards EDC than adults. This was in accordance with Thorlton & Collins, (2017) who suggest that especially students consuming EDs have an overall positive attitude towards EDC. Further, in contrast to adults, young adults seem to consider ED consumers as being more positive.
willingness could be further investigated. Out of this information, intervention could be more specified.
Further, this result could also be explained by the fact that there were only a few participants in that age group and only one person that regularly consumed EDs.
The second research question regarded the relations of the variables of the PWM also separated by the age groups. Hereby the research question was as followed:
To what extent is EDC determined by the variables of the PWM and which variables are most important for each age group (social reactive pathway, reasoned pathway)?
Regarding the explanation for EDC, the intention to consume EDs and the willingness to consume ED, different patterns can be regarded for the age groups.
Overall, for the determination of EDC fewer variables as expected are important. What needs to be noticed is that only for young adults all variables of the PWM to determine the
behaviour of EDC are of importance.
When regarding which variables are especially relevant for the different age groups it can be seen that, for adolescents, especially, Attitude, Subjective Norm and a Negative Prototype Perception are of importance in determining the EDC.
Further, determining the EDC of young adults, all variables seem to be relevant besides having a negative prototype perception and age. To be more precise especially when explaining EDC in young adults, the attitude towards EDs, Prototype Similarity, the Intention to consume EDs and the Willingness to consume EDs are of importance.
Finally, for adults only Attitude, Subjective Norm seems to be of importance when determining the EDC. Further, with regard to adults, age, and the intention to consume EDs was important in explaining the EDC.
As a consequence, it is important to say that especially, attitude and subjective norm are associated with EDC in all age groups.
The Social Reactive Pathway seems to be of importance especially for the young adults, whereas the adolescents seem only be slightly affected by it. For Adolescents, it seems to be important what kind of attitude they have in explaining the willingness to consume EDs. Further, in young adults, the Attitude towards EDs, and in how far young adults think that they are similar to a typical ED are of importance in explaining the Willingness to consume ED. Further, age and attitude could contribute to the Intention to consume EDs in adults.
This result can make a contribution for research as this pathway was not yet regarded by other researchers. The Social Reactive Pathway is associated with EDC in young adults and adolescents, as a consequence investigating further in the different determinants like Attitudes, Subjective Norm and especially Prototype Perceptions could reveal new information in explaining why these beverages are consumed.
Regarding the explanation for EDC, the intention to consume EDs and the willingness to consume ED, different patterns can be regarded for the age groups. For adolescents, it seems to be important what kind of attitude they have in explaining the willingness to consume EDs.
When explaining EDC in young adults especially, the attitude towards EDs, Prototype Similarity, the Intention to consume EDs and the Willingness to consume EDs are of importance. Age does not have an influence on explaining the EDC. With regard to the Intention to consume EDs in young adults, age, the Attitude towards EDs and the perceived opinion of the social environment seem to explain EDC. For the explanation of Willingness, the Attitude towards EDs, and in how far young adults think that they are similar to a typical ED are of importance. Overall, the result that Attitude and Subjective Norm explained EDC could be supported by Thorlton & Collins (2017) who also supported that the reasoned pathway is important when deciding to consume EDs. Further, Attitude and Subjective Norm seems to explain the Willingness to consume EDs in adults. These results revealed new insights into the determinants for EDC in adults. What was very interesting was that age was the only predictor in this case.
Strengths and Limitations
The strength of this research was that the self-developed scales had an overall good reliability and therefore, a good internal consistency. Further, the research included participants who either drunk EDs or that did not drunk EDs. That was different than to other researches before and gave new insights in also non-energy drink consumers with regard to their determinants of not consuming EDC. That was important as it could be shown which determinants are important for non ED consumer in their behaviour of refusing to consume EDs. In addition, noticeable is that the topic of different age groups and their different and their determinants in EDC is a rarely researched topic. As a consequence, this topic could give new insights
through the newly gained knowledge in the research of EDC.
Besides the strength of the study, also some limitations were faced. Overall, the distribution of participants in the age groups was unequal. This unequal distributions could have had an influence on the generalizability of the results. Further, the number of
participants that were adolescents was very low. That could explain why the age group of the adolescents did not reveal the results that were expected. Further, against the expectations of the researchers, there were a lot more non-ED consumers than ED consumers, which could have influenced the results. As a consequence, when replicating the study a broader sample should be the focus, which concentrates especially on age differences. Further, a clearer distribution of ED consumers and non consumers should be aimed.
Conclusion
It can be concluded that investigating age difference concerning the determinants of EDC with the help of the PWM revealed some interesting new points of research. There are in fact age differences especially with regard to Attitude, and the Intention or Willingness to
References
Attila, S. P., & Çakir, B. M. (2011). Energy-drink consumption in college students and associated factors. Nutrition, 27 (3), 316-322. doi:10.1016/j.nut.2010.02.008 Ajzen, I. (2002). Constructing a TpB Questionnaire: Conceptual and Methodological
Considerations. Retrieved from
https://pdfs.semanticscholar.org/0574/b20bd58130dd5a961f1a2db10fd1fcbae95d.pdf Bichler, A., Swenson, A., & Harris, M. A. (2006). A combination of caffeine and taurine has
no effect on short term memory but induces changes in heart rate and mean arterial blood pressure. Amino Acids, 31 (4), 471-476. doi:https://doi.org/10.1007/s00726-005-0302-x
Buxton, C., & Hagan, J. E. (2012). A survey of energy drinks consumption practices among student-athletes in Ghana: lessons for developing health education intervention programmes. Journal of the International Society of Sports Nutrition. 9(9). doi:https://doi.org/10.1186/1550-2783-9-9
Curran, C. P., & Marczinski, C. A. (2017). Taurine, caffeine, and energy drinks: Reviewing the risks to the adolescent brain. Birth Defects research, 109 (20), 1640-1648. doi:10.1002/bdr2.1177
Gerrad, M., Gibbons, F. X., Houlihan, A. E., Stock, M. L., & Pomery, E. A. (2008). A dual-process approach to health risk decision making: The prototype willingness model.
Developmental Reiew, 28 (1), 29-61. doi:10.1016/j.dr.2007.10.001
Gibbons, F. X., & Gerrad, M. (1995). Predicting young adults' health risk behaviour. Journal of Personality and Social Psychology, 69 (3), 505-517.
doi:http://dx.doi.org/10.1037/0022-3514.69.3.505
Kim, S.Y. , Sim, S., Choi, H. G. (2017) High stress, lack of sleep, low school performance, and suicide attempts are associated with high energy drink intake in adolescents. PLoS ONE, 12(11) doi:https://doi.org/10.1371/journal.pone.0187759
Malinauskas, B. M., Aeby, V. G., Overton, R. F., Carpenter-Aeby, T., & Barber-Heidal, K. (2007). A survey of energy drink consumption patterns among college students.
Nutrition Journal . 35(6). doi:https://doi.org/10.1186/1475-2891-6-35
Marczinski, C. A., Fillmore, M. T., Bardgett, M. E., & Howard, M. A. (2011). Effects of Energy Drinks Mixed with Alcoholon Behavioural Control: Risks for College Students Consuming Trendy Cocktails. Alcoholism: Clinical and Experimental Research , 35 (7), 1282-1292. doi: 10.1111/j.1530-0277.2011.01464.x.
Scher, A., Stewart, W., & Lipton, R. (2004). Caffeine as a risk factor for chronic daily headache: a population-based study. Neurology, 63(11), 2022-2027.
doi:10.1212/01.wnl.0000145760.37852.ed
Smit, H. J., & Rogers, P. J. (2000). Effect of low doses of caffeine on cognitive performance, mood and thirst in low and higher caffeine consumers. Psychopharmacology, 152 (2), 167-173. doi:https://doi.org/10.1007/s00213000050
Thorlton, J., & Collins, W. B. (2017). Underlying Beliefs Associated With College Student Consumption of Energy Beverages. Western Journal of Nursing Research, 40(1), 5-19. https://doi.org/10.1177/0193945916686961
Todd, J., Kothe, E., Mullan, B., & Monds, L. (2016). Reasoned versus reactive prediction of behaviour: a meta-analysis of the prototype willingness model. Health Psychology Review, 10 (1), 1-24. doi:10.1080/17437199.2014.922896
Appendix 1 Questionnaire
Energy Drink Consumption
Start of Block: Default Question Block
High Energy Drink Usage
This research aims to get an insight into the attitudes and considerations of adolescents and adults regarding the consumption of High Energy Drinks. The questionnaire contains questions about the consumption of these drinks, and about the beliefs, you and your
environment have about these drinks. In addition, there will be some general questions about the type of person that you are e.g., if you are engaged in sports and if you like to do exciting things. Participation in this study is based on a voluntary basis. Before being able to
participate in this study, agreeing on the terms mentioned in the informed consent is required. Especially, for the participants between 12 and 16 years of age, thus who are underage, there is a need to obtain informed consent from you and your parents or your legal representative(s) before taking part. When agreeing on these terms, you can start with the online survey, which takes approximately 25 minutes. You have the right to decline to participate and withdraw from this research at any time. Withdrawing from the study does not have any negative
Informed Consent
As already stated, there are more aspects that need to be acknowledged before taking part in this study. There are no physical, legal or economic risks associated with participating in this study. Moreover, there are no guaranteed benefits for you by taking part in this study. Your privacy will be protected to the maximum extent allowable by law. No personally identifiable information will be reported in any research product. Moreover, only trained research staff will have access to your responses. Within these restrictions, the results of this study will be made available to you upon request. Moreover, the gathered data will only be used for the bachelor thesis and are not shown to third parties. Therefore, only the researchers Dilara Kocol, Nina Bergner, Jacob Heinze, and Janina Deiters plus their supervisors Dr. Marcel Pieterse, Dr. Stans Drossaert and Nienke Peeters, MSc, have access to the data. By clicking on ‘Yes, I agree’, it indicates that you are at least 16 years of age or that you are the legal guardian of the participant and allow him or her to take part in this research; you have read this consent form or have had it read to you; your questions have been answered to your satisfaction and you voluntarily agree that you will participate in this research study.
' I hereby declare that I agree to participate in a research project led by Dilara Kocol, Nina Bergner, Jacob Heinze, Janina Deiters. I have been given sufficient information about this research project. The purpose of my participation in this project has been explained to me and is clear. My participation in this project is voluntary. There is no explicit or implicit coercion whatsoever to participate. It is clear to me that in case I do not want to continue the
questionnaire, I am at any point of time fully entitled to withdraw from participation. I have been given the explicit guarantees that, the researcher will not identify me by name or function in any reports using information obtained from this interview, and that my confidentiality as a participant in this study will remain secure. I have been given the
o
No, I do not agree (2)Skip To: Thank you If Informed Consent As already stated, there are more aspects that need to be acknowledged before... = No, I do not agree
Description
In the following, you will be asked some questions about your behavior and consumption in relation to Energy Drinks. Before answering the next questions, it is important that you are aware of what an Energy Drink is. An Energy Drink usually contains sugar and stimulants like caffeine. Further, they may contain taurine, sweeteners, herbal extracts and amino acids. Its ingredients, mostly caffeine, are marked to provide the consumer with the benefits like alertness and enhancement of physical and mental activity. One Energy Drink unit is considered as 250ml. Typically, Energy Drinks are for example Rockstar, Red Bull or Monster, but other Energy Drinks do count as well.
Energy Drinks? Have you ever drunk Energy Drinks?
o
Yes (1)o
No (2)Skip To: Intro Attitude If Have you ever drunk Energy Drinks? = No
Last Month? Have you drunk an Energy Drink in the last month?
o
Yes (1)o
No (2)Skip To: Intro Attitude If Have you drunk an Energy Drink in the last month? = No
Days Over the last few months, on how many days during the week did you usually drink Energy Drinks?
o
Never (1)o
1 day (2)o
2 days (3)o
3 days (4)o
4 days (5)o
5 days (6)o
6 days (7)o
Every day (8)Skip To: Intro Attitude If Over the last few months, on how many days during the week did you usually drink Energy Drinks? = Never
How many On a day on which you drink an Energy Drink, how many Energy Drinks (one drink = 250ml ) do you usually have?
o
1 drink (1)o
2 drinks (2)o
3 drinks (3)o
4 drinks (4)o
5 or more drinks (5)Intro Attitude
Attitude towards Energy Drink consumption The next few questions are about your attitude according to Energy Drink consumption. (Please tick and answer each of the following
questions, also if you do not drink Energy Drinks). In the following two adjectives are opposed. Please indicate on the scale which adjective represent more your attitude towards Energy Drink consumption the more you.
Consumption is.. For me, Energy Drink consumption is...
1 (1) 2 (2) 3 (3) 4 (4) 5 (5)
harmful
o
o
o
o
o
beneficialunpleasant
o
o
o
o
o
pleasantbad
o
o
o
o
o
goodworthless
o
o
o
o
o
valuableRegular Consumption For me, REGULAR Energy Drink consumption is...
1 (1) 2 (2) 3 (3) 4 (4) 5 (5)
harmful
o
o
o
o
o
beneficialunpleasant
o
o
o
o
o
pleasantbad
o
o
o
o
o
goodworthless
o
o
o
o
o
valuableunenjoyable
o
o
o
o
o
enjoyableIntro Beliefs Beliefs
Now, you will be presented with several statements which you have to evaluate by
Q Beliefs In how far do you agree to the following statements:
Strongly
disagree (1) Disagree (2)
Neither agree nor disagree
(3)
Agree (4) Strongly agree
(5)
1. Drinking Energy Drinks
boosts one’s energy. (1)
o
o
o
o
o
2. Drinking Energy Drinks increases one’s heart rate. (2)
o
o
o
o
o
3. Drinking Energy Drinks improves one’s attention span.
(3)
o
o
o
o
o
4. Drinking Energy Drinks improves one’s athletic performances. (4)
o
o
o
o
o
5. Drinking Energy Drinks regularly leads to an increased blood pressure.
7. Drinking Energy Drinks
deteriorates one’s mood.
(7)
o
o
o
o
o
8. Drinking Energy Drinks deteriorates one’s academic performances. (8)
o
o
o
o
o
9. Drinking Energy Drinks regularly deteriorates one’s teeths. (9)
o
o
o
o
o
10. Drinking Energy Drinks impairs one’s athletic performances. (10)
o
o
o
o
o
11. Drinking Energy Drinks
13. Frequently drinking Energy Drinks
could finally lead to addiction to these drinks.
(13)
o
o
o
o
o
14. Drinking Energy Drinks
leads to sleeplessness.
(14)
o
o
o
o
o
15. Drinking Energy Drinks improves one’s
mental abilities, for
example memory, imagination and thinking.
(15)
o
o
o
o
o
Intro social pressur Opinions around you regarding Energy Drink consumption This part of the questionnaire is about statements related to the ‘subjective norm’, which is about “the perceived social pressure to perform or not to perform the behavior" (Ajzen,
1991). (Please tick and answer each of the following questions, also if you do not drink Energy Drinks).
Expectations Please indicate what you think your friends/family expect you to do:
Strongly
disagree (1) Disagree (2)
neither agree nor disagree
(3)
Agree (4) Strongly agree
(5)
Friends important to me think that I
should consume
Energy Drinks. (1)
o
o
o
o
o
Expectation 2 Please indicate on the scale in how far you agree with the following statements.
Strongly
disagree (1) Disagree (2)
Neither agree nor disagree
(3)
Agree (4) Strongly agree
(5)
1. It is expected from
me that I consume Energy Drinks
when I am surrounded by my friends. (1)
o
o
o
o
o
2. The people in my life whose opinion
I value would agree with my
weekly consumption
of Energy Drinks. (2)
o
o
o
o
o
3. When it comes to Energy Drinks, I comply to the opinion of my friends. (3)
o
o
o
o
o
Intro Prototype A typical person consuming Energy Drinks The next few questions are dealing with how you perceive a typical person your age, who is regularly drinking Energy Drinks. Therefore, think one minute about the typical person your age who regularly consume Energy Drinks. (Please tick and answer each of the following questions, also if you do not drink Energy Drinks).
Q Prototype Please indicate how far you think the following attributes represent a typical person who consumes Energy Drinks. A typical person at your age who regularly consume Energy Drinks is...
Not at all (1) Not really (2) Neutral (3) A little bit (4) Very much (5)
Cool (1)
o
o
o
o
o
Dynamic (2)
o
o
o
o
o
Confident (3)
o
o
o
o
o
Independent
(4)
o
o
o
o
o
Popular (5)
o
o
o
o
o
Careful (6)
o
o
o
o
o
Smart (7)
o
o
o
o
o
Athletic (8)
o
o
o
o
o
Childish (13)
o
o
o
o
o
Boring (14)
o
o
o
o
o
Not attractive
(15)
o
o
o
o
o
Immature (16)
o
o
o
o
o
Selfish (17)
o
o
o
o
o
Lazy (18)
o
o
o
o
o
Unreliable (19)
o
o
o
o
o
Chaotic (20)
o
o
o
o
o
Intro Similarity A typical Energy Drink consumer compared to you The questions below are related in how far you think a typical Energy Drink consumers is similar to yourself. (Please tick and answer each of the following questions, also if you do not drink Energy Drinks).
Q Similarity 1 Do you resemble the typical person your age that regularly consumes Energy Drinks?
o
Definitely not (1)o
Probably not (2)o
Might or might not (3)o
Probably yes (4)o
Definitely yes (5)
Q Similarity 3
I am comparable to the typical person my age that regularly consumes Energy Drinks.
o
Strongly disagree (1)o
Disagree (2)o
Neither agree nor disagree (3)o
Agree (4)Q Similarity 4
To what extent are you like the typical person your age that regularly consumes Energy Drinks?
o
To no extent at all (1)o
To almost no extent (2)o
Neutral (3)o
To some extent (4)o
To a great extent (5)Intro Intention Behavioral Intention
Q Intention Please indicate how strongly you agree with the following statements.
Strongly
disagree (1) Disagree (2)
Neither agree nor disagree
(3)
Agree (4) Strongly agree
(5)
I intend to consume at
least one Energy Drink
in the next month. (1)
o
o
o
o
o
I intend to drink an Energy Drink
in the next week. (2)
o
o
o
o
o
I intend to consume at
least some Energy Drinks
(3 or more) in the next month. (3)
o
o
o
o
o
I intend to consume at
least some Energy Drinks
(3 or more) in the next week.
Intro Willingness Willingness
Q Willingness Please indicate in how far you are willing to consume an Energy Drink in the following situations: Definitely not willing (1) Probably not willing (2) Might or might not willing (3) Probably willing (4) Definitely willing (5) Suppose you have to drive home late at night and you get tired. Your
co-driver offers you an Energy Drink.
How willing are you to consume that
drink? (1)
o
o
o
o
o
Suppose you are at a party
where everybody is drinking Energy Drinks. How willing are you to join them and take
an Energy Drink
offers you an Energy Drink.
How willing are you to consume the Energy Drink?
(3)
When someone offers an Energy Drink
to you at a party, how willing are
you to consume it?
(4)
o
o
o
o
o
Imagine you did not sleep a
lot last night and you are tied. A friend offers you an Energy Drink.
Would you consume the Energy Drink?
willing are you to consume it?
(6)
Imagine a friend of you offers you an Energy Drink.
How willing are you to consume it?
(7)
o
o
o
o
o
Q Sensation Please indicate in how far you agree to the following statements.
Strongly
disagree (1) Disagree (2)
Neither agree nor disagree
(3)
Agree (4) Strongly agree
(5)
1. I would like to explore strange places.
(1)
o
o
o
o
o
2. I would like to take off on a trip with no pre-planned routes or timetables. (2)
o
o
o
o
o
3. I like to do frightening
things. (3)
o
o
o
o
o
4. I would like to try parachute-jumping. (4)
o
o
o
o
o
5. I like wild
parties. (5)
o
o
o
o
o
6. I like new and exciting experiences,
8. I prefer friends who are excitingly unpredictable.
(8)
o
o
o
o
o
Q Sport? Do you do sport?
o
Yes (1)o
Maybe (2)o
No (3)Skip To: Intro demographics If Do you do sport? = No
Intro Sport Sport Questions
Now, four questions regarding participation in sports activities will be asked.
Q Amount sport 1. How many days during one week, on average, do you do sport?
________________________________________________________________
Q Hours sport 2. How many hours during one week, on average, do you do sport?
________________________________________________________________
Q what sport 3. What is the sport you do the most?
Q Level sport 4. On what level do you do the sport, mentioned in the question before?
o
Recreational (1)o
Competitive (amateur) but not too fanatically (2)o
Competitive (amateur) fanatically (3)o
Competitive professional (not paid) (4)o
Competitive professional (paid) (5)Intro demographics Demographic Data
Gender What is your gender?
o
Male (1)o
Female (2)o
Other (3)Age How old are you? Please fill in your age:
________________________________________________________________
Nationality What is your nationality?
Education What highest level of education do you have?
o
Student (1)o
High School Diploma (2)o
College Diploma (3)o
Bachelor's degree (4)o
Master's degree (5)o
Other (6) ________________________________________________Email for findings There is the opportunity offered to get a summary of the main findings. Please enter your email address in the box, if you are interested to receive the main results.
________________________________________________________________
comments/recommds If you have any comments or recommendations please indicate them in the box below.
Thank you Thank you for taking part in our survey. If you have any further questions or recommendations, please feel free to contact the researcher.
Dilara Kocol ([email protected]) Nina Bergner ([email protected]) Jacob Heinze ([email protected]) Janina Deiters ([email protected])

![Working towards telecom 2000: launching the programme Race [R&D in Advanced Communication Technololgies in Europe]. COM (88) 240 final/2, 31 May 1988](data:image/gif;base64,R0lGODlhAQABAIAAAP///wAAACH5BAEAAAAALAAAAAABAAEAAAICRAEAOw==)