University of Warwick institutional repository: http://go.warwick.ac.uk/wrap
A Thesis Submitted for the Degree of PhD at the University of Warwick
http://go.warwick.ac.uk/wrap/57210
This thesis is made available online and is protected by original copyright. Please scroll down to view the document itself.
i | P a g e
Piezoelectric Microsensors for Semiochemical Communication
by Shrey Pathak
Microsensors and Bioelectronics Research Group School of Engineering
University of Warwick
A thesis submitted to the University of Warwick for the degree of Doctor of Philosophy
ii | P a g e
iii | P a g e
Table on Contents
List of Figures vii
List of Tables x
Abstract xi
Acknowledgements xii
Declaration xiii
Chapter 1 - Introduction 1
1.1 Chemical Communication 2
1.2 Scope of Current Work 4
1.3 Objectives of the Current Research 7 1.4 Conclusion and Thesis Outline 10
Chapter 2 - Literature Review 12
2.1 Introduction 12
2.2 Mechanism of Odour Transduction 14
2.3 Olfactory Biosensing 18
2.3.1 Electrochemical Transducers 20
2.3.2 Optical Transducers 24
2.3.3 Acoustic or Resonant Transducers 28
2.3.3.1 The Piezoelectric Effect 29
2.2.3.1.1 Stress and Strain in an Elastic Solid 32
2.3.3.2 Acoustic Wave Propagation 35
2.2.3.2.1 The Wave Equation 35
2.2.3.3 Bulk Acoustic Wave Device 43
2.2.3.4 Surface Acoustic Wave Devices 47
2.2.3.4.1 Rayleigh Wave 47
2.2.3.4.2 Shear Horizontal – Surface Acoustic Wave 48
2.2.3.4.3 Love Wave 50
2.4 Conclusion 52
Chapter 3 - Detection of Volatile Organic Compounds using TSM microsensors 53
3.1 Introduction 53
3.2 Quartz Crystal Microbalance 55
3.2.1 Polymer Selection Principle 56
3.2.2 Polymer Deposition Procedure 60
3.3 Prototype Infochemical Communication System 61
iv | P a g e
3.3.2 The Chemo Emitter Unit 63
3.3.3. The Combined Communication System 65
3.4 Polymer Sensitivity Analysis 67
3.4.1 Experimental Methodology 67
3.4.2 Experimental Results 69
3.5 Infochemical Communication 71
3.5.1 Experimental Methodology 71
3.5.2 Experimental Results 73
3.6 Conclusion 74
Chapter 4 - Acoustic Wave microsensors – Perturbation and Detection mechanism 75
4.1 Introduction 75
4.2 Surface Acoustic Waves 76
4.2.1 Properties 76
4.2.2 Operating Configurations 78
4.3 Acoustic Wave Perturbation 81
4.3.1 Detection Mechanism 82
4.3.2 Mechanical Interactions 84
4.3.3 Viscous Coupling 85
4.3.4 Effects of Mass Loading 86
4.3.5 Acoustoelectric Interaction 88
4.3.6 Temperature Effects 91
4.4 Generalised Model 92
4.5 Conclusion 98
Chapter 5 - Design of Surface Acoustic Wave (SAW) microsensors for Liquid and Vapour Phase Applications 99
5.1 Introduction 99
5.2 Design Parameters 100
5.2.1 Substrate Selection 100
5.2.2 Frequency Selection 102
5.2.2.1 IDT Design 106
5.2.2.2 Reflector Design 110
5.2.2.3 Metallisation 113
5.3 Design Procedure: Calculation of Spacing Parameter 114
5.3.1 IDT-IDT Spacing 115
5.3.2 IDT-Reflector Spacing 116
5.4 SAW Resonator Designs 118
5.4.1 Liquid Phase: SH-SAW Microsensor Design 120
v | P a g e
Chapter 6 - Characterisation of SH-SAW microsensors
and Measurement setup 124
7.1 Introduction 124
7.2 Wafer Dicing and Packaging 124
7.3 SAW IDT Parameter Measurement 127
7.3.1 RF Characterization of One Port SH-SAW Microsensors 129
7.3.2 RF Characterization of Two Port SH-SAW Microsensors 131
7.4 Measurement Systems 137
7.4.1 Oscillator Setup 140
7.5 Microfluidic Chamber Design 142
7.5.1 PDMS based Central Housing Unit 142
7.6 Conclusion 146
Chapter 7 - Experimental results using Sf9 whole cell coated SH-SAW microsensors 147
7.1 Introduction 147
7.2 Experimental Methodology 148
7.3 Experimental Results 154
7.3.1 Acoustically monitoring Sf9 Cell adherence characteristics using 228.79MHz SH-SAW devices 154
7.3.2 Acoustically monitoring receptor-ligand interactions by 228.79MHz SH-SAW devices. 157
7.3.3 Acoustically monitoring the adherence profile of Sf9 insect cells by 60MHz SH-SAW devices integrated with an automated system. 160
7.3.4 Acoustically measuring cellular reaction in Sf9 (W) type cells and Octopamine Hydrochloride using 60.56 MHz SH-SAW micro-sensors. 163
7.4 Result Discussion 165
7.4.1 Sf9 Cell Attachment 165
7.4.2 Octopamine Concentration 170
7.4.2.1 Modified Generalised Model 170
7.4.2.2 Octopamine Hydrochloride concentration dependence 175 7.5 Conclusion 178
Chapter 8 - Conclusion and Future Work 8.1 Introduction 180
8.2 Objectives of the Current Work 182
i | P a g e
References 186
Appendix A: Polymer Selection Experimental Data 200 Appendix B:Ratiometric Experimental Data 206 Appendix C: SH-SAW microsensors LiTaO3
(sensor details) 208 Appendix D: Rayleigh SAW on ST-Quartz
(sensor details) 209
ii | P a g e
List of Figures
Figure Description Page
Figure 1.1 Figure 1.2 Figure 2.1 Figure 2.2 Figure 2.3 Figure 2.4 Figure 2.5 Figure 2.6 Figure 2.7 Figure 2.8 Figure 2.9 Figure 2.10 Figure 2.11 Figure 2.12 Figure 2.13 Figure 2.14 Figure 2.15 Figure 3.1 Figure 3.2 Figure 3.3 Figure 3.4 Figure 3.5 Figure 3.6 Figure 3.7
An infochemical communications system.
The different subsystems comprising the chemoreceiver. Scanning Electron Microscopy(SEM) image of Drosophila head showing the olfactory sensilla (A) and the maxillary pulp (B). The fluid mosaic model of cell membrane along with a simplified view of the odour detection using membrane proteins (A), Insect olfaction through the seven transmembrane receptors (7TM) showing different levels from antennae to membrane.
A biologically sensitive FET microsensor with an immobilised gate electrode.
Optical technique employed in olfactory biosensing.
Surface plasmon resonance technique which employing light excited plasmons to sense the changes in the immobilized
biological layer (a), commercially available SPR detection system - Biacore SPR T200 and GWC SPRImagerII (b).
Acoustic wave microsensors (a) a Bulk Acoustic Wave (BAW) microsensor and (b) a Surface Acoustic Wave (SAW)
Microsensor.
Concept of piezoelectricity – on application of an alternating electric field a crystal with dimensions l, b and h, changes to l´, b´, h´ due to the generation of stress on its faces.
The different mechanical and electrical variable relating the stress and strain in a piezoelectric substrate.
Different particle displacement profiles due to the stresses on a solid with (a) longitudinal while both (b, c) being shear.
Propagation vector of the acoustic waves.
Sagittal plane view demonstrating the strain in a piezoelectric substrate due to the application of the field. It also depicts the particle displacement demonstrating the formation of a surface Rayleigh Wave.
A Quartz Crystal Microbalance along with the wave generated shear wave.
Shown is the Rayleigh mode propagation.
A surface acoustic wave microsensor (a) with the generated SH-mode (b).
A Love wave SAW microsensors consisting of a waveguide on a piezoelectric substrate.
Schematic diagram illustrating the absorption of vapour into a polymer layer.
The different properties of the polymer and their corresponding solute according to the LSER relationship.
Polymer deposition procedure.
The four channel JLMQ USB Interface Board (courtesy JLM Innovation, Tübingen, Germany).
A 5 channel neMYSYS automated syringe pump platform. The different volatile components of Apple, Hawthorn Dogwood. The prototype infochemical communication system also showing
iii | P a g e Figure 3.8 Figure 3.9 Figure 3.10 Figure 4.1 Figure 4.2 Figure 4.3 Figure 4.4 Figure 4.5 Figure 4.6 Figure 4.7 Figure 5.1 Figure 5.2 Figure 5.3 Figure 5.4 Figure 5.5 Figure 5.6 Figure 5.7 Figure 5.8 Figure 5.9 Figure 5.10 Figure 5.11 Figure 6.1 Figure 6.2 Figure 6.3 Figure 6.4 Figure 6.5 Figure 6.6
the exploded view of the odour chamber.
Linear Discriminant Analysis (LDA) of the four fruit blends, 3 – Methylbutan-1-ol (3M), ethyl acetate (EA), hexyl butanoate (HB) and butyl hexanoate (BH).
Simulated results of Ratiometric coding. Ratiometric information decoded.
Schematic illustration of the Rayleigh (a) and SH SAW (b). Single port SAW sensor (a) and a dual or two port SAW sensor (b).
A SAW delay line sensor (a) and a SAW resonator sensor (b). Two different operational configurations of SAW sensors. Normalized particle displacement (u) and acousto-electric
rface for metalized (m) and metal free surface (f).
SAW microsensors in a dual device configuration. Sagittal view of the sensing area of a SAW sensor.
An experimental condition represented with one sensor coated with a biological coating and the other left bare with the differential signal shown.
SAW Resonator with the generated SH wave top view (a) and side view (b).
Shown the different penetration depths of the SH-SAW microsensors which are being probed.
Electron Microscopy picture of an Sf9 insect cell (Scale bar: 10µm) (Courtesy: Electron Microscopy Lab, University of Leicester).
Different IDT structures namely the Split finger design (a) and the Solid finger design (b) along with the Acoustic Aperture. Different design of the acoustic grating showing the (a) Etched grooves on the substrate, (b) patterned electrodes on the substrate surface, (c) Open Circuit- OC reflectors, (d) Short Circuit – SC reflectors, (e) Positive and Negative – P&N reflectors grooved.
Standing wave pattern in the sensing area (between the IDTs). Standing wave pattern between the IDT and Reflectors. A dual synchronous SH-SAW resonator.
Schematic representation of the layouts used for a synchronous SH-SAW Resonator showing the traditionally used layout (a) and the layout designed and employed for the current work (b). Extracted layout of the populated 4” wafer 36° YX LiTaO3 wafer. Fabricated and diced SH-SAW micro-sensors (resonators). Fabricated 60 MHz SH-SAW micro-device (a) two port free device; (b) two port shorted device; (c) two port heater device; b) one port resonator.
Fabricated 228 MHz SH-SAW micro-device (a) two port free device; (b) two port shorted device; (c) two port heater device; b) one port resonator.
The Network Analyser with the different ports (a) and a schematic representation of the power between the ports (b). S11 parameter of the SH-SAW microsensors (a) 60.56MHz, (b) 228.79MHz.
S12 parameter of the 60.56 MHz SH-SAW microsensors (a) free, (b) shorted, (c) heater.
iv | P a g e Figure 6.7 Figure 6.8 Figure 6.9 Figure 6.10 Figure 6.11 Figure 6.12 Figure 6.13 Figure 7.1 Figure 7.2 Figure 7.3 Figure 7.4 Figure 7.5 Figure 7.6 Figure 7.7 Figure 7.8 Figure 7.9 Figure 7.10 Figure 7.11 Figure 7.12 Figure 7.13 Figure 7.14 Figure 7.15 Figure 7.16
S12 parameter of the 228.69 MHz SH-SAW microsensors (a) free, (b) shorted, (c) heater.
The presence of both types of waves in the crustal substrate (a) Bulk or SSBW and (b) Leaky.
A phase measurement system. A frequency measurement setup
The fabricated oscillator board along with the mounted SH-SAW microsensor.
PDMS base microfluidic chambers.
The Automated system along with the associated circuitry. Sf9 cell adherence on (a) gold; (b) lithium tantalate (c) quartz (d) zinc oxide.
The dual SH-SAW sensor with the experimental and the control sensor and their differential signal.
Acoustic energy distribution of the acoustic (surface) wave. A two-step process adopted to protect the IDT’s and ensure limited growth area.
Immobilized Sf9 cells on the 228.79MHz SH-SAW microsensors along with SEM view of the adhered cells.
Sf9 cell attachment profile (a) signal background noise, (b) depicting the Sf9 cell suspension time and (c) showing the differential signal level.
Sf9 cell response to ligand octopamine.
Sf9 cell response to 100µM Octopamine Hydrochloride. Experimental setup for 60.56MHz SH-SAW.
Process of Sf9 cell injection.
60.56 MHz SH-SAW microsensors with immobilized Sf9 cells. Sf9 cell attachment profile using 60MHz SH-SAW sensor. 60MHz Shorted SH-SAW resonator biosensor response to [a] 12.5μM Octopamine, [b] 25μM Octopamine and [c] 50μM Octopamine, along with their respective differential signal with the orange arrow indicting the time when octopamine flows over both the Sf9 (W) cells and the control and the purple arrow denoting the time when ligand free media flows over the control and cells.
Sf9 cell attachment showing the different growth phases for 228.79MHz and 60.56MHz SH-SAW microsensors.
v | P a g e
List of Tables
Table Description Page
Table 1.1
Table 2.1 Table 2.2
Table 2.3
Different transducer classes, measurement techniques along with the respective measurand.
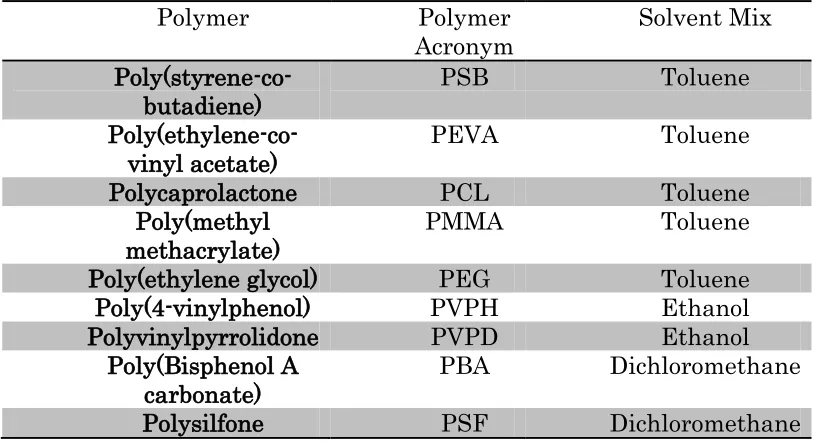
Polymers selected to coat the QCM microsensors.
Three batches of 9 polymer coatings with an uncoated QCM microsensor as a reference.
Frequency response of various polymers to 3-methylbutan-1-ol (3M) and ethyl acetate.
22 62
71
vi | P a g e Abstract
vii | P a g e Acknowledgements
Firstly, I would like to thank my academic supervisors Dr. Marina Cole and Professor Julian W. Gardner for providing me with the opportunity to work in this field. Their constant guidance and support during the course of this Ph.D was invaluable and irreplaceable. I would also like to thank Dr. James Covington for his support and encouragement during crucial phases of this research. My special thanks goes to Dr. Zoltán Raćz for it was his skills as a classic Socratic scholar that has helped me develop a critical approach. I would like to thank Professor John Challiss from the Department Cell Physiology and Pharmacology, University of Leicester for allowing me to setup experiments in his laboratory. I would also like to thank his group members for making me feel welcomed with special thanks to Dr. Mellisa Jordan for conducting numerous experiments with me and sharing the (many)2 frustrations and elations. At this juncture I would
also like to thank all the members of the iCHEM project consortium. It was a pleasure being a part of a dynamic and an intellectually enlightened group of researchers.
Next, I would like to thank Mr. Frank Courtney and Mr. Ian Griffiths for their unparalleled assistance in all mechanical and technical matters. I am also grateful for the friendship and support of my fellow group members including Dr. Gurmukh Sehra, Dr. Fauzan Che-Harun, Dr. Philip King, Dr. Marina Talib, Dr. James Taylor, Dr. Simon Leigh, Ms. Cecilia Occhiuzzi, Ms. Nathalie Ouaret, Mr.Max
viii | P a g e
Declaration
The work described in this thesis was conducted by the author, except where stated otherwise, in the School of Engineering, University of Warwick and at the Department of Physiology and Pharmacology, University of Leicester, United Kingdom. The thesis has not been submitted for a higher degree at another university. The following are a list of chapter with contribution from partners and collaborators.
Chapter 3: Experiments performed by Mr. Shrey Pathak and Data Analysed by Dr. Zoltan Racz (University of Warwick) Chapter 4: Theoretical Model developed in association with Professor
Julian Gardner (University of Warwick), Dr Melissa Jordan (University of Leicester) and Professor John Challiss
(University of Leicester)
Chapter 5: SH-SAW sensors frequency calculation performed in collaboration with Professor Julian Gardner, Dr Marina Cole, Dr. Zoltan Racz (University of Warwick), Dr. Danijela Markovic (University of Leicester)
and Professor John Challiss (University of Leicester) Chapter 7: Experiments performed at the University of Leicester,
ix | P a g e Parts of this work have been presented at international conferences and published in the scientific literature listed below:
- S. B. Olsson, Z. Rácz, W. P. Bula, N. Dimov, G. Carot-Sans, M. D. Jordan, S. Karout, L. S. Kuebler, D. Markovic, L. Muñoz, S. Pathak, R. A. J. Challiss, M. Cole, J. W. Gardner, J. G. E. Gardeniers, A. Guerrero, B. S. Hansson and T. C. Pearce, "iChem: An insect-inspired biomimetic infochemical communication system," 12th European Symposium for Insect Taste and Olfaction (ESITO), September 19-25, 2011, St. Petersburg, Russia.
- S. Pathak, M. D. Jordon, Z. Rácz, J. Challiss, J. W. Gardner, M. Cole, “Ligand elicited secondary cellular responses using Surface Acoustic Wave Biosensors”, FET11, The European Future Technology Conference
and Exhibition, 4th – 6th May, 2011, Budapest, Hungry.
- Z. Rácz, M. Cole, J. W. Gardner, S. Pathak, M. D. Jordon, J. Challiss, " Cell-based Surface Acoustic Wave Resonant Microsensor for Biomolecular Agent Detection,", The 16th International Conference
on Solid State Sensors, Actuators and Microsystems, June 5-9, 2011, Beijing, China.
- M. Cole, J. W. Gardner, S. Pathak, Z. Rácz, J. Challiss, D. Markovic, "Cell based biosensors for Biomedical Application", Proceedings of the 7th
IASTED International Conference, Biomedical Engineering, February 17th- 19th, 2010, Innusbruck, Austria.
- M. Cole, J. W. Gardner, Z. Rácz, S. Pathak, T. C. Pearce, J. Challiss, D. Markovic, B. S. Hansson, S. Olsson, L. Kubler, A. Guerroro, L. Munoz, G. Carot, J. G. E. Gardieners, N. Dimov, W. Bula, “Biomimetic insect infochemical communication system”, The 8th Annual IEEE Conference
on Sensors, October 25th – 28th, 2009, Christchurch, New Zealand.
- M. Cole, J. W. Gardner, S. Pathak, T. C. Pearce, Z. Rácz, “Towards a biosynthetic infochemical communication system”, Eurosensors XXII
1
Chapter 1
Introduction
The purpose of this first chapter is to contextualise the foundations on which the work presented in this thesis has been carried out. This chapter introduces the reader to the field of chemical communication, describing how an odour molecule or an odour plume
plays an informative role in the survival of the species. The chapter introduces the reader to the scope of the research carried out in this thesis. Thereafter, aims and objectives of the current research have then
2
1.1
Chemical Communication
Homo sapiens primarily depend on the stimuli of vision and
acoustics for communication. This is in stark contrast to the organisms
that live in the “odour space”. Such organisms (both vertebrates and invertebrates) employ “odours” as their primary stimuli for communication and correspondingly mediate their behaviour through the sense of smell. In this so called “odour world”, the chemical stimulus
plays a vital role in helping the species in a range of activities spanning from location of potential sources of food to gaining shelter from potential predators [2]. For example, Mythimna separate (caterpillar)
perceives day and night by recognising the blend of volatiles emitted by the host plant on which it lives, a female moth attracts its counterpart, the male, over a long distance by emitting sexual pheromones, a type of communication molecule, while some zooplanktic species form defensive
structures upon sensing odours which indicate the presence of their predators [3] [4]. When one considers the plethora of environmental stimuli, it is the specificity (orientation and combination) of an encoded
3 The infochemicals are detected by surface receptors, present on the antenna of an insect triggering a chain of biochemical reactions which translates the initial chemical signal into a neural signal. This signal is carried by the central and peripheral nerves and projected onto
the brain thus generating a perception of the information detected [5][6]. This generated perception of the detected infochemical is what determines the behaviour of the insect. Similar to the process of odour
detection, the generation of odour is also achieved by an organism through a set of complex processes, which involves several enzymatic reactions. This delicate process of odour emission and detection has evolved and refined over time by nature.
Assuming that the basis of chemical communication remains the same for insects presiding in a common space, the potential advantages of translating this mechanism of odour generation and detection into a novel infochemical communication system with varied applications has
opened new avenues of multi-disciplinary research. This vision formed the basis of the Biosynthetic Infochemicals Communication’s Project (iCHEM) a European Union STREP project which was established in
4
1.2
Scope of Current Work - The B
i
osynthetic
Info
chem
ical Communication (iCHEM) project
The central aim of the iCHEM project was to “investigate, designed and implement” a novel communication system based on the pheromone [8], a type of chemical signal, biosynthesis pathway for
detection of infochemical, encoded chemical signals, in the insect nervous system . The insect model which formed the basis of the research project was the moth Spodoptera littoralis [9]. This particular species was
chosen in the current study because of two distinct factors:
It has two distinct and well defined pheromone components.
The biological detection and pheromone generation pathways are well characterised.
Each process of the biosynthetic pathway i.e. pheromone generation and detection was then deployed as a discrete system in the project finally contributing to the realisation of a novel infochemical
communication system that would form to a new branch of information technology that employs chemical to transmit and receive information, Figure 1.1 [7] [10] [11]. The communication technology would include a
5 “chemoreceiver” unit which would be specifically tuned to detect and decode the emitted information. The pheromones of the moth S. littoralis
comprises of hydrocarbon chain of alcohol (R-OH), aldehydes (R-COH), acetate ester (R-OO) and organyl chemical groups and can be produced
in four clearly defined steps mediated by enzymatic reactions (where “ R- ” being a chain of carbon) [12] [13]. The steps include fatty acid synthesis, desaturation, hydrocarbon chain shortening, and
reduction/functional group modification [13]. Each step outlined above could then be implemented as a microreactor module with the final synthesized chemical released by a temperature controlled micro-evaporator unit [7] [14].
Figure 1.1: An infochemical communications system
The emitted infochemicals can be detected by a “chemoreceiver” unit that demonstrates a high degree of specificity and sensitivity to the infochemicals [7] - [11]. The detected chemical would be decoded by
Chemoemitter/receiver Chemoreceiver/emitter
Biological reactor
Odour encoding & Transmission
Odour Detection
Odour Decoding &
Perception Generation
6 employing a biophysical neuromorphic model that would mimic the ratiometric processing in the antenna lobe of the moth. Thus, in essence the chemoreceiver unit could be deconstructed into 2 different sub-systems each comprising of different sub-units. The first sub-system
could comprise of a blend specific olfactory receptor based sensing system – employed to detect the pheromones. The second sub-system could be said to comprise of a biophysics neuronal model responsible for
[image:23.612.156.537.342.581.2]decoding the detected pheromone blend, as shown in Figure 1.2 [7].
Figure 1.2 : The different subsystems comprising the chemoreceiver [14].
Chemoreceiver Unit
Odour Detection Odour Decoding
7 The research performed in this thesis has been aimed at enhancing the development of the chemoreceiver unit by designing, fabricating and characterising a ligand-specific acoustic wave sensing system. Such a system, as will be shown in later chapters of the thesis,
has been designed by employing acoustic wave microsensors and the sensing properties have been examined in two different operational phases - vapour and liquid phase. For vapour phase assessment, a
polymer coated quartz crystal microbalance (QCM) microsensors array was incorporated as part of a novel infochemical communication system detecting volatiles.
For liquid phase assessment, an insect cell-line – SF9 was
immobilised on surface acoustic wave (SAW) microsensors. This setup was then integrated with an automated microfluidic setup and characterised with different concentration of neurotransmitters.
1.3
Objectives of the Current Research
This section outlines the key objectives of the current research.
Demonstrate the use of polymer coated Quartz Crystal Microbalance
8 Examine the theoretical foundation of Surface Acoustic Wave (SAW) microsensors operating in the liquid phase.
Develop a theoretical model co-relating the acoustic wave penetration depths of the SAW sensor to the different regions within the immobilised
Sf9 cells – thus providing the option of examining different regions within a whole cell.
Design shear horizontal wave based SAW (SH-SAW) microsensors – in a
resonator configuration for liquid phase applications with central frequencies co-related to the acoustic wave penetration depth on 36° Y-cut X propagating lithium tantalate piezoelectric substrate.
Design Rayleigh surface acoustic wave (R-SAW) microsensors in a
resonator configuration on a ST-cut quartz crystal – for vapour phase measurements.
Outline fabrication process steps for both the SH-SAW and the R-SAW sensors. Characterise the SH-SAW devices using a Network Analyser
and integrate the SH-SAW devices with an oscillator circuit board.
Design and fabricate a biocompatible, polymer based, microfluidics unit to house the bio-selective coating and integrate it with the SH-SAW
microsensor, an automated system consisting of valves, pumps and a temperature controlled incubator.
Develop a protocol for the deposition and characterisation of the Sf9
9 demonstrating a novel fully functionalized G-protein coupled receptor (GPCR) cell based sensor.
Acoustically characterise the adherence profile Sf9 insect cells on the SH-SAW microsensor surface.
Examine the concept of ligand specific activation of Sf9 cell membranes proteins using octopamine hydrochloride – an invertebrate neurotransmitter.
1.4
Conclusion and Thesis Outline
This chapter introduced the reader to the field of chemical communication setting the context of the research presented in this
thesis. This chapter also outlined the objectives of the work carried out in the subsequent chapters.
The next chapter, Chapter 2, examines key principles of odour detection and how a chemical signal is translated into an electrical
signal that can be interpreted by the brain. This chapter provides an overview of the historical and current state of-the art detection techniques employed in the area of olfaction science e.g. electrochemical,
optical, resonant microsensors and covering their basic operational principle and recent developments.
10 Crystal Microbalance can be employed as a part of a prototype infochemical communication system to sense different fruit volatiles (chosen instead of odours for the current research). The microsensors were coated with a polymer coating and integrated with an automated
chemoreceiver system demonstrating sensitivity to the ratiometric mixture of volatile compounds.
Chapter 4 introduces the reader to the operational principle of
SAW microsensors and provides a detailed discussion of the different detection mechanisms involved. This chapter also introduces the reader to the various available design layout and configurations.
Chapter 5 outlines the design principle and the methodology of
the SH-SAW and R-SAW sensors. Details of the various fabrication steps involved i.e. mask preparation, lithography etc. has been provided in the Appendix.
Chapter 6 introduces the reader to the various instrumentation
techniques employed to characterise the wave characteristics of the fabricated SAW microsensors. This chapter also describes in details the design and fabrication principle of the different microfluidic components
11 In Chapter 7, the SH-SAW microsensors were immobilized with Sf9 insect cells and their cell adherence was acoustically monitored. This chapter also demonstrates the concept of ligand-receptor interaction measuring acoustically the interactions between the endogenously
expressed receptors on the Sf9 cell surface to a specific neurotransmitter - octopamine hydrochloride, at different concentrations. The chapter also extends the theoretical model developed in chapter 4 to explain the
different results obtained.
12
CHAPTER 2
Literature Review
2.1
Introduction
Insects are highly flexible, sensitive and free-moving organisms [15]. This understanding originated from the works of three ethologists –
Karl von Frisch, Konrad Lorenz and Nikolaas Tinbergen, who were awarded the Nobel Prize in Physiology or Medicine in 1973 “for their discoveries concerning "organization and elicitation of individual and
social behaviour patterns"” [16]. Of the three, Karl von Frisch was highlighted for his research on the ““language” of bees” which explained the mechanism adopted by bees to communicate information to each other or to the colony with the most famous being the round dance
13 The first known study employing invertebrate organisms such as insects, arthropods and arachnids as detectors were conducted by the United States Army in the year 1963 which lead to the development of detectors which could reliably detect intrusion [15]. One of the main
reasons for employing insects as detection elements was the high degree of specificity on offer. In addition to this, it was found that insects would usually orient themselves towards the source of the plume or chemical
and would also ,in some cases, interrogate specific locations [18]. This fact coupled with the low setup and running cost (e.g. cost of training an insect to recognise an odour molecule - moths and wasps could be trained to detect complex odours in the environment in minutes) was found to be
attractive [15] [18].
The olfactory system of insects processes two major types of stimuli i.e. general odorants that signal food, predator and pheromones that are species specific and responsible to transport social and sexual
information [19]. Although, there are two classes of stimuli’s, from here on the term “infochemical” will be used to represent both as both classes do carry encoded information. Additionally it should be specified that as
14 This chapter begins by providing an overview to olfaction science and how insects detect odour molecules from a plume. That chapter goes on to examine how this knowledge inspired the development of olfactory biosensors in particular whole-cell and tissue-level biosensing
techniques. Thereafter, the different classes of olfactory biosensing devices have been introduced along with their detection mechanisms.
2.1
Mechanism of Odour Transduction
Titus Lecretius Carus, the Roman philosopher and poet first described, in 50BC in his only known work “On the Nature of Things : De Rerum Natura.” , a concept that there exists a plethora of odours in
the environment [19][20]. This abstract knowledge was formally recognised and titled “Receptor Theory” by Amoore in the twentieth century [21]. It postulates that perception to a specific odour occurs only when the structure of the odour molecule and the binding sites match
[21]. This theory was confirmed by Buck and Axel upon the discovery of the multigene family encoding receptor proteins [6] [19].
Although mammals detect odour through the odorant receptors
15
100µm A
B
system (CNS) of the insect finally projecting a perception of the encoded information onto the brain. This perception triggers the relevant behavioural pattern such as location of food, mates, avoiding predators etc. [3]. The antennas are populated with fine hair-like sensilla that are
[image:32.612.244.438.318.553.2]embedded with specialized olfactory receptor neurons (ORN) with each ORN tuned to identify only a specific an odour molecule, Figure 2.1 [22] [15] [23].
Figure 2.1: Scanning Electron Microscopy(SEM) image of Drosophila head showing the olfactory sensilla (A) and the maxillary pulp (B) [24] [25] [26].
But, Vassar et al. (1994) and Sullivan et al. (1995) found that in mammals, all the ORN’s (expressing the same gene) converged to the
16 activation of an ORN due to a specific odour referred to an activation of single glomeruli with the actual olfactory receptor (OR), which performed the sensing of the odour molecules, being present in the cell membrane – a viscoelastic matrix consisting of GPCR and other
transmembrane proteins, in a particular orientation, Figure 2.2.
Figure 2.2: The fluid mosaic model of cell membrane along with a simplified view of the odour detection using membrane proteins (A), Insect olfaction through the seven transmembrane receptors (7TM) showing different levels
from antennae to membrane [24] [25] [29].
The mechanism of the downstream reaction was characterised by
Hu et al. in 1994 who found that upon detection of an odour molecule or a pheromone OR were activated which caused the intracellular cyclic adenosine monophosphate (cAMP) a derivative of adenosine monophosphate, levels in the cell to increase [30]. This elevated cAMP
level was responsible in activating different ion-channels causing an increase to the Ca2+ ions concentration of the cell [30]. Such activity
in-“X” sub-unit Effector
?,? dimmer sub-unit
? sub-unit GDP
GTP
Inside the “cell” Extracellular Molecules
(e.g. Pheromones)
Hydro- philic Surface
17 turn caused the membrane potential of the olfactory sensory neuron (OSN) to be altered generating an electrical impulse which was subsequently processed by the olfactory bulb ultimately leading to the decoding of the significance of the odour plume. It was this ability to
detect the volatile ligand/odour via the olfactory receptors at a biologically relevant concentration that played a crucial role in the expansion and development of olfactory biosensors and in the
development of odour sensing equipment’s [31] [32].
Thus, in order to study such a complex process of signal generation (odour detection and its transformation into an electrical signal), in a laboratory based setting, various olfactory biosensor have
been traditionally employed. According to the modern definition, a biosensor is an analytical device that comprises of a biological or a biologically derived sensing layer integrated with a secondary transducer element. There are many different types of biological coatings
available to the user, but, of them, whole-cell or tissue level measurements have extensively been employed in olfactory research [25]. The reason being that, although they are highly complex biological
recognition elements, whole cells are a great source of intact sub-cellular machinery and provide a ready base for the identification of physiologically relevant events occurring when odour/infochemical
18 efficient and stable during the production process and can be controlled from batch-to-batch i.e. cell colony age, cycle, etc. [33]. The following section provides a brief overview of the different olfactory biosensing techniques examining its principles and applications.
2.2
Olfactory Biosensing
Research in the areas of olfaction initially started about 100 years ago but a better understanding of the olfaction system and mechanism
was only acquired in 1991 when Buck and Alex discovered the multi-gene family in rat, as mentioned earlier [6]. Since their discovery numerous assay techniques have been developed primarily to better
understand the mechanism of olfaction or ligand-binding i.e. attachment of an oriented odour molecule (ligand) to a GPCR triggering the specific OR [34]. The research community soon realised that the detection of odorant/ligands by surface receptors at nano-molar (biologically
relevant) concentration could also have applications in different areas of science e.g. assessment of food, wine, air quality, cosmetics and fermentation products, which lead to the creation and expansion of the
19 traditionally employed tissue or whole animal biosensing methods e.g. the use of canaries in mines and dogs to sniff-out narcotics, were in use for decades, this perception was soon altered when the ability to harvest biological whole cells transfected with OR’s was acquired [35] [36]. This
discovery revolutionised the area of olfactory biosensors as smaller devices with the ability to sense concentrations similar to naturally occurring biological processes (<10-2 ppb ranges) could then be realised
[25][37].
Historically, detection of odour concentrations from drugs, explosives, and different pathologies was carried out by electronic noses (e-nose) in order to remove any physical interference’s (human or
animal). These techniques offered sensitivity, reliability but lacked selectivity, one of the key requirements in olfactory biosensing. Selectivity of in most electronic nose application could be achieved by off-chip processing of data using neural network and other advances data
mining techniques. With the new discovery of harvesting cell’s with specific OR’s, on chip-selectivity and sensitivity could soon now be realised as odorant molecules were specifically associated with an
olfactory receptor and even subtle differences in the structure of the odorant molecule could modify the odour quality or the information being transmitted (in terms of odour sensing in insects). Therefore in
20 e-nose could now be replaced with a bio-e-nose consisting of naturally occurring OR transfected in a cell thus immobilised onto the sensing surface with sensitivities from low ppb range to range’s lower than 10-6
ppb (in case of animals) [32] - [38] achieved.
Over the past decades various transducer technologies have been employed for the recognition of odorants and more generally have been broadly classified in three distinct categories i.e. electrochemical, optical
and resonant Table 1. Of these the most employed methods include surface plasmon resonant, quartz crystal microbalance, direct electrochemical measurement and FET (field effect transistors). These methods have been proven to have the ability to detect odorant binding
events in a stable manner, which is a prerequisite for high throughput screening and are thus preferred techniques employed in the field of direct olfactory sensing.
The following section review’s the different transducer classes,
examining their basic principles and reviewing their applications.
2.2.1 Electrochemical Transducers
Electrochemical techniques are one of the three commonly employed techniques in the field of olfaction. They offer the capability of
21 (amperometric) or the conductive (conductometric) properties of the biological film [25].
Transducer Class Technique Measurand
Optical Surface plasmon
resonance(SPR), Florescence(including
FRET luminescence) Bioluminescence
Light
Acoustic Piezoelectric Resonators
Bulk Acoustic Wave (BAW) Surface Acoustic Wave
(SAW) Cantilever base
microsensors
Mass
Electrochemical Impedance/Conductometric
Amperometric Potentiometric (voltage
clamps, patch clamps, microelectrode array, FET
based arrays)
Electrical/Chemical
Table 1: Different transducer classes, measurement techniques along with the respective measurand [25].
An electrochemical biosensor consists of a reference electrode, an auxiliary electrode and a sensing electrode. The sensing electrode serves as the transduction element while the auxiliary electrode provides
current to the sensing electrode by establishing a connection to the electrolytic solution [39]. The commercially most employed techniques in this area is the FET based electrochemical sensors [25].
22 Source
Gate
Drain
I
V
∆
φ
which measures changes in the electrical resistance at the transducer surface, electroolfactogram (EOG), electroantennagram (EAG), voltage and patch clamping. Other techniques include the use of field effect transistors (FET) and light assessable potentiometric sensor (LAPS)
[40].
Electrochemical field effect transistors (FET), are the most employed commonly employed microsensors and consist a metal oxide
transistor which has a source, gate and a drain [41]. That gate metal is functionalized with a protein, peptide, nucleic acid which upon adsorption of the ligand or the target molecule causing the gate potential to be altered [41] [42], as shown in Figure 2.3.
23 Although, being sensitive to charge accumulation at the gate electrode, one of the many drawbacks of these types of microsensors is that due to miniaturization of transistor sizes, the oxide thickness decrease causing the gate leakage to drastically increase by orders of
magnitude. Another cause of concern is the fact that such family of microsensors are fabricated using standard integrated circuit (IC) complementary metal oxide semiconductor (CMOS) technology [44]. For
CMOS, aluminium (Al) is the metal of choice for the top-layer of the biosensor. Al on the other hand is not the preferred material in biosensing applications as it corrodes easily thus post-processing of the gate electrode is required [44]. Another hindrance to the commercial
success of such electrochemical based biosensors is the need of an off-chip reference electrode [41] [45].
Other types of electrochemical techniques also include, potentiometric and impedimetric methods which include electrochemical
impedance spectroscopy (EIS) [41]. In the former technique, a three electrode system is employed i.e. a reference, a counter and a working electrode. Electrical impedance is then measured between an electrodes
with respect to the solution at a spectrum of frequencies [41]. This particular technology has also acquired recent interests in the development of nanotube based sensors based in the nano-meter scale
24 Yoon et al. have demonstrated a setup in which the human olfactory receptor protein (hOR2AG1) were integrated with a conducting polymer nano- tubes into a FET platform while come authors have reported measuring sensitivities as low as 10’s of femto-molar [47] [48].
Different types of electrochemical sensor have been successfully fabricated with different microorganisms acting as the biosensitive coating e.g. E.coli, yeast to name a few [49][50][51]. A whole-cell
potentiometric biosensor for screening of toxins was proposed by May et al. attaching endothelial cells to a K+ selective membrane, on which ion
transport is almost completely inhibited by a confluent cell monolayer with sensors demonstrating that permeability of the cell monolayer
increasing the ionic transfer producing a potential response [52].
Although the electrochemical transducers offer portability, cost-effectiveness and simplicity of operation, they have their own limitations – as outlined above, which include effects of interferents which are
electrochemically active. Other limitations include long-term stability and reliability of the electrodes transducer electrodes [53].
2.2.2 Optical Transducers
In optical biosensors a significant change in the transducer
25
Prism or a highly refractive surface
Light Source Optical Detector
Odorant Flowing
Au surface Immobilised with biosensitive coating
ligand-receptor interaction as shown in Figure 2.5. Some of the techniques employed in standard optical assays include the measurement of florescence, bio- and chemo- luminescence, adsorbance. Förster Resonant Energy Transfer (FRET) is one of the florescence
method which utilises changes (conformation or due to interaction) in the florescent dyed molecule to produce a florescence (increased or decrease) [54] [55].
Another recent popular label-free optical technique employed is the surface plasmon resonance (SPR) which relies on changes in the refractive index of the light incident on the sensor surface[56].
Figure 2.5: Optical technique employed in olfactory biosensing
Surface plasmons can be described as oscillations of the free electron density in a metal. These plasmons are excited when polarized
26 metal, usually gold, at the angle of total reflection. One way to readout the sensor signal is to measure the intensity of the reflected light for different angles. At the angle where the plasmon’s are excited, energy is adsorbed and the intensity of the reflected light has a minimum. This
angle depends on the amount of mass adsorbed at the surface, as shown in Figure 2.6 [41].
This technique has also been employed to characterize bio-
molecular interactions in real time without any labelling and more specifically it has been reported in literature that this technique is extensively employed to characterise and study GPCR’s [57][58][59]. This technique has also been employed to measure odorant detection by
whole cells expressing odorant receptors (HEK-293 cells expressing OR I7) [60][61]. Although, optical transduction techniques are attractive in the field of olfaction due to their ability to reach low detection limits of ligand, the main drawback being their setup cost. Such techniques
27 Figure 2.6: Surface plasmon resonance technique which employing light excited
plasmons to sense the changes in the immobilized biological layer (a), commercially available SPR detection system - Biacore SPR T200 and GWC
SPRImagerII (b) [62].
Additionally, surface chemistry is largely limited to noble metals and calibrations needs to be performed for different buffer solutions (as refractive index is in questions). Such requirements tend to compromise
the cost-effectiveness and the portability of a biosensor setup.
(a)
28 2.2.3 Acoustic or Resonant Transducers
Acoustic transducers have been actively employed in the field of telecommunications for over 60 years [63] [64]. This family of transducers are based on the principle of piezoelectricity a property exhibited by a centrosymmetric crystal substrates [65]. According to the
principle an electric polarisation is induced in the crystal structure when a strain is induced. The converse principle i.e. development of strain by applying an alternating field is a concept employed extensively in
actuation [65].
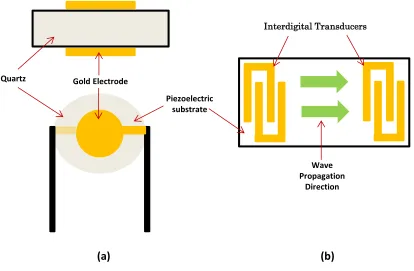
Piezoelectricity is exhibited by a number of naturally occurring crystal e.g. quartz, although other materials which are employed for sensing applications include lithium niobate, lithium tantalate. Acoustic wave microsensors exploit this principle for the generation of an acoustic
wave on the surface or in the bulk of the piezoelectric substrate. Both the types of waves, i.e. surface and bulk waves can be generated in a
29 Figure 2.7: Acoustic wave microsensors (a) a Bulk Acoustic Wave (BAW)
microsensor and (b) a Surface Acoustic Wave (SAW) Microsensor.
The magnitude and direction of the generated acoustic wave is a
function of the piezoelectric substrate and its associated cut and depending on the sensing application a suitable substrate cut is chosen which then determines the type of acoustic wave generated by the patterned electrodes [66] [67] [68].
2.2.3.1
The Piezoelectric Effect
The term “piezoelectricity” was first introduced by Henkel almost a year after the concept was first demonstrated by the Curie brothers in
Quartz Gold Electrode
(a) (b)
Interdigital Transducers
Wave Propagation
Direction Piezoelectric
30 1880 [69] [70]. The curie brothers, while performing experiments on different crystals, observed that when a tensile or a compressive stress was applied to the opposite faces of a piezoelectric substrate a separation of gravity of positive and negative charges and vice-versa was produced
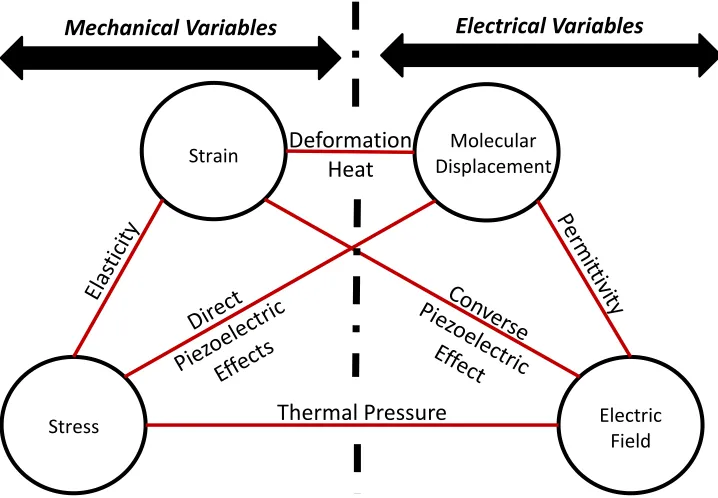
[71][72]. As piezoelectric crystals lack a centre of inversion symmetry, application of strain changes the distribution of charge on atomic bonds resulting in a net electrical polarization, Figure 2.7 [73]. Thus, a
relationship amongst the individual substrate variable i.e. mechanical, electrical and thermal, of a piezoelectric crystal structure could be mapped, as shown in Figure 2.8 [74].
In 1885, the existence of elastic vibration on the surface of a solid
material was first confirmed by Lord Rayleigh confirming the fact that such crystals, demonstrating the property of piezoelectricity, were important in sensing systems. More importantly, two important properties of piezoelectric crystals justify their application in sensor
systems [75] [76].
The presence of a distortion free interface, with low energy dissipation, due to the ideal coupling mechanism between the electrical and mechanical variables.
31
Deformation (x 6 sides of a crystal)
A B
l, b, h l´, b´, h´
[image:48.612.145.558.87.298.2]52
Figure 2.7: Concept of piezoelectricity – on application of an alternating electric field a crystal with dimensions l, b and h, changes to l´, b´, h´ due to the
generation of stress on its faces.
Figure 2.8: The different mechanical and electrical variable relating the stress and strain in a piezoelectric substrate [74].
Mechanical Variables Electrical Variables
Strain
Stress
Molecular Displacement
Electric Field
Thermal Pressure Deformation
[image:48.612.159.518.382.631.2]32 2.2.3.1.1 Stress and Strain in an Elastic Solid
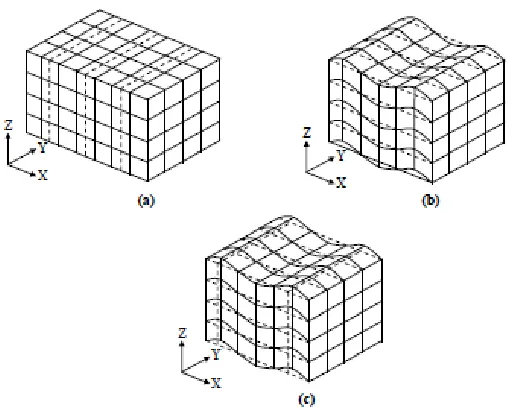
When an external force is applied on an elastic solid, the stresses and strain experienced by the solid exist in compressional and shear form which can be co-related, in one dimension, by Hook’s law of elastic
[image:49.612.241.498.279.484.2]deformation (Eq. 2.1), as shown in Figure 2.9 [77].
Figure 2.9: Different particle displacement profiles due to the stresses on a solid with (a) longitudinal while both (b, c) being shear .
Assuming that the stress and strain are along the same axis the
relation can be expressed by a tensor equation:
33 where c is the elastic stiffness coefficient (Young’s Modulus) and S being the strain (dimensionless) suffered by the solid. The tensor equation can then be reduced to the matrix equation taking into account all the other components, as a tensor relates parameters which are dependent on
more than one set of co-ordinate axis. On re-dimensioning [T] and [S], we get :
[T] = [c] : [S] Eq. 2.2
In Eq. 2.2 the elastic stiffness constant, [c], is a 6 x 6 matrix [c] with 36 independent values relating six (reduced) components of stress to six
(reduced) components of strain (due to their symmetry properties) thus making only six of the nine elements unique. Out of the 36 independent terms, considering the energy and symmetry, only 21 terms are considered for most crystal structures. Further reduction to the above
matrix depends on the choice of appropriate crystal substrate symmetry. When an electric field (E) is applied to a simple dielectric, e.g. a capacitor, the field causes a distortion of the molecular charge (which is
neutral) distribution in the non-conductor resulting in surface charge accumulation which can be related according to Eq. 2.3
34 where and are the relative and permittivity of free space in Eq. 2.3. This relation depicted in Eq. 2.3 does not hold true for piezoelectric
dielectrics. The coupling between electrical and mechanical parameters on application of an electric field gives rise to mechanical deformation and vice-versa thus the earlier equation can be modified in terms of a piezoelectric constant matrix [e] such that the charge density by the
matrix is given by :
D = [e][S] + [e]E Eq. 2.4
where [S] is the strain and E the magnitude of the electric field. In addition to this, for piezoelectric materials the mechanical stress relationship can be extended to:
[T] = [c][S] – [e′]E Eq. 2.5
35
Lithium Tantalate = (
) Eq. 2.6
Quart ( ) Eq. 2.7
Gallium Arsenide = (
) Eq. 2.8
The piezoelectric coefficient k2 the elastic constant c and the dielectric
permittivity e can then be related as:
Eq. 2.9
2.2.3.2
Acoustic Wave Propagation
2.2.3.2.1 The Wave Equation
The wave equation used for the numerical calculation of acoustic wave propagation was proposed by B. A. Auld in 1973 [78][79] can be depicted by Eq. 2.10:
36 in which ρ is the mass density and the particle displacement. The
tensor notation for the above can be written as:
Eq.2.11
Eq.2.12
and the strain-mechanical displacement relation being:
Eq.2.13
In the absence of any intrinsic charge in the material, the wavelength (λ) of the generated elastic wave is much smaller than that of the electromagnetic wave. Thus, neglecting the magnetic effects of the
material, it can be said that a [79] (Eq. 2.14, 2.15)
Eq.2.14
Eq.2.15
37
̈ + Eq.2.16
Eq.2.17
The surface acoustic wave is generated on a traction-free surface separating an infinitely thick solid from the free space thus setting ,
the mechanical stress second rank tensor component, to zero [80].
Assuming a surface wave which propagates parallel to the surface with a phase velocity (Vr) having amplitude which decays with distance
travelled by the wave and assuming the direction of propagation of the
wave taken as X1 or the sagittal plane as shown in Figure 2.10
Figure 2.10: Propagation vector of the acoustic waves [78].
The elastic, piezoelectric and the dielectric constants can be
substituted with the new coordinates referring to the rotated co-ordinate
x
238 system calculated through the transformation matrix. The solution of the surface wave can then be depicted in the form of a linear combination of partial waves which hold the form
( ) [ ( ⁄ ] Eq.2.18
( ) [ ( ⁄ ] as x>0 Eq.2.19
with ω is the angular frequency of the electrical signal , k being the wave
number and λ the wavelength [80].
With the crystal symmetry and the additional boundary, electrical and mechanical, conditions levying a further constraint on the partial wave equation X1 thus assuming that the sagittal plane is considered as
the plane of symmetry of the crystal making X1 the pure-mode axis for
the surface wave and involves only the potential and the sagittal-plane component of the displacement [78] [80]. The Rayleigh wave has no displacement vector component in the X2 direction. Assuming
displacement U1 and U3 to have the form of [65] [67] :
( ) [ ( ] Eq. 2.20
39 and u3 = 0. Where the elastic half-space X3 , B and A are unknown
amplitudes, k is the wave number for propagation along the boundary
and c is the phase velocity of the wave. Physical considerations require b to be a positive real complex part. Substituting the assumed displacement in the Navier-Stokes equation infers
Eq. 2.22
And using the generalised Hook’s law for an isotropic elastic solid yields two homogenous equations in A and B [78]. The above equation is a generalised displacement solution equation. These displacements can be
depicted as the ones shown in Figure 2.11 [78]. It can be observed that u3 is in phase quadrature with u1 thus creating a motional ellipse.
At a depth of 0.2λ the sign of u1 changes with an ellipse described above
40 Figure 2.11: Sagittal plane view demonstrating the strain in a piezoelectric
substrate due to the application of the field. It also depicts the particle displacement demonstrating the formation of a surface Rayleigh Wave.
This can then be described by the following equations:
[ ( ) ( )] [ ( )] Eq. 2.23
( ) ( ) ( ) ( ) [ ( )] Eq. 2.24
( ) ⁄ Eq. 2.25
( ) ⁄ Eq. 2.26
The longitudinal and transverse velocities and are given by:
√ Eq. 2.27
41 where the Lames’ constant G is given by ( ) and the wavelength
λ is given by [( )( )] with ν being the Poisson’s ratio and being the Young’s modulus [78].
Acoustic or elastic waves can be described as a particle displacements in an infinite homogeneous medium caused due to an external disturbance, similar to a mass-spring system. The mass-spring
system is described by a differential equation of time, displacement and mass, while the former involves a particle displacement which is a function of both time and position of the particle and requires the
equation of motion to be more localised e.g. disturbance suffered by a particle at the surface of the medium will be different to the disturbance suffered by a particle deep inside the surface. Although the acoustic waves propagating in a medium is a planar wave, its characteristics are
dependent on the properties of the medium. There are two types of planar waves namely the longitudinal and the shear wave with their respective characteristics depending on the polarisation and the
propagation direction of the vibrating atom in the medium [79]. For longitudinal waves, the atoms of the crystal vibrate parallel to the direction of propagation, e.g. y-direction as shown in Figure 2.10, whereas shear wave is formed when the atoms of a medium vibrates in
42 The propagating medium is considered as an infinite medium as it helps in the theoretically analysing the different solutions of the wave equation. When boundary conditions are applied to propagating medium, only a particular solution of the wave equation can be analysed,
depending on the propagating medium itself, thus changing the nature of the travelling acoustic wave. Thus, different modes of the acoustic wave can be supported within a bounded medium. Of all the planar
waves Surface Acoustic Waves are of the greatest interest as these waves travel along the surface of the medium with their amplitude decreasing exponentially away from the surface into the medium, thus they start travelling into the bulk of the substrate .
Due to the nature of the generation and detection of the surface wave, this particular type of microsensors offer sensitivity to different experimental parameter viz. mass, viscosity, density, conductivity and temperature, in real time with an option to extract the dynamic
information regarding the kinetic of the bio-recognition layer. It is this property that helps in the realisation of cheap and a reliable alternative to other real-time optical techniques as they offer the same benefit as
sensitive optical techniques e.g. SPR. [81] As mentioned earlier in this chapter, the detection of volatile organic compounds can occur by employing a chemical or a biologically derived coating. More specifically
43 versatility to the user in terms of the operational or the experimental phase. This is because the user can choose the type of an acoustic microsensor based on the application or more simply put the operational phase. There are two main classes of acoustic wave devices which are
employed for olfactory sensing or as odour sensors. They are the Bulk Acoustic Wave (BAW) and Surface Acoustic Wave (SAW) microsensors [82].
2.2.3.3 Bulk Acoustic Wave (BAW) devices
One of the most extensively employed microsensors of this family is the Quartz Crystal Microbalance (QCM) which consists of a thin disk of AT-cut quartz patterned with circular electrodes, made of gold, on both sides. Application of a potential difference between the electrodes
cause the generation of an acoustic wave which travels within the bulk of the crystal, as shown in Figure 2.12.
Figure 2.12: A Quartz Crystal Microbalance along with the wave generated shear wave.
Gold
Quartz Gold Coating
15 mm
AC
44 Credit for employing QCM based microsensors first as chemical sensors goes to Sauerbray and King [83]. They employed an AT-cut QCM microsensor and observed that the shift in the resonant (design)
frequency of the crystal could be co-related to additional or a removal of mass from the device surface. Thus, a mathematical relation describing this relation came to be known by the Sauerbray’s equation, represented
by Eq. 2.29 [83].
√
where resonant frequency, A being the area of the quartz crystal resonator, are the density and the shear stiffness of the quartz,
crystal. Perturbation ( ) to the resonant frequency are measured as a change in the mass/unit area on the surface of the Quartz substrate.
The QCM microsensors have been extensively employed in the
area of odour detection and are amongst the three most referred techniques, apart from SPR and FET. More importantly literature indicates that parts per billion (ppb) level odours have been detected by coating the microsensor surface with a variety of functional compounds
45 [84] [85]. Polymer based QCM sensor arrays have also been employed in the area of olfaction and have demonstrated sensitivity but the concept of on-site selectivity available due to a biological coating outstrips any advantages which polymer based devices offer. More recently polymer
coated QCM microsensors have had more success in the detection of odorants from food, beverages and oils sparking extensive interest in building an olfactory systems which mimics a mammalian counterpart
[86].
QCM microsensor arrays have found applications in the area of olfaction because of their ability to sense mass changes on their surface – as governed by the Sauerbray’s equation. Literature indicated that the
microsensor surface has also been modified by applying different biologically derived coatings which include crude membrane extracts containing olfactory receptors (ORD10), HEK-293 whole cells transfected with ORI7. Such setups have usually been exposed to different odorants
such as octanal vapours and concentration dependant experiments have also been successfully demonstrated [38]. Wu et al. in 1999 further demonstrated this concept successfully by immobilizing crude bull frog
cilia preparations onto a piezoelectric substrate through which trace levels of odorants were detected. Additionally, the microsensor surface was immobilized partial with fractions olfactory receptors from cilia
![Figure 1.2 : The different subsystems comprising the chemoreceiver [14].](https://thumb-us.123doks.com/thumbv2/123dok_us/9651982.467212/23.612.156.537.342.581/figure-different-subsystems-comprising-chemoreceiver.webp)
![Figure 2.1: Scanning Electron Microscopy(SEM) image of Drosophila head showing the olfactory sensilla (A) and the maxillary pulp (B) [24] [25] [26]](https://thumb-us.123doks.com/thumbv2/123dok_us/9651982.467212/32.612.244.438.318.553/figure-scanning-electron-microscopy-drosophila-olfactory-sensilla-maxillary.webp)
![Figure 2.6: Surface plasmon resonance technique which employing light excited plasmons to sense the changes in the immobilized biological layer (a), commercially available SPR detection system - Biacore SPR T200 and GWC SPRImagerII (b) [62]](https://thumb-us.123doks.com/thumbv2/123dok_us/9651982.467212/44.612.191.529.95.413/resonance-technique-employing-immobilized-biological-commercially-detection-sprimagerii.webp)
![Figure 3.6: The different volatile components of Apple, Hawthorn Dogwood [115].](https://thumb-us.123doks.com/thumbv2/123dok_us/9651982.467212/81.612.169.459.196.532/figure-different-volatile-components-apple-hawthorn-dogwood.webp)
![Figure 3.8: Linear Discriminant Analysis (LDA) of the four fruit blends, 3 –Methylbutan-1-ol (3M), ethyl acetate (EA), hexyl butanoate (HB) and butyl hexanoate (BH) [10]](https://thumb-us.123doks.com/thumbv2/123dok_us/9651982.467212/83.612.168.541.142.409/figure-linear-discriminant-analysis-methylbutan-acetate-butanoate-hexanoate.webp)