Genetically encoded calcium indicators for multi-color
neural activity imaging and combination with optogenetics
Jasper Akerboom1
,Nicole Carreras Calderón1,2,3
,Lin Tian1†
, Sebastian Wabnig4
,Matthias Prigge5 ,
Johan Tolö6, Andrew Gordus7, Michael B. Orger8,9, Kristen E. Severi8, John J. Macklin1,Ronak Patel1,
Stefan R. Pulver1,Trevor J. Wardill1†, Elisabeth Fischer4, Christina Schüler4, Tsai-Wen Chen1,
Karen S. Sarkisyan1, Jonathan S. Marvin1,Cornelia I. Bargmann7, Douglas S. Kim1,
Sebastian Kügler6,Leon Lagnado2,Peter Hegemann5,Alexander Gottschalk4, Eric R. Schreiter1,3and
Loren L. Looger1*
1Janelia Farm Research Campus, Howard Hughes Medical Institute, Ashburn, VA, USA
2Medical Research Council Laboratory of Molecular Biology, Cambridge, UK
3
Department of Chemistry, University of Puerto Rico - Río Piedras, San Juan, PR, USA
4
Institute of Biochemistry and Buchmann Institute for Molecular Life Sciences, Johann Wolfgang Goethe-University Frankfurt, Frankfurt, Germany
5
Experimentelle Biophysik, Humboldt Universität zu Berlin, Berlin, Germany
6
Department of Neurology, University Medicine Göttingen, Göttingen, Germany
7Laboratory of Neural Circuits and Behavior, Howard Hughes Medical Institute, The Rockefeller University, New York, NY, USA
8Department of Molecular and Cellular Biology, Center for Brain Science, Harvard University, Cambridge, MA, USA
9
Champalimaud Neuroscience Programme, Champalimaud Centre for the Unknown, Lisboa, Portugal
Edited by:
Piotr Bregestovski, Institut national de la santé et de la recherche médicale, Université de la Méditerranée, France
Reviewed by:
Robert E. Campbell, University of Alberta, Canada
Thomas Grutter, University of Strasbourg - CNRS, France
*Correspondence:
Loren L. Looger, Howard Hughes Medical Institute, Janelia Farm Research Campus, Ashburn, 19700 Helix Dr., VA 20147, USA.
e-mail:[email protected]
†Present address:
Lin Tian, Department of Biochemistry and Molecular Medicine, University of California Davis School of Medicine, Sacramento, CA, USA.
Trevor J. Wardill, Marine Biology Laboratory, Program in Sensory Physiology and Behavior, Woods Hole, MA, USA.
Genetically encoded calcium indicators (GECIs) are powerful tools for systems neuroscience. Here we describe red, single-wavelength GECIs, “RCaMPs,” engineered from circular permutation of the thermostable red fluorescent protein mRuby. High-resolution crystal structures of mRuby, the red sensor RCaMP, and the recently published red GECI R-GECO1 give insight into the chromophore environments of the Ca2+-bound state of the sensors and the engineered protein domain interfaces of the different indicators. We characterized the biophysical properties and performance of RCaMP sensors in vitro and in vivo in Caenorhabditis elegans, Drosophila larvae, and larval zebrafish. Further, we demonstrate 2-color calcium imaging both within the same cell (registering mitochondrial and somatic [Ca2+]) and between two populations of cells: neurons and astrocytes. Finally, we perform integrated optogenetics experiments, wherein neural activation via channelrhodopsin-2 (ChR2) or a red-shifted variant, and activity imaging via RCaMP or GCaMP, are conducted simultaneously, with the ChR2/RCaMP pair providing independently addressable spectral channels. Using this paradigm, we measure calcium responses of naturalistic and ChR2-evoked muscle contractions in vivo in crawling C. elegans. We systematically compare the RCaMP sensors to R-GECO1, in terms of action potential-evoked fluorescence increases in neurons, photobleaching, and photoswitching. R-GECO1 displays higher Ca2+ affinity and larger dynamic range than RCaMP, but exhibits significant photoactivation with blue and green light, suggesting that integrated channelrhodopsin-based optogenetics using R-GECO1 may be subject to artifact. Finally, we create and test blue, cyan, and yellow variants engineered from GCaMP by rational design. This engineered set of chromatic variants facilitates new experiments in functional imaging and optogenetics.
Keywords: calcium imaging, genetically encoded calcium indicator, multi-color imaging, protein engineering, optogenetics
INTRODUCTION
Together, recent advances in modern microscopy and improved genetically encoded calcium indicators (GECIs) have revolu-tionized systems neuroscience by allowing chronic simultaneous optical recording from genetically targeted neuronal populations
Abbreviations:AP, action potential; FP, fluorescent protein; GFP, green fluores-cent protein; GECI, genetically encoded calcium indicator; FRET, Förster resonance energy transfer; ACh, acetylcholine; ChR2, channelrhodopsin-2; C1V1, ChR1-VChR1 chimera; PAGE, polyacrylamide gel electrophoresis; RMSD, root mean square deviation; SNR, signal-to-noise ratio.
in vivo. Calcium is a ubiquitous second messenger, playing an essential role in all aspects of physiology, specifically in neurons
and other excitable cells (Burgoyne, 2007). Calcium ions (Ca2+)
are transported into neurons both by action potential (AP)
fir-ing and synaptic input (Jaffe et al., 1992; Denk et al., 1996).
Spike number, timing, frequency, as well as levels of synaptic input, can all be quantified by measuring changes in intracellular
free [Ca2+] (Yasuda et al., 2004). GECIs are prominent tools to
monitor [Ca2+] in defined cells and intra-cellular compartments
Hou et al., 2009; Rothermel et al., 2009; Shigetomi et al., 2010). The most optimized GECIs are single-wavelength green
indica-tors based on the original GCaMP sensor (Nakai et al., 2001).
Improvements have been facilitated both by crystal structure
determination in the Ca2+-free and Ca2+-bound states (Wang
et al., 2008; Akerboom et al., 2009), and high-throughput
screen-ing in bacterial colonies (Ibraheem et al., 2011; Zhao et al., 2011a;
Akerboom et al., 2012b) and lysates (Tian et al., 2009). A number
of engineered variants of GCaMP have been published (Ohkura
et al., 2005; Tallini et al., 2006; Tian et al., 2009; Muto et al., 2011);
of these the GCaMP5 indicators (Akerboom et al., 2012a) show
the best performance in detecting APs in neurons. GCaMP sen-sors have been deployed in a number of model organisms, and
facilitate experiments such as imaging Ca2+ transients during
development in transgenic mice (Zariwala et al., 2012),in vivo
imaging of layer 5 cortex (Mittmann et al., 2011), chronic
mea-surements of circuit dynamics accompanying motor task learning (Huber et al., 2012), and monitoring whisker sensory-motor
integration in cortical synaptic terminals (Petreanu et al., 2012).
Sufficient structure/function relationships are known for
GCaMP (Wang et al., 2008; Akerboom et al., 2009) and its
con-stituent molecules, calmodulin (CaM) (Chou et al., 2001; Faas
et al., 2011; Stigler and Rief, 2012) and green fluorescent
pro-tein (GFP) (Ormo et al., 1996; Tsien, 1998), to allow specific,
semi-rational manipulation of critical sensor parameters
includ-ing: Ca2+ affinity, on- and off-kinetics, protein stability,
expres-sion/degradation profiles, and baseline and activated fluorescence
levels (Akerboom et al., 2009, 2012b; Tian et al., 2009). One
char-acteristic that until recently has largely been unexplored (Zhao
et al., 2011a) is sensor color.
Modulation of the color of GFP and related proteins is well established. Direct mutation of the side-chains comprising the GFP chromophore can tune excitation/emission; specifically, the mutations Phe64Leu, Thr65Ser, and Tyr66His produce a blue
fluorescent protein (BFP) (Heim et al., 1994), and Tyr66Trp
produces a cyan variant (CFP) (Heim and Tsien, 1996). The
Thr203Tyr mutation produces a pi-stacking interaction with the GFP chromophore that red-shifts fluorescence, creating a
yel-low fluorescent protein (YFP) (Ormo et al., 1996). A number of
improved variants of the original BFP, CFP, and YFP have been published, often by mutating positions near the chromophore to improve folding, maturation, brightness, and photostability (Griesbeck et al., 2001; Nagai et al., 2002; Rizzo et al., 2004; Nguyen and Daugherty, 2005; Ai et al., 2006, 2007; Kremers et al., 2006, 2007; Mena et al., 2006; Goedhart et al., 2010). A red
vari-ant of GFP has also been published (Mishin et al., 2008), but it is
quite dim.
Mutations producing chromatic variants of FPs can easily be grafted onto sensors derived from them. In spite of this, until
recently (Zhao et al., 2011a) the only available color of
single-wavelength GECI was green [camgaroo (Yu et al., 2003), pericam
(Nagai et al., 2001), and the Case sensors (Leder et al., 2010) were engineered from EYFP but have GFP-like green fluorescence]. For
analytes other than Ca2+, sensors with several different colors
have been constructed: Hyper, a yellow peroxide sensor (Belousov
et al., 2006); blue, cyan, green, and yellow sensors for
mal-tose (Marvin et al., 2011); a yellow sensor of molecular strain
(Ichimura et al., 2012); Frex, a yellow sensor of NADH (Zhao
et al., 2011b); PermELI, a yellow estrogen sensor (Picazo et al.,
2011); and a yellow indicator of ATP:ADP ratio (Berg et al., 2009).
Extending the color palette greatly increases the potential of GECIs: multi-color imaging of different cell types and organelles could reveal inter- and intra-cell signaling events; red-shifted indicators would reduce tissue scattering, phototoxicity, and background fluorescence, facilitating deep imaging; non-green sensors could be used in animals already expressing a green FP; and perhaps most importantly, color-shifted indicators could seamlessly integrate into optogenetics experiments. Optogenetic
manipulation of cells via light-modulated ion proteins, such
as the microbial opsins (Yizhar et al., 2011a) or
photoacti-vated cyclases (Stierl et al., 2011), combined with functional
imaging of genetically encoded sensors, could elucidate the input/output interactions both within single cells and between neurons. However, the GCaMP excitation spectrum overlaps the action spectra of commonly used activators and silencers, such
as channelrhodopsin-2 (ChR2) (Nagel et al., 2003, 2005; Boyden
et al., 2005), archaerhodopsin-3 (Arch) (Chow et al., 2010),
and halorhodopsin (HR) (Zhang et al., 2007). Currently,
imag-ing GCaMP fluorescence without overly activatimag-ing ChR2 is only possible with dim excitation light, resulting in weak fluorescent
signals and low signal-to-noise ratio (SNR) (Guo et al., 2009).
Using a red-shifted GECI in concert with the blue-activated ChR2 could allow activating and imaging lasers to be used at full intensity.
We first sought to create a family of chromatic variants of GCaMP by structure-guided design and random screening, and
compare those to the color variants recently published (Zhao
et al., 2011a). Initially, we made mutations in and around the chromophore in GCaMP3, by grafting mutations of GFP that
produce blue (Heim et al., 1994), cyan (Heim and Tsien, 1996),
yellow (Ormo et al., 1996), and red (Mishin et al., 2008)
flu-orescent proteins. Of these, the blue, cyan, and yellow vari-ants (“BCaMP,” “CyCaMP,” and “YCaMP,” respectively) displayed spectral shifts comparable to the GFP variants and were opti-mized by subsequent mutagenesis. However, the red variant of GCaMP3 did not display any fluorescence and this variant was not pursued further. To create a red GECI, we selected the red fluorescent protein (FP) mRuby (an engineered vari-ant of eqFP611 exhibiting high thermodynamic stability and
monomericity) (Kredel et al., 2009) and replaced cpEGFP with
circularly permuted mRuby in the GCaMP3 scaffold. Subsequent systematic engineering produced a red GECI (“RCaMP”). High-resolution crystal structures of mRuby in several states, as well
as a structure of a Ca2+-loaded RCaMP variant, aided
opti-mization of the red GECI scaffold to useful performance levels.
Furthermore, the high-resolution structure of Ca2+-loaded
R-GECO1 explains mutagenesis data and presents the opportunity for structure-guided optimization of this sensor as well.
We thoroughly characterize the new RCaMPs, both under single- and two-photon illumination, and present a number of novel applications. We demonstrate 2-color red/green calcium imaging both intra-cellularly (mitochondria and cytoplasm) and
inter-cellularly (neurons and astrocytes). We showin vivoRCaMP
imaging in worms, fly larvae, and zebrafish. We demonstrate inte-grated optogenetics experiments with RCaMP and ChR2, both
comparison with GCaMP and the red-shifted opsin C1V1 (Yizhar et al., 2011b), and to recently published (but potentially
arti-factual) use of ChR2 with R-GECO1 and its mutants (Chang
et al., 2012; Ohkura et al., 2012). Finally, we present a thor-ough spectral characterization of RCaMP and R-GECO1 focused on multicolor/optogenetics implementation. We compare
two-photon bleaching of RCaMP and mRuby to the red Ca2+sensor
R-GECO1 (Zhao et al., 2011a).
We find that R-GECO1 shows dramatic reversible photoactiva-tion and fast multi-state photobleaching that complicate imple-mentation of the sensor, whereas RCaMP sensors are spectrally pure, brighter than R-GECO1 under 2-photon excitation and show no photoswitching. The new RCaMP sensors are the only currently available reagents for artifact-free, simultaneous opto-genetics and functional imaging, and as such enable a host of qualitatively new experiments.
RESULTS
STRUCTURE-GUIDED ENGINEERING OF COLOR-SHIFTED GECIs
We initially mutated GCaMP3 (Tian et al., 2009) to incorporate
sets of the core mutations of EBFP, ECFP, and EYFP: in GCaMP3
numbering Phe221Leu/Thr222Ser/Tyr223His (“BCaMP1a”);
Tyr223Trp (“CyCaMP1a”); and Val116Tyr/Lys119Val (GCaMP3 incorporates the Thr116Val mutation; “YCaMP1a”). CyCaMP1a
and YCaMP1a were fluorescent and responded to in vitro
calcium changes [(F/F)max=2.6±0.1, s.d., n=3; and
(F/F)max=3.0±0.1, s.d., n=3, respectively] (Table 1),
whereas BCaMP1a was fluorescent but not a sensor. The Cerulean (Rizzo et al., 2004) mutation Ser229Ala (GFP numbering Ser72Ala; Cerulean also has mutations at GFP positions 145 and 148, but these positions are absent in GCaMP) resulted in higher
apo brightness and lower (F/F)max(1.9±0.3, s.d., n=3) in
CyCaMP1b (Table 1,Figure 1B). YCaMP1a was improved by the
incorporation of the Citrine (Griesbeck et al., 2001) mutations
Thr65/222Gly, Val68/225Leu, Gln69/226Met, and Ser72/229Ala,
resulting in YCaMP1b [(F/F)max=9.2±0.4, s.d., n=3]
(Table 1, Figure 1C). We incorporated the EBFP2 (Sato et al.,
2007) and Azurite (Mena et al., 2006) mutations into BCaMP1a,
but these did not result in improved variants. Screening variants of the M13pep-cpFP linker (“linker1”) produced a variant BCaMP1b, with amino acids Leu-Glu replaced by Met-Pro, with
(F/F)maxof 0.9±0.2 (s.d.,n=3;Table 1). A cpFP-CaM linker
(“linker2”) variant BCaMP1c with Phe-Pro instead of Thr-Arg,
had a (F/F)max of 2.0±0.1 (s.d.,n=3; Table 1, Figure 1A).
The combination of the two linker variants resulted in a poor sensor (data not shown).
INITIAL ENGINEERING OF THE RCaMP SCAFFOLD
A red-colored (albeit quite dim) variant of Aequorea victoria
GFP has been published (Mishin et al., 2008); we made the
corresponding mutations to GCaMP3, but the resulting protein displayed no fluorescence (data not shown). Subsequently, we
circularly permuted the red FP mCherry (Shaner et al., 2004)
and replaced cpGFP in GCaMP3 with cp-mCherry; this pro-tein was not fluorescent either (data not shown), in agreement with the absence of chromophore formation in cp-mCherry
described previously (Carlson et al., 2010). We therefore selected
another protein, mRuby (Kredel et al., 2009), as a template for
a red calcium indicator. We reasoned mRuby would be more amenable to circular permutation because of its robust thermo-dynamic stability. Its parental protein, eqFP611, has been shown
to contain atrans-conformation of its chromophore (Petersen
et al., 2003), shifting the tyrosyl moiety of the chromophore in
betweenβ-strands 7 and 8 of the FP barrel. Interestingly,
muta-genesis of eqFP611 to RFP639 shifts the chromophore to the
cis-conformation (Nienhaus et al., 2008), bringing the tyrosyl
moiety in close proximity to strand 10 as well. We therefore tried two different circular permutations, at residues 159 (strand 7) and 196 (strand 10), and additionally tried swapping the M13pep
and CaM domains in each circular permutation (seeFigure 2A
for a schematic of the RCaMP family). The RCaMP scaffold with the circular permutation at the same region as GCaMP (after amino acid 159), sandwiched between N-terminal M13pep and C-terminal CaM in the same positions, was very dimly fluorescent inEscherichia colicolonies after prolonged (4 days) incubation
at 4◦C; the other scaffolds were not fluorescent (not shown) and
abandoned during further optimization.
Random mutagenesis of linker1 (M13pep-to-cp-mRuby; orig-inally the same Leu59-Glu60 as in GCaMP, from the translated XhoI site) resulted in four variants (Pro-Ile, Cys-Ile,
Arg-Ile, Ala-Ile) with faster onset of fluorescence inE. coli(∼1 day).
The variants expressed well inE. coli and eluted as monomers
during size exclusion chromatography (SEC) (Figures 2B,C).
Denaturing SDS-PAGE gels showed that the RCaMPs exhibit a
significant population of backbone-cleaved species (Figure 2D).
Of the four variants, the Ala-Ile linker variant (“RCaMP-AI”)
showed the largest (F/F)max (2.6±0.1, s.d., n=3) (Table 1,
Figure 2E) and was selected for further optimization. A spon-taneous mutation that arose during gene assembly (Asp114Ser)
was also incorporated into RCaMP (Table 1). Fluorescence
spec-tra of purified RCaMP-AI with 450 nm excitation indicated the presence of a substantial green fluorescent component (not shown), potentially from incomplete maturation of the red species by stalling in a green intermediate state, as proposed
for the red FP zFP574 (Ivashkin et al., 2011). To optimize
maturation, we performed error-prone PCR of the RCaMP-AI
template and screened E. coli colonies for variants with faster
and more complete red chromophore maturation. This pro-duced RCaMP1a, with the additional mutations Ala112Tyr and
Thr364Ile (Table 1).
CRYSTAL STRUCTURES OF mRuby, RCaMP, AND R-GECO1
To aid our protein engineering efforts, we sought to solve the crystal structures of mRuby, RCaMP, and R-GECO1. Structural information on the parent protein of mRuby, eqFP611 (86%
sequence identity with mRuby), has been published (Petersen
et al., 2003), however, no protein structure of mRuby was avail-able at the time of initial RCaMP engineering, hampering opti-mization efforts. It has previously been shown that pH can have a large effect on chromophore conformation in red FPs (Battad et al., 2007; Pletnev et al., 2008; Pletneva et al., 2011); therefore we determined the crystal structure of mRuby at two
different pHs: 4.5 and 8.5 (Table 2). The large difference in
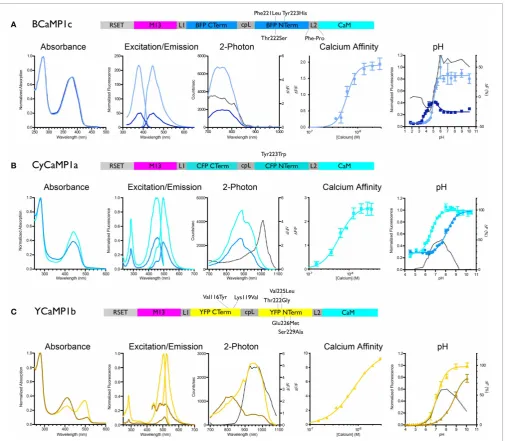
FIGURE 1 | Biochemical characterization of BCaMP, CyCaMP, and YCaMP. Schematic for each color variant is given. For all variants, the lighter-colored lines indicate calcium-saturated spectra, darker-colored lines indicate
calcium-free spectra. The dotted line in the 2-photon graph indicatesF/F, in the pH graph it indicates the difference in fluorescence (%).(A)BCaMP1c, (B)CyCaMP1a,(C)YCaMP1b.
(RMSD= 0.13 Å for 208 Cα atoms). The structure of mRuby
at pH 8.5 shows atrans-isomer of the red
2-(iminomethyl)-4-(4-hydroxybenzylidene)-imidazol-5-one chromophore, while the
structure at pH 4.5 shows a mixture of∼60%transand∼40%
cis. Similar pH-dependentcis-transconformational changes also
occur in the related FP eqFP578 (Pletneva et al., 2011) (70%
sequence identity with mRuby). For other RFPs [mKate (Pletnev
et al., 2008), Katushka (Pletneva et al., 2011) and RtmS5-H148S (Battad et al., 2007); 68, 67, and 51% sequence identity with mRuby, respectively], an opposite pH-induced isomerization of the chromophore has been described. The RMSD between mRuby
and eqFP611 is 1.11 Å for 195 common Cα atoms, with the
largest differences in surface loops resulting from different crystal
packing. It was previously shown that the equilibrium ofcis-trans
isomers of the chromophore in eqFP611 can be influenced by altering the hydrogen-bonding network surrounding the
chro-mophore (Nienhaus et al., 2008), further complicating the
pre-dictability of RCaMP chromophore behavior. To directly observe the chromophore orientation and the structure and extent of cp-mRuby/CaM packing interactions, both of which assisted GCaMP
engineering (Akerboom et al., 2009, 2012a; Tian et al., 2009), we
solved the crystal structure of the early RCaMP variant RCaMP1a.
RCaMP1a was crystallized in the Ca2+-bound form and
its structure was determined to 2.1 Å resolution by
molecu-lar replacement (Table 2). RCaMP crystallized as a monomer,
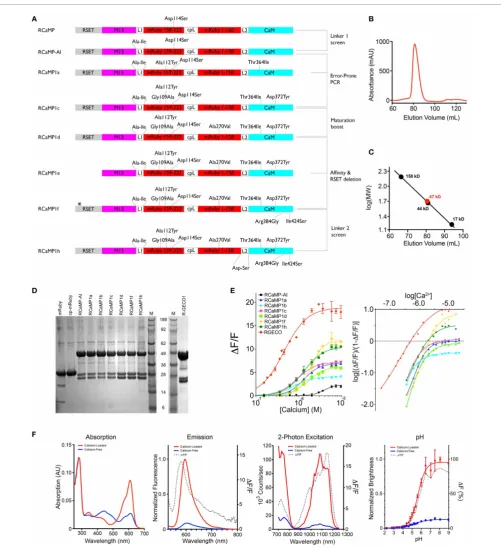
FIGURE 2 | RCaMP engineering andin vitrocharacterization.
(A)Schematic of the RCaMP design process. The star indicates a deletion of two histidines in the poly-histidine tag in RCaMP1f. Numbering is based on RCaMP-AI.(B)Size exclusion chromatogram of purified Ca2+-RCaMP1h.
(C)Calibration curve calculated from molecular weight standards and the estimated mass of RCaMP (47 kD) based on elution volume (bottom). The calculated mass of RCaMP is∼49.2 kD, indicating that RCaMP exists primarily as a monomer in solution.(D)SDS-PAGE of mRuby, RCaMP variants, and R-GECO1. Lane M indicates molecular size marker SeeBlue Plus 2 (Invitrogen). The calculated mass of RCaMP is 49.2 kD (for R-GECO1,
46.9 kD), and the fragments resulting from imine hydrolysis at the chromophore are calculated as 23.2 and 25.9 kD (for R-GECO1, 20.8 and 26.1 kD). For mRuby the calculated masses are 29.3 kD for full-length and 10.9 kD and 18.4 kD for the putative fragments (calculated with AphaEase FC, Genetic Technologies Inc., USA).(E)Ca2+titrations of purified protein (left).
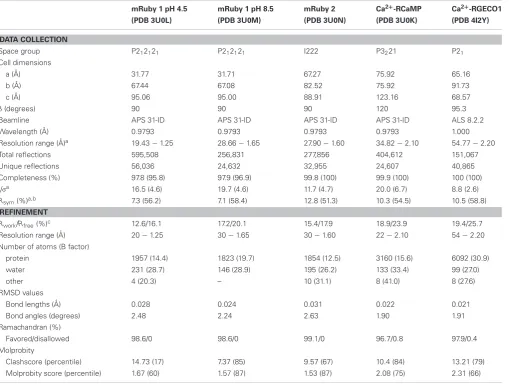
Table 2 | X-ray diffraction data collection and model refinement statistics.
mRuby 1 pH 4.5 mRuby 1 pH 8.5 mRuby 2 Ca2+-RCaMP Ca2+-RGECO1
(PDB 3U0L) (PDB 3U0M) (PDB 3U0N) (PDB 3U0K) (PDB 4I2Y)
DATA COLLECTION
Space group P212121 P212121 I222 P3221 P21
Cell dimensions
a (Å) 31.77 31.71 67.27 75.92 65.16
b (Å) 67.44 67.08 82.52 75.92 91.73
c (Å) 95.06 95.00 88.91 123.16 68.57
β(degrees) 90 90 90 120 95.3
Beamline APS 31-ID APS 31-ID APS 31-ID APS 31-ID ALS 8.2.2
Wavelength (Å) 0.9793 0.9793 0.9793 0.9793 1.000
Resolution range (Å)a 19.43−1.25 28.66−1.65 27.90−1.60 34.82−2.10 54.77−2.20
Total reflections 595,508 256,831 277,856 404,612 151,067
Unique reflections 56,036 24,632 32,955 24,607 40,865
Completeness (%) 97.8 (95.8) 97.9 (96.9) 99.8 (100) 99.9 (100) 100 (100)
I/σa 16.5 (4.6) 19.7 (4.6) 11.7 (4.7) 20.0 (6.7) 8.8 (2.6)
Rsym(%)a,b 7.3 (56.2) 7.1 (58.4) 12.8 (51.3) 10.3 (54.5) 10.5 (58.8)
REFINEMENT
Rwork/Rfree(%)c 12.6/16.1 17.2/20.1 15.4/17.9 18.9/23.9 19.4/25.7
Resolution range (Å) 20−1.25 30−1.65 30−1.60 22−2.10 54−2.20
Number of atoms (B factor)
protein 1957 (14.4) 1823 (19.7) 1854 (12.5) 3160 (15.6) 6092 (30.9)
water 231 (28.7) 146 (28.9) 195 (26.2) 133 (33.4) 99 (27.0)
other 4 (20.3) – 10 (31.1) 8 (41.0) 8 (27.6)
RMSD values
Bond lengths (Å) 0.028 0.024 0.031 0.022 0.021
Bond angles (degrees) 2.48 2.24 2.63 1.90 1.91
Ramachandran (%)
Favored/disallowed 98.6/0 98.6/0 99.1/0 96.7/0.8 97.9/0.4
Molprobity
Clashscore (percentile) 14.73 (17) 7.37 (85) 9.57 (67) 10.4 (84) 13.21 (79)
Molprobity score (percentile) 1.67 (60) 1.57 (87) 1.53 (87) 2.08 (75) 2.31 (66)
aThe number in parentheses is for the highest resolution shell.
bR
sym=ihkl|Ii(hkl)–<I(hkl)>| /hkl<I(hkl)>, where Ii
(hkl)is the ith measured diffraction intensity and<I(hkl)>is the mean of the intensity for the miller index (hkl).
cR
work=hkl|| Fo(hkl)|– |Fc(hkl)|| /hkl|Fo(hkl)|. Rfree=Rworkfor 5% of reflections not included in refinement.
Although the mRuby circular permutation was based on GCaMP, large differences between RCaMP and GCaMP in both the orientation of, and interface between, the CaM/M13 complex
and the cpFP domain can be seen (Figures 3A,B). The CaM/M13
complex of Ca2+-RCaMP is generally similar to that of Ca2+
-GCaMP (RMSD of 1.9 Å for 152 common Cαatoms), but adopts
a slightly more closed and compact conformation. The cp-mRuby domain of RCaMP is structurally very similar to mRuby, with an
RMSD of 0.5 Å for 209 Cαatoms. Strikingly, unlike GCaMP, there
is no large opening in the side of the FPβ-barrel created by the
cir-cular permutation of the mRuby domain in Ca2+-bound RCaMP
(Figure 3B); the termini of cp-mRuby cross close to one another
and produce minimal disruption to theβ-barrel. In contrast to the
construction of the original GCaMP protein (Nagai et al., 2001),
no amino acids of mRuby were replaced by linker amino acids. As a consequence of the circular permutation, though, linker amino
acids partake inβ-barrel formation in the cp-mRuby domain of
RCaMP1a: residue Asn143 of mRuby, which directly hydrogen
bonds the phenolate oxygen of the chromophore, is spatially
sub-stituted by Thr294 of the second linker of RCaMP (Figure 3C);
the crystal structure shows that the asparagine (Asn61 in RCaMP) is co-opted into the first linker. Mutagenesis of this threonine to any other amino acid, or deletion of amino acids to generate an opening similar to GCaMP, greatly diminishes fluorescence of RCaMP (data not shown).
In contrast with the chromophore in the structure of mRuby crystallized at pH 8.5, the RCaMP structure (crystallized at pH 7.5) shows the (4-hydroxybenzylidene)-imidazol-5-one
moi-ety of the chromophore to be a cis-isomer (Figures 3C,D).
Superimposition of both mRuby structures and the cp-mRuby
domain of RCaMP demonstrates a slight (∼1 Å) shift of
the RCaMP chromophore (red structure in Figure 3C)
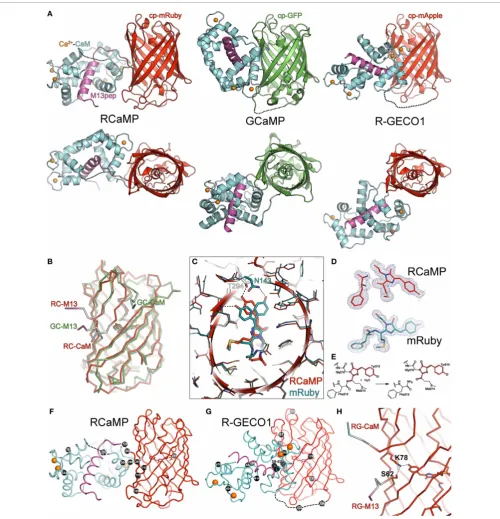
FIGURE 3 | Crystal structures of RCaMP, mRuby, and R-GECO1. (A)Crystal structures of Ca2+-bound RCaMP, GCaMP, and R-GECO1 in two
orthogonal views. The fluorescent protein domain of each sensor was superimposed. Labels indicate the coloring of the domains of RCaMP; coloring of GCaMP and R-GECO1 is identical except that the cpGFP domain is colored green.(B)Ribbon diagram of the superimposed circularly permuted fluorescent protein domains of RCaMP and GCaMP illustrating structural differences at the circular permutation site. Coloring is the same as in(A). Linker connections to the M13 peptide and CaM domains are labeled.(C)Superposition of the cp-mRuby domain of RCaMP with mRuby. Amino acids are displayed as thin sticks, except the chromophore and select chromophore-interacting residues, which are shown as thicker sticks. RCaMP is additionally displayed as a cartoon,
colored as in(A). mRuby is colored cyan. Select hydrogen bonds are displayed as dashed lines. View is oriented and clipped to show the center of the fluorescent protein barrels.(D)The chromophores and preceding amino acid of RCaMP (top, red) and mRuby (bottom, cyan) with the 2Fo-Fc omit electron density map contoured at 1σ superimposed. Note the absence of electron density in RCaMP, indicating backbone cleavage. (E)Proposed hydrolysis of the peptide bond in RCaMP. Atoms involved in the extendedπ-system of the fluorescent chromophore in red.(F)Ribbon depiction of RCaMP with sites of engineering shown as black spheres, with corresponding amino acid number shown. Orientation is as shown for(A).(G)As in(F), but for R-GECO1. Depicted sites of engineering from
Zhao et al.(2011a).(H)In Ca2+-bound R-GECO1, Lys78 forms an ionic
(Met214-Tyr215-Gly216) (Figure 3D). The electron density map is consistent with imine hydrolysis of the RCaMP chromophore, resulting in a ketone on Met214, maintaining the extended π-conjugation of the red chromophore (thus 2-acyl-4-(4-hydroxybenzylidene)-imidazol-5-one), and an amide on Phe213 (Figures 3D,E). This imine hydrolysis results in a discontinuity in the polypeptide backbone of RCaMP, also observed by
SDS-PAGE of purified protein samples (Figure 2D). R-GECO1 showed
a comparable level of backbone cleavage, with two smaller pro-tein bands corresponding to imine hydrolysis of the chromophore (Figure 2D). The electron density map for mRuby shows no
significant imine hydrolysis (Figure 3D). However, after boiling
in the presence of the reducing agent 2-mercaptoethanol dur-ing sample preparation for SDS-PAGE, cleavage products can
clearly be detected (Figure 2D), in agreement with structural and
SDS-PAGE analysis of the red FP DsRed (Gross et al., 2000).
Equivalent amide hydrolysis is reported for the photoactivatable
Kindling Fluorescent Protein (asFP595) (Tretyakova et al., 2007).
Interestingly, cp-mRuby does not show significant levels of imine
hydrolysis (Figure 2D), and also lacks chromophore formation
(not shown). The red-shifting (∼15 nm excitation,∼4 nm
emis-sion) of the RCaMP chromophore relative to mRuby may result from rearrangements around the chromophore, as seen for
eqFP611, RFP611, RFP618, RFP630, and RFP639 (Kredel et al.,
2008), or from planarization following chromophore hydrolysis.
In addition to mRuby and RCaMP, we also crystallized
R-GECO1 (Zhao et al., 2011a) in the presence of Ca2+and solved
the crystal structure to 2.2 Å by molecular replacement (Table 2).
Strikingly, the position of the CaM domain relative to cp-mApple
is distinct from that seen in RCaMP and GCaMP (Figure 3A)—
the homology model used during R-GECO1 design (Zhao et al.,
2011a)—underlining the importance of structure determination in protein engineering. Many of the mutations incorporated into the R-GECO1 sensor during initial screening and
selec-tion (Zhao et al., 2011a) are concentrated at the proto-interface
between mApple and CaM (Figure 3G), as is the case for RCaMP
(Figure 3F). Three residues of the M13pep-cp-mApple linker (Val60, Val61, and Ser62) make hydrophobic and hydrogen-bonding contacts with CaM, cp-mApple, and the rest of the
linker. Similar to GCaMP (Wang et al., 2008; Akerboom et al.,
2009), the cp-mApple-CaM linker is not in close proximity to
the chromophore, and no cp-mApple-CaM linker mutations were
selected in R-GECO1 (Zhao et al., 2011a). In addition to the
linkers, R-GECO1 mutations Gly79, Arg81, Cys129, Phe366, and
Asn380 are in the vicinity of the proto-interface (Figure 3G). No
backbone cleavage was observed in the vicinity of the R-GECO1 chromophore, as was seen in the RCaMP crystal structure. R-GECO-1-Lys78, from strand eight of cp-mApple, adjacent to the circular permutation site, forms an ionic interaction with the phenolate oxygen of the chromophore and is stabilized in place via a hydrogen bond from Ser62, immediately following the
M13pep-cp-mApple linker (Figure 3H).
OPTIMIZATION OF RCaMP
The structure of RCaMP explains the initial selection of muta-tions resulting in RCaMP1a, and allowed us to prioritize sites of mutagenesis for additional rounds of sensor engineering. As in
GCaMP (Wang et al., 2008; Akerboom et al., 2009), the circular
permutation of mRuby and fusion of M13pep and CaM resulted in a tightly packed adventitious interface between CaM and cp-mRuby, excluding solvent from the chromophore environment. The first linker, connecting M13pep and cp-mRuby, comes in close proximity to the chromophore, and the strongly selected isoleucine side-chain packs tightly against the inter-domain linker of CaM and cp-mRuby. Thr294, originally from the translated MluI restriction site in the second linker, hydrogen-bonds the RCaMP chromophore, stabilizing it in the deprotonated state (Figure 3C). The spontaneous (PCR-derived) Asp114Ser muta-tion improves packing against the second linker, especially Gln297 (Figure 3F).
Both mutations from error-prone PCR mutagenesis,
Ala112Tyr and Thr364Ile, improve packing at the mRuby-CaM
interface (Figure 3F). The improved packing of the interface
by these mutations simultaneously increases brightness, red
state maturation completeness and kinetics, (F/F)max, affinity
and cooperativity. A second round of mutagenesis selected Gly109Ala, further improving packing at the mRuby-CaM
interface (Figure 3F) in RCaMP1b, with increased affinity at a
slight loss in (F/F)max(Table 1). The GCaMP5 mutation
CaM-Asp380Tyr (Akerboom et al., 2009) is positioned at the GFP-CaM
interface near the GFP chromophore and led to an increase in
the calcium-bound fluorescence of GCaMP (Akerboom et al.,
2012a). The corresponding mutation to RCaMP1b, Asp372Tyr,
gave rise to RCaMP1c, with (F/F)max=7.5 (Table 1).
RCaMP1d was discovered as a spontaneous, fast-maturing mutant; faster chromophore maturation comes at the cost of
affinity (1.6±0.06μM, s.d.,n=3) and (F/F)max(6.5±0.2,
s.d.,n=3) (Table 1). RCaMP1d was found to contain the
muta-tion Ala270Val; the corresponding mRuby mutamuta-tion, Ala120Val, was independently observed recently during the generation of
mRuby2 (Lam et al., 2012), which exhibits greater brightness
and photostability. Deletion of the RSET peptide resulted in RCaMP1e, which was significantly dimmer in cells, perhaps
indi-cating that RCaMP is stabilizedin situby this N-terminal fusion
peptide, as were early GCaMP variants (Tallini et al., 2006). We
attempted to increase affinity by introducing the CaM mutation
Arg90Gly (Sorensen and Shea, 1996; Akerboom et al., 2012a)
(RCaMP numbering Arg384Gly) and screening libraries around the four EF-hands of CaM, which produced RCaMP1f. Affinity
surprisingly decreased slightly to 1.9±0.08μM (s.d.,n=3), but
(F/F)maxrose to 12.3±0.2 (s.d.,n=3;Table 1,Figures 2A,E).
Lastly, targeted mutagenesis of the second linker (cp-mRuby-to-CaM; encompassing the Thr294-Arg295 linker, as in GCaMP, from the translated MluI site, as well as the subsequent residue
Asp296) resulted in RCaMP1h, with 1.3±0.06μM affinity, and
(F/F)max of 10.5±0.1 (s.d., n=3;Table 1, Figure 2A). The
crystal structure of RCaMP1a suggests that the charge-reversal mutation Arg295Asp likely improves interactions with Arg116
from cp-mRuby (Figure 3F). (RCaMP1g did not perform well in
initial characterization and was not pursued further).
Fluorescence response to Ca2+ titrations of purified RCaMP
and R-GECO1 sensor proteins are shown inFigure 2E-left; a Hill
plot of the data shows linear ranges (Figure 2E-right). All RCaMP
red state and similar extent of backbone cleavage (Figure 2D).
All RCaMPs behave as monomers in solution (Figures 2B,C) and
are fluorescent indicators of Ca2+ under both 1- and 2- photon
excitation (RCaMP1f is shown inFigure 2F).
PHOTOPHYSICAL CHARACTERIZATION OF CHROMATIC VARIANTS Next we purified several RCaMP variants, as well as R-GECO1 and the parent fluorescence proteins mRuby and mAp-ple, and subjected them to systematic photophysical char-acterization, under both 1- and 2-photon illumination. We have previously analyzed the fluorescence mechanism of the
GCaMP calcium indicator (Akerboom et al., 2009; Mütze et al.,
2012), which involves a Ca2+-dependent deprotonation of the
p-hydroxybenzylideneimidazolinone chromophore, leading to
increased fluorescence. In GCaMP, the quantum yield (QY; and
fluorescence lifetime) of the Ca2+-bound (bright) and Ca2+
-free (dim) states are identical; the fluorescence increase upon
Ca2+binding is manifested entirely as an increase in extinction
coefficient (ε), reflecting a greater population of deprotonated,
fluorescent chromophore (Mütze et al., 2012). Strikingly, in the
RCaMP indicators we found that more of the Ca2+-dependent
increase in brightness was attributable to changes in quantum yield and fluorescence lifetime, than to changes in the
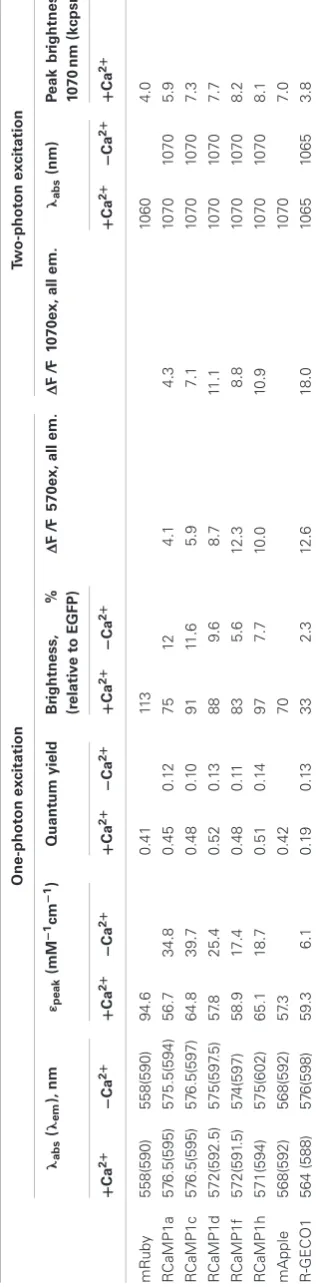
extinc-tion coefficient (Table 3). The peak of the RCaMP Ca2+-bound
state is slightly spectrally shifted relative to the unbound state
(from∼8 nm blue-shifted to∼1 nm red-shifted, for the
differ-ent RCaMP sensors). R-GECO1 shows a larger peak shift: 12 nm blue-shifting of absorption, and 10 nm blue-shifting of emis-sion. Under 1-photon illumination, the parent protein mRuby is
slightly brighter (brightness= ε× QY) than EGFP; the
bright-ness of the Ca2+-bound state of the different RCaMP indicators
is 66–86% that of mRuby (Table 3).
pH titrations of the new sensors show some complex effects; some blue and red GECIs exhibit multiple titratable groups
affect-ing fluorescence (Figures 1, 2, Table 1). Intriguingly, for some
sensors, the pKa of the Ca2+-bound state is higher than that
of the Ca2+-free state (unlike GCaMP), implying that calcium
binding decreases the acidity of the chromophore proton, increas-ing the protonated, and potentially non-fluorescent state of the
chromophore (Tables 1,3). The fact that the sensors nonetheless
exhibit such large increases in fluorescence implies that the photo-physical transitions upon calcium binding are more complicated
than in GCaMP, consistent with the Ca2+-dependent increase in
quantum yield, and the pH-dependentcis-transconformational
changes seen in RCaMP and other RFPs (Battad et al., 2007;
Pletnev et al., 2008; Pletneva et al., 2011). R-GECO1, by contrast,
shows a GCaMP-like Ca2+-dependent decrease of pKafrom 8.9
to 6.6 (Zhao et al., 2011a), consistent with a fluorescence increase
driven largely by extinction coefficient effects (Table 3).
Importantly, RCaMP shows large (F/F)maxsignals under
2-photon illumination, on the order of the 1-2-photon signal change (Figure 2F). Under 2-photon illumination, the RCaMP sensors
are red-shifted and surprisingly brighter than mRuby (Table 3).
For the red indicators, excitation with either a Ti:Sapphire laser or an optical parametric oscillator (OPO) coupled to a primary exciplex laser produced large fluorescence changes upon calcium
addition (Figure 2F). Ta
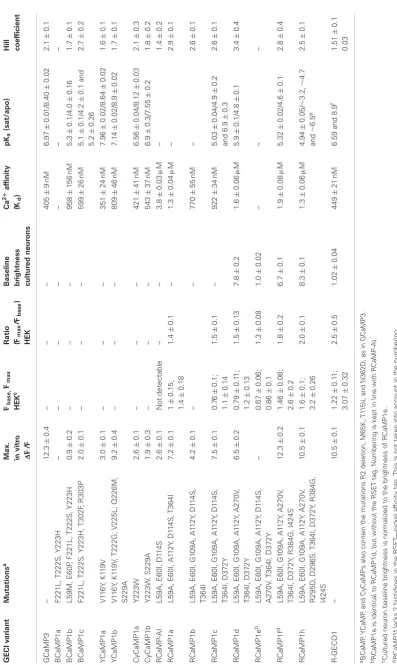
ble 3 | Phot oph y s ica l pa ra me te rs of R C a M Ps, R -G EC O 1 , a nd pa re nt fluor e sce nt pr ot e ins. O n e -phot on e x cita tion T w o-phot on e x cita tion λab s ( λem ), n m
εpeak
[image:10.595.349.511.70.715.2]Red FPs frequently exhibit poor photostability (Drobizhev et al., 2011); this is a serious drawback that limits their utility in experiments. Other photophysical phenomena also compli-cate usage; for instance, mApple shows significant photoswitching (Shaner et al., 2008). We examined the photoswitching and pho-tobleaching properties of the red GECIs and their parent FPs under 1-photon (either lamp excitation or wide-field laser illu-mination) and 2-photon (laser) regimes. As published, mApple
showed an immediate, ∼50% drop in fluorescence upon
illu-mination, which recovered slowly during darkness (data not shown). R-GECO1 showed similar rapid-photoswitching
prop-erties (Figure 4A), which may confound functional imaging.
RCaMP1h displayed a more conventional, irreversible form of photobleaching, and appeared to bleach more slowly for the first several minutes of bright mercury lamp illumination
(2.7 W/cm2). Two-photon illumination of HEK293 cells
express-ing RCaMP1h or R-GECO1 showed a somewhat faster decay of
fluorescence for RCaMP1h compared to R-GECO1 (Figure 4B).
However, 2-photon brightness of several RCaMPs was more than
double that of R-GECO1 (Table 3,Figure 4C). Stopped-flow
flu-orescence showed that decay kinetics of R-GECO1 are about twice as fast as GCaMP5G; RCaMP1h is slightly slower than GCaMP5G (t1/2(decay): R-GECO1, 120 ms; GCaMP5G, 280 ms; RCaMP1h,
410 ms) (Figure 4D).
Strikingly, R-GECO1 displayed significant photoactivation
after illumination (∼2-fold) with 405 nm, 488 nm and 561 nm
light for both calcium-free and calcium-loaded states of the pro-tein, although the activation is different in nature between the two states. This effect was strongest for 488 nm, followed by 405 nm and approximately 10-fold less for 561 nm. Applying 1 s pulses of 488 nm light resulted in a red-shift in absorbance of
calcium-loaded R-GECO1 (Figure 4E-left), resulting in a
tem-porary decrease (∼40%) in fluorescence when illuminated with
561 nm (Figure 4E-right). For calcium-free R-GECO1, 1 s pulses
of 488 nm light resulted in an apparent decrease in absorbance of protonated chromophore and a simultaneous increase in
absorbance in deprotonated chromophore (Figure 4F-left),
mim-icking the effect on fluorescence of calcium binding to R-GECO1 (Figure 4F-right) when illuminated with 561 nm light. This
effect resulted in an apparent increase in fluorescence (∼50%,
Figure 4F-right). Photo-activation could be observed using a range of illumination intensities (0.056–0.66 mW/cm², 488 nm, not shown). Transient decay of the photoactivated state for both calcium-free and calcium-loaded R-GECO1 followed one-phase decay kinetics, with a half-life of 560 ms and 940 ms, respectively (Figures 4H,I). There is also a wavelength shift in the
tran-sient fluorescence, a small red-shift of 2 nm for Ca2+-bound and
7.5 nm for Ca2+-free.
These photophysical effects are not observed for RCaMP (Figure 4G), suggesting that RCaMP may be a better sensor to be used in combination with optogenetic tools.
CHARACTERIZATION IN HEK293 CELLS AND NEURONS
The new sensors, as well as R-GECO1, were next tested in cultured HEK293 cells and neurons, according to protocols that we have
established for optimizing GCaMP (Tian et al., 2009; Akerboom
et al., 2012a,b). The red GECIs were first tested in transfected
HEK293 cells following acetylcholine (ACh)-evoked Ca2+
mobi-lization (Figures 5A,B). Subsequently, cultured rat hippocampal
neurons were infected with lentivirus driving GECI expression and imaged following AP elicitation with a bath electrode (1 AP
per field stimulation) (Akerboom et al., 2012a) (Figures 5C,D).
In both HEK293 cells and neurons, the RCaMP and R-GECO1 sensors were expressed in both the cytoplasm and nucleus, in con-trast to GCaMP, which appears to have a cryptic nuclear-exclusion
sequence (Tian et al., 2009). RCaMP- and R-GECO1-
express-ing cells appeared healthy; thus the nuclear expression does not seem to correlate with the “cytomorbid” state seen with
long-term GCaMP over-expression (Tian et al., 2009). The expression
in the nucleus may give rise to a slower, weaker Ca2+ response
(Bootman et al., 2009) than the cytoplasmic response, with the conflated epifluorescence signal thus appearing slower and less sensitive to APs.
The four RCaMP sensors tested (1d, 1e, 1f, and 1h) performed similarly well in neurons, showing observable responses
follow-ing a minimum of 5 field stimuli, and reachfollow-ing a maximumF/F
of 1.0–1.5 after 160 field stimulations. RCaMP1f and RCaMP1h were approximately twice as bright in cultured neurons as the
other RCaMPs, and displayed almost identicalF/F and SNR.
R-GECO1 was more sensitive, responding to 2 APs. SNR for R-GECO1 was also higher than for the RCaMPs, although the
RCaMPs are brighter (Figure 5D). YCaMP1b showed twice the
response of the RCaMPs at higher numbers of field stimuli, but required a minimum of 20 field stimuli to observe any response. However, SNR for both RCaMP1f and RCaMP1h was higher than YCaMP1b at high field stimulations, as YCaMP1b is dimmer.
The RCaMPs were also somewhat slower than R-GECO1 in the rise and decay from electrical stimulation. For the
10 AP stimulation, the time-to-half-decay t1/2(decay) and
time-to-half-rise t1/2(rise) values for the GECIs were
(R-GECO1: 0.78±0.13/0.09±0.02 s, n=15; RCaMP1d: 1.61±
0.85/0.29±0.03 s,n=16; RCaMP1e: 1.57±0.20/0.29±0.02 s,
n=13; RCaMP1f: 1.80±0.33/0.27±0.02 s, n=16;
RCaMP1g: 1.69±0.63/0.28±0.05 s, n=16; RCaMP1h:
1.83±0.30/0.32±0.04 s,n=15; all measurements s.d.).
TWO-COLOR SUB-CELLULAR IMAGING IN NEURONS
Having established the baseline performance level of the RCaMP indicators in neurons, we sought to demonstrate the utility of RCaMP in two-color imaging, beginning by labeling two com-partments of one cell. First, RCaMP1e was fused with an N-terminal cytochrome C oxidase subunit VIII tag for targeting to the mitochondrial matrix, expressed by AAV6 virus, and
co-infected along with cytoplasmic GCaMP3.5 (Tian et al., 2009)
(GCaMP3 without the CaM-Asn60Asp mutation; affinity ∼
3-fold lower than GCaMP3) into primary rat cortical neurons.
Upon stimulation of Ca2+ release from the endoplasmic
retic-ulum (ER) by addition of 10 mM caffeine, RCaMP fluorescence
initially rose together with GCaMP fluorescence (Figure 5E),
con-sistent with Ca2+release from the ER through the
mitochondrial-associated membrane (MAM) (Hayashi et al., 2009), while the
bulk of Ca2+ released from the ER entered the cytoplasm
before being buffered in mitochondria. Likewise, depolarization
FIGURE 4 | Biophysical characterization RCaMP and R-GECO1. (A)1-photon Photobleaching of RCaMP1h and R-GECO1 compared. Note the fast decay during the first second and partial re-activation of R-GECO1 during darkness (after each 10 s) of R-GECO1 (arrows).(B)2-photon photobleaching of RCaMP1h and R-GECO1 in HEK293 cells.(C)2-photon peak brightness spectra (Mütze et al., 2012) of select RCaMPs and R-GECO1 compared.(D) Stopped-flow fluorescence of R-GECO1, GCaMP5G, and RCaMP1h. Protein concentration, 1μM. Initial [Ca2+],
10μM. [EGTA], 10 mM.(E,F)Transient response of 10μM R-GECO1 following a pulse of 488-nm light at 600 mW/cm2 for 1 s, in+Ca2+buffer
(D)and Ca2+-free buffer(E), showing time evolution of absolute
absorbance (left panels), transient absorbance pre-488 and post-488
(middle panels), and absolute fluorescence induced by weak 561-nm excitation before and following the 488-nm pulse (right panels).(G)In contrast with(D)and(E), 10μM Ca2+-free RCaMP1h shows only a very
small increase in absorbance around 550 nm (lower panel) and no change in absorbance in+Ca2+buffer (upper panel). No differences are seen in
fluorescence (data not shown).(H)The transient absorption decay in time is well fit by exponential decay kinetics with e−1 time constants of 0.96 s
and 0.58 s for+Ca2+and no-Ca2+, respectively.(I)R-GECO1 transient
fluorescence is also well fit by exponential decay kinetics with e−1time
constants of 1.01 s and 0.56 s for+Ca2+ buffer and no-Ca2+ buffer,
FIGURE 5 | Characterization of the RCaMP, R-GECO1, and YCaMP in cells. (A)Baseline and peak fluorescence of HEK293 cells expressing the red GECIs, in response to acetylcholine (Ach)-induced Ca2+mobilization.
(B)Fluorescence response (Fmax/Fbaseline) for the red GECIs vs. Ach
concentration.(C)Fluorescence increase (F/F)maxof the red and yellow
GECIs, as well as OGB-1, in cultured rat hippocampal neurons following
electrode-evoked action potential trains. Plotted is mean±sem (n=13–16). (D)Signal-to-noise ratio of the data shown in(C). Plotted is mean±sem (n=13–16).(E,F)F/Ftime-lapse traces from rat cortical neurons expressing RCaMP1e in mitochondria (red) and GCaMP3.5 in cytosol (green) after caffeine-mediated Ca2+release from ER(E)and KCl-mediated Ca2+
influx from extracellular medium(F).
the cytoplasm and subsequently into mitochondria (Figure 5F).
These experiments demonstrate the simultaneous visualization
and tracking of sub-cellular Ca2+ fluctuations using RCaMP
together with GCaMP. This paradigm may be expanded to
track-ing of sub-cellular Ca2+mobilizations under various
physiologi-cal or pathophysiologiphysiologi-cal conditions in various cell types.
TWO-COLOR IMAGING IN MIXED CULTURE OF NEURONS AND ASTROCYTES
Communication between astrocytes and neurons has been impli-cated in information processing in the brain. We therefore sought to test the utility of dual-color neuron/astrocyte imaging using
RCaMP1h and GCaMP5G (Akerboom et al., 2012a) (Figure 6).
RCaMP1h is 80 nm red-shifted relative to GCaMP5G; there-fore signals from each population of cells are expected to be
easily deconvoluted. First, RCaMP was expressed in cultured
rat hippocampal neuronsviaAAV2/1-synapsin1virus infection;
GCaMP5G was expressed in astrocytesviaAAV2/1-GFAPvirus
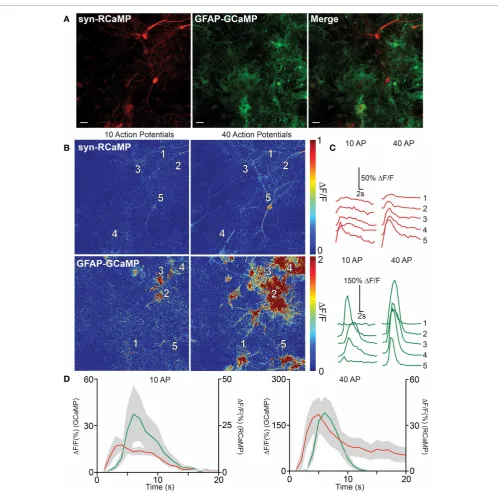
(Figure 6A). The two infected cell populations were then co-cultured. One week post-infection, we observed robust labeling of neurons only with RCaMP and astrocytes only with GCaMP. Simultaneous dual-color imaging of neuronal and astrocytic responses to field stimulations was then performed. The num-ber and magnitude of evoked calcium events in both neurons and astrocytes increased with the number of evoked APs, and most importantly, dual-color imaging revealed the spatiotem-poral relationship between field stimulus-evoked neuronal and
astrocytic calcium responses (Figures 6B–D). At lower
FIGURE 6 | RCaMP visualization in co-culture with GCaMP-expressing astrocytes. (A)Expression of RCaMP1h and GCaMP5G in cultured rat hippocampal neurons and astrocytes using tissue specific promoters. Scale bars: 10μm.(B)Heat maps of neuronal (top) and astrocyte (bottom) activity in response to 10 (left) and 40 (right) field stimulations. Five ROIs are
specified surrounding neuron and astrocyte somata. (C)Single-trial neuron (top) and astrocyte (bottom) calcium activity in selected ROIs, following 10 (left) and 40 (right) evoked action potentials.(D)The average GECI responses of neurons (red) and astrocytes (green) following 10 (left) and 40 (right) field stimulations. Mean±sem. (n=5) shown.
(Figures 6B,C). Following larger stimuli, more neuronal activ-ity was detected, which triggered broad astrocytic calcium events
in the imaged field (Figure 6B). The peak responses of
astro-cytes typically lagged neuronal responses by∼1 s (Figure 6D).
These results clearly show that dual-color imaging with RCaMP and GCaMP (and other indicators) holds great promise to dissect neuron-astrocyte, or other inter-cellular, communication.
IMAGING RCaMP ACTIVITY INDrosophilaLARVAL MOTOR NEURON TERMINALS
We next sought to establish RCaMP performance inDrosophila
larvae using the GAL4-UAS system (Brand and Perrimon, 1993).
We drove expression of RCaMP1f in larval motor neurons using
a GAL4 driver line specific for glutamatergic neurons [OK371
junctions (NMJs) were then imaged in dissected fillet prepa-rations. Motor neuron terminals showed bright fluorescence; RCaMP transients in the terminals were imaged under 1-photon
illumination in response to motor nerve stimulation (Figure 7A).
Terminals showed little or no response to long (2 s) bursts of APs
at 1–10 Hz (Figure 7B). Above 20 Hz, motor terminals showed
modest peak amplitudes, peaking at∼30%F/F in response
to 160 Hz stimulation (Figure 7C). RCaMP responded slowly to
all stimulation frequencies; times to half-peak and half-decay
were∼1 s at 40, 80, and 160 Hz (rise and decay time constants
could only be accurately measured at the highest stimulation frequencies).
IMAGING SENSORY-EVOKED Ca2+TRANSIENTS IN WORMS
We subsequently imaged RCaMP activity in the AWC neurons of
C. elegansin response to odor addition and removal sequences,
as previously described (Akerboom et al., 2012a). RCaMP1a and
RCaMP1e were selected for testing. All RCaMP constructs were
expressed in the AWConsensory neuron under the control of the
str-2promoter. After 10 s of observation, odor (IAA @ 10−4v/v) was added for 5 min. At the last 10 s of odor addition, imaging was commenced for another minute to observe the neuron’s response
to odor removal (the AWCon neuron activates in response to
odor removal). Interestingly, RCaMP1a outperformed RCaMP1e
during IAA addition;F/F and SNR of RCaMP1a were higher
compared to RCaMP1e for IAA addition (Figure 7D), although
RCaMP1e showed almost identicalF/F and SNR upon odor
removal.
In addition, we demonstrated the utility of RCaMP1h in visu-alizing contractions of the pharyngeal muscles (strain ZX1423;
zxEx795[pmyo2::RCaMP1h; pmyo-3::eCFP]). Worm heads were
cut off (Avery et al., 1995), placed in an imaging chamber in buffer
Em D50, and illuminated with a 590 nm LED (80 mW/cm2). As
a control, worm heads of another transgenic strain (expressing mCherry in pharynx muscle) were imaged separately. RCaMP1h signal tracked pharyngeal pumping events, with large,
repro-ducible increases up to ∼40% F/F (Figure 7E). In control
animals, mCherry signal did not vary during the same prepara-tion, indicating that motion artifacts play no role in the observed
RCaMP signal (Figure 7E, bottom).
In vivoIMAGING IN ZEBRAFISH TRIGEMINAL NEURONS
We next imaged activity in trigeminal sensory neurons of 48 h post-fertilization zebrafish using RCaMP1a and RCaMP1b (Figure 7F). Trigeminal neurons are usually silent, and fire one
or a few spikes in response to light touch (Douglass et al.,
2008). We recorded fluorescence changes in response to trains of
brief (1 ms) pulses of electrical field stimulation (Materials and Methods). Both indicators performed similarly, giving steadily increasing responses for trains of 20–320 pulses, reaching a
max-imum F/F of about 100% (Figure 7F-left) and SNR of ∼25
(Figure 7F-right).
INTEGRATED OPTOGENETICS/IMAGING WITH RCaMP AND CHANNELRHODOPSIN-2 (ChR2)
As discussed above, simultaneous light-mediated activation of neural activity (optogenetics) and fluorescent imaging of activity
(either in the same or a different cell) is currently quite
dif-ficult, as the action spectra of opsins are very broad (Zhang
et al., 2011), overlapping the excitation spectra of commonly used indicators such as GCaMP, Yellow Chameleon, and TN-XXL. In such regimes it is impossible to image the indicator without inadvertently driving the actuators, precluding baseline measurements. Furthermore, activators are typically driven with strong light intensities to achieve fast, reliable cell depolariza-tion, and this can bleach indicators if they overlap. Integrated, non-overlapping imaging/optogenetics will enable qualitatively new sorts of neuroscience experiments, such as mapping pro-jections of numerous single neurons through brain tissue, akin to an “all-optical” channelrhodopsin-assisted circuit mapping
(CRACM) experiment (Petreanu et al., 2007). To facilitate such
experiments, GECIs must either be red-shifted past effector action spectra, or effectors must be shifted away from GECI excitation. Significant progress has been made at red-shifting optogenetic
activators (the C1V1 variant (Yizhar et al., 2011b) being the
most red-shifted variant available, with maximum absorption at 550 nm); however, the action spectrum of this effector still substantially overlaps GECI excitation. Therefore, blue light
acti-vation combined with red Ca2+indicators appears to be the best
option for integrated optogenetics. The use of R-GECO1 and its mutants in combination with ChR2 in pyramidal neurons has
been recently reported (Chang et al., 2012; Ohkura et al., 2012).
However, the blue light-induced photoactivation of RGECO-1,
as described above in protein and belowin vivo, calls into
ques-tion the nature of the fluorescent transients in these papers. Both papers employed mammalian neurons, which have
suffi-cient levels of all-transretinal (ATR) to support ChR2 function.
In both cases, no ChR2-free controls to exclude the possibil-ity of R-GECO1 blue-light photoactivation being the principal contributor to the observed signals were performed. Our results with R-GECO1 suggest that some or all of the observed signals previously reported on may be artifactual.
First, we tested RCaMP1e together with ChR2-Thr159Cys
[ChR2(TC)] (Berndt et al., 2011), as well as GCaMP3 (Tian et al.,
2009) with the red-shifted channelrhodopsin C1V1 (Figure 8A).
Initial experiments were performed in cultured cells, using GECIs
directly fused to effector proteins (Figure 8A), in order to
mea-sure Ca2+ flux into the depolarized cells close to the cell
mem-brane (Figure 8B). This arrangement creates equimolar amounts
of effector and sensor, largely controlling for expression level
dif-ferences in this preliminary intra-cellular assay. To measure Ca2+
flux we employed a stable HEK cell line expressing the leaky mTrek potassium channel and a voltage-gated calcium chan-nel (CaV3.2). In darkness, membrane voltage is controlled by extracellular potassium. Upon light-activation of ChR, cells depo-larize and subsequent CaV3.2 opening leads to an increase in
intracellular [Ca2+] (Figure 8B). Expression of the two fusion
constructs was comparable (Figure 8C). The excitation spectrum
of GCaMP3 and the action spectrum of C1V1 show significant
overlap compared to RCaMP1e and ChR2(TC) (Figure 8D). To
characterize the level of cross-activation we first tested photocur-rent amplitudes induced by light of 400, 450, and 560 nm, for
both constructs (Figure 8E). ChR2(TC) exhibits virtually no
FIGURE 7 | RCaMP visualization inDrosophilalarvae,C. elegans,and zebrafish. (A)Boutons expressing RCaMP1f inDrosophilalarval muscle 13 before (left) and at the end of (right) a 160 Hz, 2 s train of nerve stimulations. Asterisk indicates typical proximal bouton used for ROI measurements.(B) Raw traces from single ROI (∗) showing percent changes in fluorescence in response to a range of stimulation frequencies.(C)Fluorescence change (mean±s.e.m.)F/Fin response to increasing stimulation frequency (left), time to reach half peak amplitude (mean±s.e.m., middle) and time to reach half decay at 40, 80, and 160 Hz (right, mean±s.e.m.).(D)RCaMP1a and RCaMP1e responses to isoamyl alcohol (IAA, 10−4v/v) presentation (left two
panels) and removal (right two panels) inC. elegansAWC olfactory neurons. BothF/Fand SNR are shown for presentation and removal. Note that odor
decreases calcium in these neurons. Traces are mean±s.e.m.(E)RCaMP1h was expressed in the pharynx muscular pump and imaged for 20 s (blue trace) while the structure was pumping. Pump events were annotated based on visible movements of the terminal bulb (red circles). Ca2+trace shows
large increases following/concomitant with bouts of pharynx pump events. To verify that movement artifacts would not cause such signals, mCherry expressed in the pharynx muscle was analogously imaged in a separate experiment (green trace); here, pump events were detected in a kymograph showing the opening of the pharynx lumen (gray trace).(F)Imaging of RCaMP1a (n=12) and RCaMP1b (n=8) in zebrafish trigeminal neurons.
F/F(left) and SNR (right) in response to trains of field stimulations of increasing length (shaded region). Mean±s.e.m. shown.
can be activated with 400 and 450 nm (Figure 8F). C1V1 shows
activation of more than 40% at all tested wavelengths, including
GCaMP3 excitation at 450 nm (Figures 8E,F).
The separation of ChR2(TC) activation and RCaMP excita-tion allowed intense, simultaneous stimulaexcita-tion and imaging, at
450 nm (56 mW/cm2) and 560 nm (20 mW/cm2), respectively
(Figure 8G-top). With 2 mM extracellular [Ca2+], 300 ms pulses of 450 nm light were sufficient to open calcium channels, giving
rise to robust RCaMP transients (7.5±0.9%, s.d. 5.43,n=36),
although variability between single-trial traces was relatively high (Figure 8H). Although it was also possible to image GCaMP3 fluorescence in conjunction with C1V1 activation, the spectral overlap required the excitation beam to be significantly
attenu-ated (0.7 mW/cm2, 440 nm light), which produced very little
flu-orescence (Figure 8G-bottom). With 5 mM extracellular [Ca2+],
300 ms pulses of 560 nm light yielded only small increases in
GCaMP3 fluorescence (3.7±0.1%, s.d. 0.43,n=7) (Figure 8H).
Increasing extracellular [Ca2+] improved fluorescence signals
in both preparations (Figure 8H), with the RCaMP increases
reaching 35% (F/F)max, and GCaMP3 increases reaching 6%
(F/F)max. Addition of the calcium channel blocker mibefradil
abolished signals in both cases, indicating that very little Ca2+
is flowing directly through the opsins (Figure 8H) (Prigge et al.,
2010).
Having established integrated optogenetics with RCaMP and
ChR2 in cell culture, we then deployed themin vivoinC.
ele-gans, expressing RCaMP in muscles, and ChR2 either in muscles
as well, or in the upstream motor neurons. RCaMP
expres-sion was bright and restricted to muscles (Figure 9A). First, we
tested the performance of RCaMP1e in visualizing spontaneous
muscle contractions, in semi-restrained animals (Figure 9B).
Fluorescence traces in ROIs from the dorsal and ventral sides
showed clear antiphasic fluorescence increases (Figure 9C),
con-sistent with expected muscle contractions during crawling. Fluorescence increases approached 50–60% during spontaneous muscle contraction.
Next ChR2 was co-expressed in muscles alongside RCaMP1e or RCaMP1h, to compare the responses of light-evoked contrac-tions to spontaneously arising ones. Worms lack ATR, thus to facilitate ChR2 activation, worms were cultivated in the pres-ence of ATR. Negative control experiments were performed in the absence of added ATR. Light pulses from a blue LED (100 ms,
470 nm, 50 mW/cm2) were used to activate ChR2; little
photo-bleaching of RCaMP was seen during experiments. RCaMP was
excited with a yellow-orange LED (590 nm, 79.3 mW/cm2), which
elicits no activation of ChR2 (Figures 8D,E, 9D–H). The blue
light stimulus caused a small fluorescence increase in the RCaMP
channel, due to autofluorescence from the tissue (Figures 9D–
F,I). To account for this, background signals were subtracted from
images during the photostimulation, when prolonged stimuli
were applied (Figures 9G–I). Blue light pulses evoked large, slow
RCaMP transients in muscles; signals were comparable to those from naturalistic muscle contractions, although they decayed
more slowly (Figure 9D). In the absence of retinal, no RCaMP
signal increases were observed. Thus, the observed RCaMP sig-nals are due exclusively to ChR2-evoked activity, and not to any potential artifacts.
Subsequently, we expressed ChR2 in cholinergic motor
neu-rons [transgenezxIs6, using thepunc-17promoter (Liewald et al.,
2008)], pre-synaptic to muscle cells, and RCaMP1h in
mus-cles. Again, we presented 100 ms blue light pulses and could
detect a subsequent Ca2+ increase on the order of that seen
from spontaneous muscle contraction and ChR2-evoked
mus-cle depolarization (Figure 9E). The cholinergic neuron-evoked
signal reached its peak after∼3 s and returned to baseline after
∼12 s (Figure 9E). Again, this signal increase was only observed
if retinal was added during cultivation. In muscles that were not transgenic for RCaMP, but nevertheless were innervated by ChR2-positive neurons, no fluorescence increase could be observed (Figure 9F). Similarly small amounts of autofluorescence were observed between RCaMP-positive and RCaMP-negative worms (data not shown).
We further characterized the motor neuron-induced Ca2+
transients in muscles expressing RCaMP1e. We presented pro-longed photostimuli (1.2 s, 470 nm) to the ChR2-expressing cholinergic neurons; robust responses were seen only in
RCaMP1e- positive muscles (Figure 9G). With increasing
inten-sity of ChR2 activation, Ca2+transients in muscles rose
accord-ingly, from∼2% to ∼25% (F/F)max, for 1 and 50 mW/cm²
stimulus intensity, respectively (Figure 9H).
Above we showed that R-GECO1 shows dramatic reversible photoactivation by blue and green light, both in the
pres-ence and abspres-ence of Ca2+. We subsequently extended these
results in vivo, imaging R-GECO1 with ChR2 expressed in
cholinergic neurons. Although red fluorescence transients were observed upon blue light stimulation, identical responses were
observed in worms not supplemented with ATR (Figure 9I),