Dosimetric comparison of peripheral NSCLC SBRT using
Acuros XB and AAA calculation algorithms.
ONG, Chloe C H, ANG, Khong Wei, SOH, Roger C X, TIN, Kah Ming, YAP,
Jerome H H, LEE, James C L and BRAGG, Christopher Mark
<http://orcid.org/0000-0003-4509-0524>
Available from Sheffield Hallam University Research Archive (SHURA) at:
http://shura.shu.ac.uk/16367/
This document is the author deposited version. You are advised to consult the
publisher's version if you wish to cite from it.
Published version
ONG, Chloe C H, ANG, Khong Wei, SOH, Roger C X, TIN, Kah Ming, YAP, Jerome
H H, LEE, James C L and BRAGG, Christopher Mark (2017). Dosimetric comparison
of peripheral NSCLC SBRT using Acuros XB and AAA calculation algorithms.
Medical dosimetry : official journal of the American Association of Medical
Dosimetrists, 42 (3), 216-222.
Copyright and re-use policy
See
http://shura.shu.ac.uk/information.html
1 | P a g e
*Manuscript
Dosimetric Comparison of Peripheral NSCLC SBRT using Acuros XB
and AAA Calculation Algorithms
Chloe C. H. Ong
a, Khong Wei Ang
b, Roger C. X. Soh
c, Kah Ming Tin
b, Jerome H. H. Yap
b,
James C. L. Lee
b,c, and Christopher M. Bragg
aa
Faculty of Health and Wellbeing, Sheffield Hallam University, United Kingdom b Division of Radiation Oncology, National Cancer Center Singapore, Singapore (NCCS)
cDivision of Physics and Applied Physics, School of Physical and Mathematical Sciences, Nanyang Technological University, Singapore
Contacts of the corresponding author:
Ong Chiew Hyen Chloe
Mailing address: 110 Middle Road #06-03, Chiat Hong Building, Singapore 188968
City: Singapore
Country: Singapore
Email:
Word Count
: 3609 words
Conflict of Interest Statement:
None of the authors of this paper is under financial or personal relationship with other
people or organizations that could inappropriately influence or bias the content of the paper.
Acknowledgement:
2 | P a g e
*Manuscript
Dosimetric Comparison of Peripheral NSCLC SBRT using Acuros XB and
AAA Calculation Algorithms
________________________________________________________________________________
Abstract:
There is a concern for dose calculation in highly heterogenous environments such as the thorax region. This study
compares the quality of treatment plans of peripheral non-small cell lung cancer (NSCLC) stereotactic body radiation
therapy (SBRT) using 2 calculation algorithms, namely, Eclipse Anisotropic Analytical Algorithm (AAA) and Acuros
External Beam (AXB) for 3-dimensional conformal radiation therapy (3DCRT) and volumetric-modulated arc therapy
(VMAT). Four-dimensional computed tomography (4DCT) data from 20 anonymized patients were studied using
Varian Eclipse planning system, AXB, and AAA version 10.0.28. A 3DCRT plan and a VMAT plan were generated
using AAA and AXB with constant plan parameters for each patient. The prescription and dose constraints were
benchmarked against Radiation Therapy Oncology Group (RTOG) 0915 protocol. Planning parameters of the plan
were compared statistically using Mann-Whitney U tests. Results showed that 3DCRT and VMAT plans have a lower
target coverage up to 8% when calculated using AXB as compared with AAA. The conformity index (CI) for AXB
plans was 4.7% lower than AAA plans, but was closer to unity, which indicated better target conformity. AXB
produced plans with global maximum doses which were, on average, 2% hotter than AAA plans. Both 3DCRT and
VMAT plans were able to achieve D95%. VMAT plans were shown to be more conformal (CI = 1.01) and were at
least 3.2% and 1.5% lower in terms of PTV maximum and mean dose respectively. There was no statistical significant
difference for doses received by organs at risk (OARs) regardless of calculation algorithms and treatment techniques.
In general, the difference in tissue modeling for AXB and AAA algorithm is responsible for the dose distribution
between the AXB and the AAA algorithms. The AXB VMAT plans could be used to benefit patients receiving
3 | P a g e
*Manuscript
Dosimetric Comparison of Peripheral NSCLC SBRT using Acuros XB and
AAA Calculation Algorithms
________________________________________________________________________________
Introduction
Lung cancer is one of the most common cancers in Singapore [1]. Non-small cell lung cancer (NSCLC)
is the commonest type of lung cancer [2]. The preferred treatment for NSCLC is surgery. However, this is
often limited by the patients’ conditions, deeming them as medically inoperable.
Stereotactic body radiation therapy (SBRT) is a technique that delivers a high dose (10 to 30 Gy per
fraction), providing treatment results comparable with surgery for medically inoperable patients [3]. SBRT
can be planned and delivered using both 3-dimensional conformal radiation therapy (3DCRT) and
volumetric-modulated arc therapy (VMAT) techniques.
Dose calculation in radiation therapy planning remains a challenge in the thorax region given the
presence of large tissue inhomogeneities including bone, air and soft tissue [4]. The small field sizes in
SBRT add to the challenging dose calculation, where electronic disequilibrium increases with decreasing
field sizes. Different types of calculation algorithms have been developed to improve the accuracy of dose
calculation. With advances in radiation transport modeling, improvements in the accuracy of dose
calculations will be one of the ultimate goals in radiation therapy.
The Acuros External Beam (AXB) calculation algorithm has been implemented in the Eclipse treatment
planning system (Varian Medical Systems, Palo Alto, CA). The algorithm has been found to show greater
calculation accuracy than its existing algorithm – the Analytical Anisotropic Algorithm (AAA). AXB uses a
grid-based Linear Boltzmann Transport Equation solver to account for inhomogeneous materials in dose
calculation. It solves the Linear Boltzmann Transport Equation using numerical methods and is expected to
have solutions that converge with the Monte Carlo benchmark [5]. The AAA has been routinely used in
treatment planning and consists of a photon beam source model, using the superposition-convolution method
to approximate changes in lateral electron transport. Electron transport modeling is approximated by scaling
the energy of primary electrons and scattered photons rectilinearly with the electron density of the medium
[6]. A dosimetric validation in homogeneous medium showed that AAA and AXB are in agreement with
homogeneous media to within 1.9%, but differences in calculated doses of up to 17.5% within
4 | P a g e
electron and photon scatter do not follow the rectilinear paths assumed in AAA. The electronic
disequilibrium on the field central axis in low-density material becomes larger as the field size decreases.
For small field sizes, there are more electrons traveling away from the corresponding volume element on the
central axis than toward it. This is caused by missing scatter from the material outside the geometrical field
boundaries, where part of the electrons from the central axis is transported [6].
AXB has a better spatial resolution than AAA, increasing resolution in high dose and high dose gradient
areas, and reducing it outside the fields where there are fewer interactions [8]. This is owing to the
improvements in how AXB models radiation transport, interaction and scatter. AAA uses radiological
scaling to account for heterogeneity, where electron density is used to approximate electron dose deposition,
whereas AXB uses mass density to calculate dose using macroscopic cross sections.
Fogliata et al. [9] created treatment plans for 10 patients with advanced NSCLC and compared the dose
calculations between AXB and AAA calculation algorithms. They reported that AXB calculations were
more accurate than AAA. The results of this study were also supported by other authors [10-12]. The
accuracy of AXB dose calculation was also found to be comparable with Monte Carlo calculation algorithm,
which is deemed to be the gold standard in dose calculation in radiation therapy.
Although some dosimetric studies have been reported, most comparisons were performed in subject
groups with large data deviation. In some studies, the subject groups contained both patients with peripheral
tumors and patients with central tumors, whereas in others, the tumor locations were not reported. In
addition, the staging of the subjects varied from stage 1 to stage 3. These variables can introduce results
which is not a good indicator if the dose distribution is purely due to differences in calculation algorithms.
Therefore, the primary aim of this study was to investigate whether there was a significant difference
between the dose distributions calculated by the 2 algorithms, AAA and AXB for peripheral lobe lung
SBRT. Comparisons would be by the dosimetric evaluation of the dose received by 95% of the planning
target coverage (PTV), conformity index (CI), gradient index (GI), and doses to the organs at risk (OARs)
defined in Radiation Therapy Oncology Group (RTOG) 0915 [13]. A secondary aim was to determine
whether there was a difference in the quality of 3DCRT and VMAT treatment plans for lung patients
receiving SBRT.
These results will provide clinicians with evidence of the 2 dose calculation algorithms and the preferred
treatment technique for lung patients undergoing SBRT, assisting them in the possible implementation of
5 | P a g e
Methods and Materials
Patient data
A total of 20 patients with NSCLC, who had undergone SBRT treatment between 2010 and 2014, were
selected for this retrospective study. The subjects selected had fulfilled the following criteria:
• undergone 4-dimensional (4D) computed tomography (CT) acquisition;
• treatment intent is radical and for SBRT;
• patient’s histology is NSCLC;
• size of tumor is less than or equal to 5 cm in the widest diameter;
• peripherally located tumor.
Each patient was setup in the supine position, with their arms above the head, immobilized using a blue
vac-bag. During CT simulation, 2 scans were performed – 1 helical scan with contrast and another
4-dimensional CT scan. CT slice thickness for both scans was 2.5 mm in accordance with the departmental
protocol. Before the commencement of this study, all the image datasets had been anonymized. Contouring
of the target volumes and OARs was performed on the average intensity projection (AIP) image datasets, by
the respective radiation oncologists according to RTOG 0915. Ethics approval was obtained from
SingHealth Centralised Institutional Review Board.
Treatment planning
Two treatment techniques, namely 9-field coplanar conformal radiation therapy and VMAT, were used
in this study. Nine equally spaced fields, over an arc of 160 degrees, were used for the planning of the
conformal technique. Wedges were used to improve the dose homogeneity and conformity of the isodose
distribution. For the VMAT treatment technique, 3 non-coplanar partial arcs were used for all the patients to
achieve the planning requirements and ensure clinical delivery feasibility. Couch and collimator rotation
were combined to provide a better dose homogeneity while reducing intra-leaf leakage and improving
conformity to target volumes. Figure 1 shows a typical example of the beam arrangements for both the
3DCRT plan and the VMAT plan. All plans were generated for a Varian Clinac IX linear accelerator using 6
6 | P a g e
Both 3DCRT and VMAT plans were calculated using the AAA calculation algorithm. On completion of
the 2 treatment plans, they were recalculated using the AXB (version 10.0.28 Varian Medical Systems, Palo
Alto, CA) calculation algorithm, keeping all beam parameters the same. Thus, each patient had a total of 4
treatment plans – a 3DCRT plan for both AAA and AXB and a VMAT plan for both AAA and AXB. All
the AAA plans were created with a prescription of 48 Gy in 4 fractions to encompass 95% of the PTV. To
enable comparison of the impact of the algorithm on the distributions, the monitor units derived from AAA
plans were used for the corresponding AXB plans. The plans were not adjusted if the recalculated plans did
not meet the RTOG 0915 recommendations.
Dosimetric parameters evaluation
The prescription dose constraints for treatment planning, which were used by the department and study,
were referenced from the RTOG 0915 protocol. Similarly, the limits for critical OARs were taken with
reference to RTOG 0915.
In this study, the target coverage, CI, GI, mean (Dmean) and maximum (Dmax) dose to the PTV, dose
spillage and volume of lung receiving 5% and 20% of prescribed dose were recorded for comparison. The
PTV coverage was defined by D95%, the dose received by 95% of the PTV.
The CI was defined as the ratio of the total volume receiving at least the prescription dose to the target
volume receiving at least the prescription dose.
The GI was defined as the ratio of the volume of 50% of the prescription isodose to the PTV volume.
A CI closer to 1 indicates better target conformity in the treatment plan, whereas a small value in GI
represents steeper dose fall-off in the treatment plan, which may imply lower doses to the surrounding
normal tissues. The dose spillage is determined using the D2cm, which is defined as the maximum dose, as a
percentage of the prescribed dose, at 2 cm from the PTV in any direction. The volumes of lung receiving
20% of the prescribed dose (V20) and receiving 5% of the prescribed dose (V5) were also used as a
7 | P a g e
Statistical analysis
Normality tests were carried out on the data collected to determine the appropriateness of the
statistical tests for analysis of D95%, CI, GI, D2cm and OAR doses. Statistical analysis was then
performed using SPSS Statistics 20.0 software. The threshold for statistical significance was p < 0.05.
Statistical analysis between the 2 algorithms and 5 treatment techniques was performed using
Mann-Whitney U tests.
Results
In total, 80 plans were produced for 20 patients, with 4 treatment plans for each patient. The average
PTV volume was 40.1 cm3, with the largest being 105.0 cm3 and the smallest being 15.1 cm3. Fifty percent
of the cohort had a lower D95% for the 3DCRT plans after recalculating it with the AXB algorithm, whereas
25% of the cohort achieved the D95% for the VMAT plans after recalculation. The statistical comparisons
between the plans are shown in Tables 1 and 2.
The dosimetric parameters for all the AAA plans met all the criteria as specified by the RTOG 0915
protocol with 1 exception – the 3DCRT plan of 1 patient - in which the border of the heart tissue received a
maximum dose of 100% as a result of its proximity to the PTV.
AAA vs AXB calculation algorithms
When comparing the distributions from the 2 calculation algorithms, the results showed statistically
significant differences for D95%, CI and Dmax. The median D95% for AXB plans, which fell below the
prescribed dose by less than 1%, was approximately 1.2% lower than the median D95% for AAA plans. The
D95% for AXB plans ranged from 44.11 Gy to 49.19 Gy, with 1 PTV receiving a dose that was 8.1% lower
than the prescribed dose. The median CI and median GI for AXB plans were observed to be lower than
AAA plans, the difference in CI between the 2 algorithms being statistically significant (p=0.035).
The maximum PTV doses from AXB were statistically significantly higher than those from AAA
(p=0.021), AXB typically producing values up to 2% higher. Despite the differences observed between the
D95% and the CI, the p-value of both the median GI and the median D2cm was close to 1 (p>0.90), which
8 | P a g e
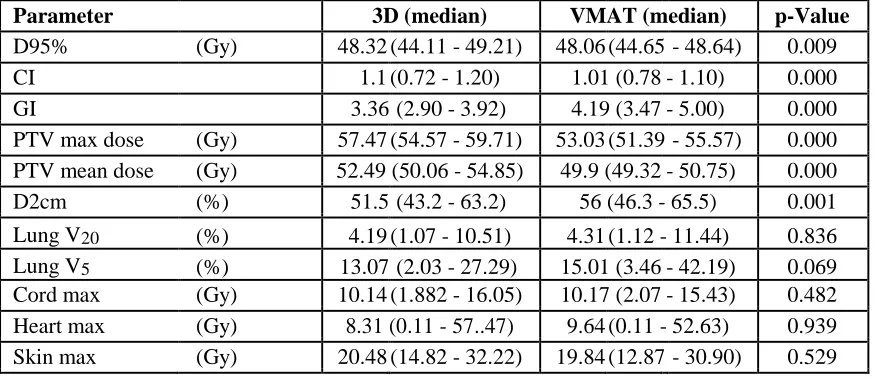
3D vs VMAT treatment plans
With reference to Table 2, the results showed statistically significant differences for D95%, CI, GI,
Dmax, Dmean and D2cm. The D95%, Dmax
,
and Dmean for VMAT plans were lower than 3D CRT plans.For 3DCRT, the median Dmax for all 20 patients to the PTV was 57.47 Gy, whereas in VMAT
plans, the median Dmax received by the PTV was 53.03 Gy. Although the median difference in D95% was
statistically significant, the clinical significance of the magnitude of this difference (less than 0.3 Gy) is
uncertain. By contrast, the recorded D2cm was close to 5% higher for VMAT plans than for 3DCRT. The
median CI for VMAT plans was 1.01, whereas the median CI for 3DCRT plans was 1.1, indicating that
VMAT was able to produce more conformal plans. The GI was 4.19 and 3.36 for the VMAT and 3DCRT
plans respectively, which indicated that the 50% isodose volume in the VMAT plans was larger than in the
3DCRT plans.
Organs at risk (OARs)
The OARs being considered are shown in Tables 1 and 2. From the statistical analysis, there was no
statistical difference (p>0.05 for all OARs) between the doses received by the OARs across calculation
9 | P a g e
Discussion
The aim of this study was to investigate the differences between the dose distributions for peripheral
lobe lung SBRT calculated by 2 algorithms – AAA and AXB, by performing a dosimetric evaluation of the
dose received by 95% of the planning target coverage (PTV), conformity index (CI), GI and doses to the
OARs, defined in RTOG 0915 [13].
There is limitation in current CT technology and image resolution, which can be challenging for the
algorithms to define the exact boundaries of interfaces around the tumor edge. The results from this study
served as a good introduction to the understanding of beam modeling at interfaces. The idea was well
demonstrated in a report published by Failla et al. [5], where differences in algorithm modeling, showed an
improvement in modeling dose at tissue interfaces. However, the study was done in a controlled, simulated
environment with no true representation of the patients’ anatomy in the clinical setting. It is known that
malignant tumors tend to be irregularly shaped, with ill-defined borders. This uncertainty is further
worsened by the presence of motion artifacts, especially when using average intensity projection datasets,
which makes measuring doses at air-tissue interfaces more challenging. To add to the challenge, the
presence of scarred lung tissues and tissue distribution, at some point, adds to the uncertainty in determining
air-tissue interfaces.
Both 3DCRT and VMAT can be used for treatment planning of lung SBRT. The advantages of VMAT
over 3DCRT are faster delivery, which reduces intra-fractional motion, and better target conformity [14].
Statistically significant differences were observed between the dose distributions of 3DCRT and VMAT
plans. This can be attributed to differences in field sizes between 3DCRT and VMAT, given that the beam
energy and datasets used were consistent in this study, as explained by Fogliata et al. [15]. They reported
that results of an algorithm’s calculation are greatly dependent on energy, field size and density of
materials, which supported the results observed in this study. In VMAT planning, small segments were
created to allow fluence modulation for optimizing plan quality but in 3DCRT plans, the fields were created
with a <0.3 cm margin around the PTV, and remained static throughout treatment delivery. It remains a
challenge to correctly predict small field dosimetry behavior by AAA when compared with AXB.
This study also did not show any differences in the GI of the treatment plans regardless of the
calculation algorithm used, which is in general agreement with the results published by Zhang et al. [14].
They generated various plans with different treatment techniques such as 3DCRT, coplanar and
10 | P a g e
significant differences between the 3DCRT and the noncoplanar VMAT plans. Finer segregation of the
subjects being studied by Zhang et al. may lead to different results.
It was also found that the Dmean of the PTV was not statistically significantly different when compared
across the 2 calculation algorithms. This finding was supported by Liu et al. [10] when they performed a
study on 77 patients who underwent SBRT to determine the relationship between tumor volume and
location, and the number of beams used in SBRT calculated using both AXB and AAA calculation
algorithms. The authors concluded that the mean target dose was the same for both algorithms. They found
that there was a small difference in dose distribution in the target between the 2 algorithms, as evident in the
difference in the conformity and heterogeneity index. The difference in conformity between the 2 dose
algorithms was strongly correlated with pulmonary function, target location, and the number of beams used
[10].
Overall, the VMAT plans were observed to be superior to 3DCRT plans, in terms of better dose
conformity and lower Dmax despite having achieved a similar D95%, attributed possibly to the fluence
modulation characteristic of the VMAT technique. Although some reports [14, 16] found that the V20 doses
to the lung were higher or comparable in all the VMAT plans and that VMAT significantly increases the
volume of lung tissues receiving 5% of the prescribed dose (V5) in most treatment plans for lung SBRT, this
was not observed in this study. The numerical values for V20 and V5 are higher in VMAT than in 3DCRT
plans but they are not statistically significant.
In the AXB and AAA algorithms, materials are assigned according to the CT calibration curves in
Eclipse™. The AXB CT calibration curve maps the Hounsfield unit (HU) value of each calculated voxel to
the mass density of the material according to a specific HU range. AAA, on the other hand, assigns a
reference material in each voxel according to the HU. As such, there is a difference in material assignment
between these 2 algorithms. Although this is not reflected in the results in this study, Bush et al. [7] reported
that calculated lung doses are patient-dependent and determined by the actual combination of field sizes,
target location and lung density. Therefore, the type of calculation algorithm used may not be the only factor
in determining underestimation or overestimation of doses to different types of tissues.
In this study, 3DCRT was planned using a coplanar beam arrangement, whereas VMAT was planned
using 3 non-coplanar arcs for each patient. There are studies that show that non-coplanar beam arrangements
for 3D and VMAT can improve PTV coverage and reduce doses to OARs at the same time [17-19]. This
difference was not factored in when analyzing the data and could help to explain the superiority seen in the
11 | P a g e
From the results, it was shown that there was no difference between the doses received by the organs
across treatment techniques and calculation algorithms. With SBRT, the radiation planning margins
accounting for set-up uncertainty are minimized. This allows for greater dose-volume sparing of the
surrounding normal tissues, which enables the delivery of higher fractional doses of radiation
(hypofractionation). The dose gradient is steeper than with conventional radiation, although the low dose
region encompasses a larger volume and is irregularly shaped. A critical review on normal tissue toxicity
after SBRT by Milano et al. further supported that hypofractionated SBRT to peripheral lobe lung tumors
did not lead to severe radiation toxicity to other organs such as the lung, heart, and esophagus because of
the distance relation between the tumor and the healthy organs [20]. Phantom comparisons between AAA
and AXB by Fogliata et al. [15], have compared the doses calculated by the algorithms’ after passing
through materials with lung densities. They found that they were in good agreement in materials
approximating soft tissue at distances greater than 1 to 2 cm beyond the lung for single incident beams.
The results from this study were also supported by Liu et al. [21], who showed that peripheral tumors
are less dense than tumors near the mediastinum and hilum, thus producing less scatter. This may imply that
lesser scatter will lead to lower dose deposition in the tissues around the targets. Although there were
differences in how the 2 calculation algorithms model scatter radiation, there was no significant increase in
the dose received by the OAR when recalculating using AXB because of the lower scatter from peripheral
tumors. The findings are especially relevant to this study as the results generated were based only on patients
with peripheral tumors. AAA simulates lateral density scaling of photon scatter kernels; these scatter kernels
scale the energy at each location by the average density of the material assigned. AXB however, simulates
scattering according to the macroscopic cross-section of the assigned materials in the voxel using their
12 | P a g e
Conclusion
In conclusion, this study showed that there was a statistically significant difference for PTV D95%
across treatment techniques and calculation algorithms, with no statistical differences observed in OAR
doses. The conformity index was statistically significantly different for VMAT plans between the 2
calculation algorithms. These differences observed were largely due to differences in beam modeling by
AAA and AXB at interfaces. Based on this study, VMAT plans were shown to be superior to 3DCRT plans.
This study provided evidence to determine if there is a difference in the quality of plans for lung SBRT
when different calculation algorithms are used. It also has the potential to assist clinicians in their choice of
13 | P a g e
References
1. Singapore Cancer Society. What is lung cancer? Available at:
http://www.singaporecancersociety.org.sg/learn-about-cancer/types-of-cancer/lung-cancer.html. Accessed Apr 25, 2017.
2. Roth JA, Cox, J. D. and Hong, W. K. Lung Cancer. 3rd ed. Massachusetts, USA: Blackwell Publishing Inc. 2011.
3. Khan FMaG, B. J. . Treatment Planning in Radiation Oncology. 3rd ed. London: Lippincott Williams and Wilkins 2012.
4. Court LE, Ching, D., Schofield, D., Czerminska, M. and Allen, A. M. Evaluation of the dose calculation accuracy in intensity modulated radiation therapy for mesothelioma, focusing on low doses to the contralateral lung. Journal of Applied Clinical Medical Physics 2009; 10: 34-42.
5. Failla GA, Wareing, T., Archambault, Y. and Thompson, S. Acuros XB advanced dose calculation for the EclipseTM treatment planning system. Palo Alto, CA: Varian Medical Systems; 2012.
6. Tillikainen L, Helminen, H., Torsti, T., Siljamaki, S., Alakuijala, J., Pyyry, J. and Ulmer, W. A 3D pencil-beam-based superposition algorithm for photon dose calculation in heterogeneous media. Phys Med Biol 2008; 53: 3821-39.
7. Bush K, Gagne, I. M., Zavgorodni, S., Ansbacher, W. and Beckham, W. Dosimetric validation of Acuros XB with Monte Carlo methods for photon dose calculations. Med Phys 2011; 38: 2208-21.
8. Varian Medical Systems I. EclipseTM Algorithm Reference Guide. 2010.
9. Fogliata A, Nicolini, G., Clivio, A., Vanetti, E., and Cozzi, L. Critical appraisal of Acuros XB and Anisotropic Analytic Algorithm dose calculation in advanced non-small-call lung cancer
treatment. International Journal of Radiation Oncology*Biology*Physics 2012; 83: 1587-95.
10. Hong-Wei Liu ZN, Ravinder Clayton, Perter Dunscombe, Harold Lao & Rao Khan. Clinical impact of using the deterministic patient dose calculation algorithm Acuros XB for lung stereotactic body radiation therapy. Acta Oncologica 2014; 53: 324-9.
11. Kathirvel M, Subramanian, S., Clivio, A., Arun, G., Fogliata, A., Nicolini, G., Subramani, V., Swamy, S. T., Vanetti, E. and Cozzi, L. Critical appraisal of the accuracy of Acuros-XB and Anisotropic Analytical Algorithm compared to measurement and calculations with the compass system in the delivery of RapidArc clinical plans. Radiation Oncology 2013; 8.
12. Kroon PS, Hol, S. and Essers, M. . Dosimetric accuracy and clinical quality of Acuros XB and AAA dose calculation algorithm for stereotactic and conventional lung volunmetric modulated arc therapy plans. Radiation Oncology 2013; 8.
13. Gregory M. M. Videtic AKS, Joe Y. Chang, Quynh-Thu Le, William Parker, Kenneth R. Olivier, Steven E. Schild, Chen Hu. RTOG 0915: A Randomized phase II study comparing 2 stereotactic body radiation therapy (SBRT) schedules for medically inoperable patients with Stage I peripheral non-small cell lung cancer. In: RTOG, ed. 2012.
14. Zhang GG, Ku L, Dilling TJ et al. Volumetric modulated arc planning for lung stereotactic body radiotherapy using conventional and unflattened photon beams: a dosimetric comparison with 3D technique. Radiation Oncology 2011; 6: 1-6.
14 | P a g e
16. McGrath SD, Matuszak MM, Yan D et al. Volumetric modulated arc therapy for delivery of hypofractionated stereotactic lung radiotherapy: A dosimetric and treatment efficiency analysis. Radiotherapy and Oncology 2010; 95: 153-7.
17. Granatowicz D, Stathakis S, Gutierrez A, Papanikolaou N. A comparison between
three-dimensional conformal radiotherapy, intensity-modulate radiotherapy and volumetriic-modulated arc therapy techniques for stereotactic body radiotherapy of lung tumors. AAMD 2013.
18. Skórska M, Piotrowski T, Kaźmierska J, Adamska K. A dosimetric comparison of IMRT versus helical tomotherapy for brain tumors. Physica Medica: European Journal of MedicalPhysics 2014; 30: 497-502.
19. Soyfer V, Corn BW, Melamud A et al. Three-Dimensional Non-Coplanar Conformal Radiotherapy Yields Better Results Than Traditional Beam Arrangements for Adjuvant Treatment of Gastric Cancer. International Journal of Radiation Oncology • Biology • Physics 2007; 69: 364-9.
20. Michael T Milano LSC, and Paul Okunieff. Normal tissue toxicity after small field hypofractionated stereotactic body radiation. Radiation Oncology 2008; 3.
15 | P a g e
Figure 1 Typical 3DCRT and VMAT field arrangements used
16 | P a g e
Table 1 & 2 Results
Tables
[image:17.612.35.478.129.319.2]Comparisons using Mann Whitney U Test
Table 1. Dosimetric parameter results comparisons between 2 algorithms
Parameter AAA (median) AXB (median) p-Value
D95% (Gy) 48.28 (48.02 - 49.21) 47.66 (44.11 - 49.19) 0.000
CI 1.07 (0.98 - 1.20) 1.02 (0.72 - 1.20) 0.035
GI 3.65 (3.01 - 4.94) 3.63 (2.90 - 5.00) 0.935
PTV max dose (Gy) 54.61 (51.39 - 59.34) 55.52 (52.44 - 59.71) 0.021 PTV mean dose (Gy) 51.18 (49.2 - 54.85) 50.69 (49.33 - 54.38) 0.322 D2cm (%) 53.00 (45.5 - 65.5) 53.55 (43.2 - 64.8) 0.908
Lung V20 (%) 4.25 (1.07 - 11.38) 4.23 (1.09 - 11.44) 0.923
[image:17.612.35.477.361.552.2]Lung V5 (%) 13.69 (2.07 - 42.05) 13.93 (2.03 - 42.19) 0.859 Cord max (Gy) 10.34 (1.82 - 16.05) 9.93 (1.96 - 16.03) 0.690 Heart max (Gy) 8.25 (0.15 - 57.00) 8.82 (0.11 - 57.47) 0.923 Skin max (Gy) 19.91 (12.87 - 30.46) 20.82 (13.20 - 32.22) 0.795
Table 2. Dosimetric parameter results comparison across 2 treatment techniques
Parameter 3D (median) VMAT (median) p-Value
D95% (Gy) 48.32 (44.11 - 49.21) 48.06 (44.65 - 48.64) 0.009
CI 1.1 (0.72 - 1.20) 1.01 (0.78 - 1.10) 0.000
GI 3.36 (2.90 - 3.92) 4.19 (3.47 - 5.00) 0.000
PTV max dose (Gy) 57.47 (54.57 - 59.71) 53.03 (51.39 - 55.57) 0.000 PTV mean dose (Gy) 52.49 (50.06 - 54.85) 49.9 (49.32 - 50.75) 0.000
D2cm (%) 51.5 (43.2 - 63.2) 56 (46.3 - 65.5) 0.001
Lung V20 (%) 4.19 (1.07 - 10.51) 4.31 (1.12 - 11.44) 0.836
Lung V5 (%) 13.07 (2.03 - 27.29) 15.01 (3.46 - 42.19) 0.069 Cord max (Gy) 10.14 (1.882 - 16.05) 10.17 (2.07 - 15.43) 0.482 Heart max (Gy) 8.31 (0.11 - 57..47) 9.64 (0.11 - 52.63) 0.939