Louisiana State University
LSU Digital Commons
LSU Doctoral Dissertations Graduate School
2015
Selective Enrichment Through Capture (SEC): A
Technology for Retrieving Specific DNA
Sequences from Complex Mixtures
Kelley Gwin NunezLouisiana State University and Agricultural and Mechanical College
Follow this and additional works at:https://digitalcommons.lsu.edu/gradschool_dissertations
This Dissertation is brought to you for free and open access by the Graduate School at LSU Digital Commons. It has been accepted for inclusion in LSU Doctoral Dissertations by an authorized graduate school editor of LSU Digital Commons. For more information, please [email protected].
Recommended Citation
Nunez, Kelley Gwin, "Selective Enrichment Through Capture (SEC): A Technology for Retrieving Specific DNA Sequences from Complex Mixtures" (2015).LSU Doctoral Dissertations. 514.
SELECTIVE ENRICHMENT THROUGH CAPTURE (SEC): A TECHNOLOGY FOR RETREIVING SPECIFIC DNA SEQUENCES FROM COMPLEX MIXTURES
A Dissertation
Submitted to the Graduate Faculty of the Louisiana State University and Agricultural and Mechanical College
in partial fulfillment of the requirements for the degree of
Doctorate of Philosophy in
The Department of Biological Sciences
by Kelley G. Núñez
B.S., Louisiana State University, 2009 December 2015
ACKNOWLEDGEMENTS
I would first like to thank my advisor, Dr. John R. Battista who has guided me in becoming a well-rounded scientist. You have been an excellent mentor and have always been available for discussions. I have learned an enormous amount over the last five years about what it takes to be a scientist and I am extremely grateful for your patience, guidance, and freedom to pursue a wide variety of projects. I would also like to thank Dr. Gregg S. Pettis, Dr. Brent C. Christner, and Dr. James V. Moroney for allowing me to attend your laboratory meetings and your guidance on collaboration projects. I would also like to thank the rest of my graduate committee Dr. Mark Batzer, Dr. Charles Lee, and Dr. J. Cameron Thrash for your feedback and guidance. I would like to thank my former lab members, Kathir Selvam and Jana Duncan for their help during lab meetings. I would also like to thank the undergraduates in the lab, Dieu, Kirstie, Sarah Beth, Trent, and Meredith for allowing me to mentor you on microbiology and life. I want to thank Noelle Bryan who has become a close friend during my time in graduate school. I also want to thank members of Dr. Brent Christner’s laboratory, Amanda Achberger and Shawn Doyle for their helpful feedback and suggestions.
I want to thank Dr. J. Cameron Thrash and Dr. Jeremy Brown for their help with learning bash script, Unix commands, and using LSU’s high performance computing cluster. Part of my research would not be possible without the help of Dr. Jerome La Peyre from the School of Animal Sciences, Scott Herke in the Genomics Facility, and faculty at LSU’s Center for Computation and Technology.
I want to thank my parents for their support over the years and instilling in me the confidence to pursue my dreams. I want to thank my husband’s family for their support. I also want to thank my brother, sister-in-law, and sister for their encouragement and many trips to
Baton Rouge to visit me during stressful times. Finally, I want to sincerely thank my husband Kevin, and my son Keegan. Kevin’s support throughout the years has been critical to my success and I could not have done this without his love, dedication, and calming presence.
This work was supported by the United States Department of Justice, Office of Justice Programs (2010-DN-BX-K190) and National Aeronautics and Space Administration grant (NNX10AN07A).
TABLE OF CONTENTS
ACKNOWLEDGEMENTS ………..ii
ABSTRACT ………...vi
CHAPTER 1. INTRODUCTION ………...1
Streptavidin-Biotin Capture Techniques ……….2
Overview of Selected Enrichment through Capture (SEC) ………...……….3
Microbial Ecology – Determining Microbial Diversity….………..4
Objectives of This Study ………...8
CHAPTER 2. METHODS ……….….9
SEC Capture Primers Design ………...………..………...9
Linear Amplification Reactions ………..…9
Retrieving the Captured Fragments ………..12
The Mock Community ………..13
Quantitative PCR (QPCR) Amplifications ………...13
PCR Amplifications ………..14
Illumina HiSeq 2000 Sequencing ………...16
Trimming of Illumina Datasets ……….17
Read Mapping of Datasets ………....18
Generation of Simulated Datasets ……….18
QIIME and EMIRGE Analyses ….………...18
Statistical Analyses ………...20
Oyster, Sediment, and Seawater Sample Collection ……….21
DNA Extraction of Oysters, Sediment, and Seawater ………..22
The C. reinhardtii Insertion Library ……….23
Characterized C. reinhardtii Insertion Mutants ……….………...24
CHAPTER 3. SELECTED ENRICHMENT THROUGH CAPTURE (SEC): METHOD FOR RETREIVING SINGLE LOCI FROM COMPLEX MIXTURES………25
Introduction ………...25
Results ………...27
Discussion ……….46
CHAPTER 4. DETERMINATION OF THE MICROBIAL DIVERSITY WITHIN THE EASTERN OYSTER, CRASSOSTREA VIRGINIA BEFORE AND AFTER DEPURATION TREATMENT, AND COMPARSION WITH SURROUNDING SEDIMENT AND SEAWATER…….……….54
Introduction ………...54
Results ……….…...58
CHAPTER 5. MICROBIAL DIVERSITY OF BASAL ICE FROM TAYLOR GLACIER
THROUGH SEC CAPTURE OF THE 16S rRNA GENE ……….………..80
Introduction ………...80
Results ………...81
Discussion ………...88
CHAPTER 6. SEC AS A TOOL FOR DETECTING INSERTIONS IN AN INSERTIONAL MUTANT LIBRAY OF CHLAMYODOMAS REINHARDTII ………...93
Introduction ………...93
Results ………...94
Discussion ……….98
CHAPTER 7. CONCLUDING REMARKS AND FUTURE DIRECTIONS..………..101
LITERATURE CITED..……….……….105
APPENDIX TABLE 1 ……….……...119
ABSTRACT
The capacity to selectively target DNA sequences within a complex mixture is a useful feature for genomic studies. Several methods aimed at undertaking this feat have utilized biotinylated oligonucleotides and streptavidin beads to capture DNA but have low efficiencies, require PCR, or cannot be combined with high-throughput sequencing. The work presented here developed a protocol referred to as selected enrichment through capture (SEC) that uses a
biotinylated “capture primer” to target and concentrate specific DNA sequences at high
efficiencies, eliminates the use of PCR, and can be combined with high-throughput sequencing. The effectiveness of SEC was evaluated in a series of studies that determined the
efficiency, specificity, and recovery of specific sequences from DNA mixtures. Initially, it was established that SEC could retrieve a single locus as large as 6,200 bases from 3 ng DNA with high yield. This justified attempts to retrieve 16S rRNA genes from DNA from an artificial mock community and DNA extracted from the environment. Combining SEC with high-throughput sequencing allowed for the identification of all 20 species within an artificial community, reconstruction of full-length 16S rRNA genes, and predictions of relative abundances within an order of magnitude of reported values. SEC successful captured 16S rRNA genes from bacteria from seawater, sediment, and in the over abundances of eukaryotic DNA that facilitated the characterization of the microbiome of the Eastern oyster, C. virginica. SEC was further demonstrated to be successful in recovering 16S rRNA genes from the low biomass environment of glacial basal ice with 21 pg/uL of starting DNA. Additionally, SEC was successful in retrieving insertions in the eukaryote Chlamydomonas reinhardtii.
side of the targeted region needs to be known allowing for adjacent uncharacterized sequence to be recovered. 3) Sequences of interest can be isolated, concentrated, and analyzed without PCR amplification or interference from more abundant DNA found in the sample.
CHAPTER 1. INTRODUCTION
Retrieving specific DNA sequences from complex mixtures offers several advantages. One advantage is to remove targeted DNA from samples that contain contaminants like humic acids. By removing DNA of interest from these substances one can perform downstream
analyses that include PCR (Jacobsen 1995). Another advantage for capturing DNA is the ability to concentrate a targeted sequence of interest. Capturing the DNA will remove the DNA of interest from a larger pool of DNA thereby concentrating the targeted sequence for downstream analysis. This can be particularly useful when targeting a gene present in small amounts
(Jacobsen 1995). Lastly, another advantage in capturing specific DNA sequences is reducing the cost of reagents for downstream analysis. When performing high-throughput sequencing,
capturing specific DNA sequences can reduce sequencing costs and reagents by avoiding the need to sequence entire genomes, instead sequencing only genes of interest (Mertes, Elsharawy et al. 2011).
In order for effective targeted capture of DNA, the method must be specific, efficient, require little input, and be cost effective. While PCR is a suitable method to accomplish this task, several issues limit the use of PCR. PCR requires the use of primers both up and
downstream of the locus of interest. This is particularly important when PCR amplifying the 16S rRNA gene as primer sequences and primer pairs can greatly impact the specificity of
amplification (Klindworth, Pruesse et al. 2013). Additionally, low abundant sequences may be underrepresented (Jumpstart Consortium Human Microbiome Project Data Generation Working 2012) and as a result hinder the efficiency of PCR. Moreover, samples that contain the
advantage of the strong bond between biotin and streptavidin have been used to target and retrieve specific DNA sequences with success.
Streptavidin-Biotin Capture Techniques
Several streptavidin-biotin capture methods have been developed in the last two decades (Tagle, Swaroop et al. 1993, Jacobsen 1995, Sterky, Holmberg et al. 1998, Briggs, Good et al. 2009, Gawronski, Wong et al. 2009). Tagle et al. (1993) used cosmids containing specific DNA sequences as bait. The cosmids were fragmented and linkers were ligated to the ends. cDNA libraries were then added to the biotinylated cosmid library and allowed to hybridize to the biotinylated cosmid fragments. The biotinylated cosmid-cDNA hybrids were then retrieved using streptavidin-coated magnetic beads. The cDNA was eluted using heat and underwent PCR amplification. Jacobsen (1995) used biotinylated primers to capture bacterial DNA as a way to remove the DNA from PCR inhibitory contaminants in environmental samples. Biotinylated probes specific to a single gene were used to saturate the surface of streptavidin-coated beads. Genomic DNA, isolated from soil containing inhibitory humic acids, was fragmented and combined with the biotinylated probe-coated beads. The gene of interest hybridizes to the beads and could be extracted from the humic acid. Sterky et al. (1998) used biotinylated primers to retrieve DNA sequences inserted into bacterial artificial chromosomes (BACs). A biotinylated primer designed to anneal to a known vector sequence within the BACs and the primer was extended into the cloned insert using a DNA polymerase (Sterky, Holmberg et al. 1998). The captured DNA had an average length of 1,000 bases (Sterky, Holmberg et al. 1998). Briggs et al. (2009) combined capture with biotinylated DNA fragments by streptavidin-coated beads with high-throughput sequencing, developing a method called primer extension capture (PEC) to retrieve degraded Neanderthal mitochondrial DNA (mtDNA). A biotinylated primer targeted a
specific DNA region within the mitochondrial genome, and a single linear amplification reaction was performed to extend the biotinylated primer from extensively degraded DNA (Briggs, Good et al. 2009). False priming with extension of the biotinylated primers did occur and multiple PEC reactions were necessary most likely due to low template DNA signal (Briggs, Good et al. 2009).
The methods described above relied either on hybridization of biotinylated
oligonucleotides or extension of biotinylated primers. The drawbacks from each method include multiple subsequent rounds of PCR amplification to determine captured DNA sequence (Tagle, Swaroop et al. 1993, Sterky, Holmberg et al. 1998, Briggs, Good et al. 2009), low efficiency (0.004% ) of captured DNA (Tagle, Swaroop et al. 1993), false capture of non-targeted DNA up to 85% (Tagle, Swaroop et al. 1993, Briggs, Good et al. 2009), and small captured DNA length (Sterky, Holmberg et al. 1998). The shortcomings of these methods were addressed in a new method that took sought out to improve on these limitations.
Overview of Selected Enrichment through Capture (SEC)
A method was developed that utilizes the strong bond between streptavidin and biotin and improves on previously developed streptavidin-biotin methods by providing higher efficiency, and longer captured DNA sequences. SEC is also intended to facilitate in the characterization of bacterial community structure without PCR amplification to avoid the potential biases observed when PCR is used. Like PCR-based amplifications, this method is designed to increase the concentration of 16S rDNA fragments for high-throughput sequencing, but it avoids PCR and relies instead on the complementarity between a biotinylated
oligonucleotide and conserved sequences in the 16S rRNA gene to isolate the sequence. This biotinylated oligonucleotide not only provides specificity, but also acts as a primer for DNA
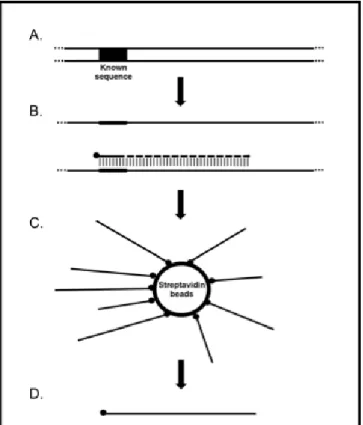
synthesis. DNA isolated from an organism or an environmental sample is annealed to a DNA sequence of interest using a “capture primer”, labeled with a biotin molecule attached at the 5´ end (Figure 1.1). Linear amplification is then performed with Taq DNA polymerase which extends the biotinylated capture primer into the adjacent DNA sequence. The DNA is linearly amplified with the template number doubling for each round of amplification. Following sixty cycles of linear amplification, the entire reaction is added to streptavidin-coated magnetic beads. The biotinylated DNA then binds to the streptavidin on the surface of the magnetic beads that contains the capacity to bind 70 pmols of 4 kilobase biotinylated DNA (KilobaseBINDER™ kit, Life Technologies, Grand Island, NY). A magnet is used to separate the biotinylated DNA-streptavidin beads and the mixture is washed several times to remove the remaining reagents. The biotinylated DNA is then eluted using heat to break the streptavidin-biotin bond.
Microbial Ecology – Determining Microbial Diversity
Microbial ecology is the study of how microorganisms interact with one another and their environment. Many studies of microbial ecology have focused on prokaryotes, Bacteria and Archaea. Prokaryotes are ubiquitously distributed, being found in a wide range of environments from the upper atmosphere to the sub-seafloor (Schippers, Neretin et al. 2005, Smith, Timonen et al. 2013). Prokaryotes are diverse phylogenetically and physiologically, playing vital roles in the geochemical cycling of carbon, nitrogen, oxygen, and other important elements. Microbial ecology describes the diversity of the microorganisms present in an environment; an effort that is complicated by the fact that less than 1% of prokaryotes can be cultured as determined by
differences in counts observed from direct plating on media versus direct microscopic cell counts (Staley and Konopka 1985).
Figure 1.1Overview of Selected Enrichment through Capture (SEC) protocol. A) DNA with a known sequence of interest, B) A biotinylated primer is designed to anneal to the known sequence and linear amplification is performed. The biotinylated primer is extended into the adjacent DNA. C) The reaction is added to streptavidin beads to enrich for the biotinylated DNA. D) The biotinylated DNA is eluted from the streptavidin beads by heating.
The species’ present in a community may also be defined by amplifying part of a single locus, conserved in all bacteria and archaea that acts as a means of defining species, phylogenetic marker genes. In this type of analysis, genomic DNA is isolated from an environmental sample and is PCR amplified with primers specific for part of a phylogenetic marker gene. Base differences in these genes identify different phylogenetic groups. The amplified genes are sequenced to define the diversity of the community, but there are biases inherent to PCR that affect the outcome. PCR can be influenced by inhibitors in a sample, differential amplification, and chimera formation (V. Wintzingerode, Göbel et al. 1997, Haas, Gevers et al. 2011, Schloss, Gevers et al. 2011). Humic acids commonly found in soils inhibit Taq DNA polymerase at
concentrations as low as 0.08 μg/mL (Tebbe and Vahjen 1993). Differential amplification occurs when there are unequal annealing efficiencies between the primers used and the DNA template (Suzuki and Giovannoni 1996). These differences can limit amplification and result in failure to detect organisms present. Chimeras are artifacts that form when two different DNA molecules self-anneal during PCR and replicate creating a product that does not exist. Chimeras are especially problematic when PCR amplifying genes that share multiple conserved regions like the 16S rRNA gene, resulting in overestimates of the true microbial diversity (Wang and Wang 1997, Haas, Gevers et al. 2011).
Organism identification depends on successful amplification of phylogenetic gene
markers. Conserved regions of phylogenetic marker genes, such as the 16S rRNA gene, are used to design primers. These sites are not well conversed in all taxa and can result in poor or unequal amplification (Suzuki and Giovannoni 1996, Jumpstart Consortium Human Microbiome Project Data Generation Working 2012). Primer pair selection can affect the amplification of templates due to the additive effect of biases in each primer to the template (Klindworth, Pruesse et al. 2013). In addition, large differences in guanine and cytosine (GC) content can also alter the success of PCR amplification for GC rich organisms (Aird, Ross et al. 2011). This has been observed during PCR amplification of genomic DNA from both AT and GC rich organisms in preparation for high-throughput sequencing on Illumina platforms (Aird, Ross et al. 2011).
To be useful as a phylogenetic marker gene, a locus must meet the following criteria: be present in all organisms, and be of sufficient length to be statistically significant with slowly and rapidly evolving sections to provide enough differences to distinguish one organism from
another (Woese 1987). The 16S rRNA gene meets all these criteria. It is present in all
evolutionary changes. There are a total of nine variable regions that range in size from 50-100 bases in length (Baker, Smith et al. 2003). The 16S rRNA gene encodes for a ribosomal RNA molecule that, along with 21 proteins, is part of the 30S small subunit of the prokaryotic ribosome (Mizushima and Nomura 1970). This gene was first suggested to be used as a phylogenetic marker gene in 1977 (Woese and Fox 1977) and is still the most commonly used marker today.
The specific protocols used for defining prokaryotic community composition through characterization of the 16S rRNA gene sequence have changed a great deal since 1977, but the overall approach remains the same. Genomic DNA is isolated and the 16S rRNA genes present are enriched in a manner that is compatible with the method used to sequence the DNA. Today, high-throughput sequencing (HTS) using the Illumina platform is emerging as the method of choice for sequencing due to its low cost and high sequencing output (Glenn 2011). The Illumina platform HiSeq 2000 can generate over 50 gigabases of sequencing data per day (Caporaso, Lauber et al. 2012) which enables users to multiplex several projects simultaneously while still generating large amounts of sequencing data for each project. Illumina platforms rely on sequence-by-synthesis technology and developed iTags for amplicon sequencing of the 16S rRNA gene (Degnan and Ochman 2012). iTags are PCR amplified portions of the 16S rRNA gene (Illumina®, San Diego, California). The portions can be either a single or multiple variable regions (~300 bases). The PCR amplified product then undergoes library preparation and
sequencing (Illumina®, San Diego, California).
Different variable regions within the 16S rRNA gene can be sequenced with the region used ranging from 100-400 bases. Amplicon sequencing of the 16S rRNA gene is a convenient means of obtaining a snapshot of the prokaryotic diversity in addition to detecting members of
the “rare biosphere” – organisms present at low abundance that would otherwise be missed when sequencing bulk DNA (Sogin, Morrison et al. 2006). Protocols have been developed for
amplicon sequencing of a single (Caporaso, Lauber et al. 2012) or multiple variable regions of the 16S rRNA gene (Jumpstart Consortium Human Microbiome Project Data Generation Working 2012). However, this approach does have some drawbacks. PCR amplification is a necessary step prior to library preparation and thus, the PCR biases previously mentioned might be introduced. In addition, primer pairs that amplify the 16S rRNA gene can introduce
amplification biases both in the ability to amplify different organisms, i.e. some phyla may be missed (Klindworth, Pruesse et al. 2013) and abundance estimations (Jumpstart Consortium Human Microbiome Project Data Generation Working 2012).
Objectives of This Study
The goal of this study was to develop a method that would selectively capture specific DNA sequences from a complex mixture, providing higher efficiency and longer captured DNA sequences compared to previous biotin-streptavidin capture techniques and eliminate primer pair biases by using a single primer to capture specific loci. The method has been applied to capture the 16S rRNA genes from three microbial communities, an artificial bacterial mock community composed of twenty species (Chapter 3), three marine environmental samples: seawater,
sediment, and the Easter oyster, C. virginica (Chapter 4), and a low biomass metagenome from basal ice of Taylor Glacier in Antarctica (Chapter 5). In addition, in Chapter 6, SEC is used to facilitate the characterization of single insertion mutants in an insertion library of the unicellular alga, Chlamydomonas reinhardtii by capturing DNA adjacent to insertions in an effort to
CHAPTER 2. METHODS
SEC Capture Primers Design
The SEC protocol requires a biotinylated primer and several primers were designed using the software Primer-BLAST (Ye, Coulouris et al. 2012). Table 2.1 lists each primer used in this work. This table includes biotinylated primers designed to capture the gltS and 16S rRNA gene (gltS capture and biotinylated Uni1390R) discussed in Chapters 3, 4, and 5, and the AphVIII
cassette (Gonzalez-Ballester, de Montaigu et al. 2005) described in Chapter 6.
Linear Amplification Reactions
The capture primers initiate the linear amplification reaction. All linear amplification reactions used in this work were combined with AccuTaq™ DNA polymerase (0.05 U/µL, final concentration, Sigma-Aldrich, Saint Louis, MO), extreme thermostable single-stranded binding protein (ET SSB, 4 ng/µL, final concentration, New England Biolabs, Ipswich, MA),
biotinylated capture primer (2 µM, final concentration), and deoxyribonucleotides (dNTPs, 200 µM, final concentration, Sigma-Aldrich, Saint Louis, MO) in a total volume of 50 μL. Each linear amplification reaction was placed in a BioRad C1000 thermal cycler (Bio-Rad
Laboratories, Hercules, CA) programed for (a) 95°C for three minutes, (b) 95°C for forty-five seconds, (c) 60°C for thirty seconds plus an additional fifteen seconds added to every cycle, (d) 72°C for one and a half minutes, with a final extension step at 72°C for five minutes. Steps (b-d) were repeated for sixty times. Because a linear amplification is performed, sixty cycles were used to increase biotinylated product concentration.
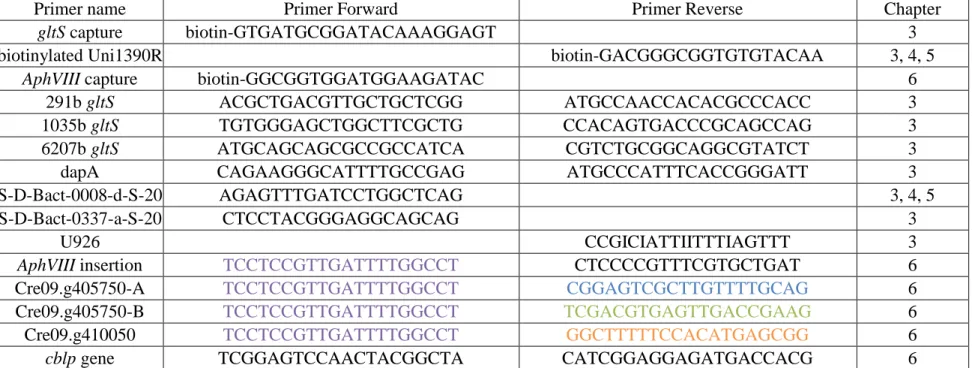
Table 2.1 List of primers used in thesis.
Primer name Primer Forward Primer Reverse Chapter
gltS capture biotin-GTGATGCGGATACAAAGGAGT 3
biotinylated Uni1390R biotin-GACGGGCGGTGTGTACAA 3, 4, 5
AphVIII capture biotin-GGCGGTGGATGGAAGATAC 6
291b gltS ACGCTGACGTTGCTGCTCGG ATGCCAACCACACGCCCACC 3 1035b gltS TGTGGGAGCTGGCTTCGCTG CCACAGTGACCCGCAGCCAG 3 6207b gltS ATGCAGCAGCGCCGCCATCA CGTCTGCGGCAGGCGTATCT 3 dapA CAGAAGGGCATTTTGCCGAG ATGCCCATTTCACCGGGATT 3 S-D-Bact-0008-d-S-20 AGAGTTTGATCCTGGCTCAG 3, 4, 5 S-D-Bact-0337-a-S-20 CTCCTACGGGAGGCAGCAG 3
U926 CCGICIATTIITTTIAGTTT 3
AphVIII insertion TCCTCCGTTGATTTTGGCCT CTCCCCGTTTCGTGCTGAT 6
Cre09.g405750-A TCCTCCGTTGATTTTGGCCT CGGAGTCGCTTGTTTTGCAG 6 Cre09.g405750-B TCCTCCGTTGATTTTGGCCT TCGACGTGAGTTGACCGAAG 6 Cre09.g410050 TCCTCCGTTGATTTTGGCCT GGCTTTTTCCACATGAGCGG 6
cblp gene TCGGAGTCCAACTACGGCTA CATCGGAGGAGATGACCACG 6 Note: Color designations can be found in Chapter 6.
Linear amplification reactions executed in Chapter 5 used an annealing temperature of 53°C instead of 60°C after a PCR temperature gradient was performed using the biotinylated Uni1390R and S-D-Bact-0008-d-S-20 (Table 2.1) revealed the temperature of 53°C gave the best results. Template DNA added for each linear amplification reaction varied based on experiment. Template DNA added for each linear amplification reaction varied from study to study.
Chapter 3: Linear amplification reactions involving the gltS capture primer (Table 2.1) used isolated E. coli genomic DNA (6 ng/µL, final concentration). Capture of the 16S rRNA gene using the biotinylated Uni1390R (Table 2.1) used isolated genomic DNA from the mock community HM-277D (1.1 ng/µL, final concentration). Chapter 4: Though triplicate DNA extractions of oyster, sediment, seawater and depurated oysters were performed, only a single DNA extraction from each sample was used to perform linear amplification reactions with biotinylated Uni1390R. Linear amplification reactions were performed in triplicate on a single DNA extraction from oyster (76 ng/µL, final concentration), sediment (16 ng/µL, final
concentration), seawater (2 ng/µL, final concentration), and depurated oyster (82 ng/µL, final concentration) sample. Chapter 5: A total of five linear amplification reactions were performed using the biotinylated Uni1390R primer (Table 2.1) with isolated genomic DNA from the basal ice of Taylor Glacier at a final concentration of 2.1 pg/µL (105 pg per linear amplification reaction). Chapter 6: Linear amplification reactions were performed using isolated C. reinhardtii
genomic DNA from individual strains or pooled library DNA. The amount of genomic DNA added to each SEC reaction of individual mutants CAH-8A, CAH-8B, and ATPase were 950 ng, 1,232 ng, and 780 ng, respectively. Linear amplification reactions were performed with the addition of genomic DNA at concentrations of 1.6 ng/L for the 180 pool, and 10 ng/L for the 1,440 pool in a 50 L reaction.
Retrieving the Captured Fragments
Dynal M-280 streptavidin-coated magnetic beads (KilobaseBINDER™ kit, Life Technologies, Grand Island, NY) were used to capture the biotinylated DNA created by linear amplification. The protocol followed the manufacturer’s directions with some modifications. The entire 50 µL of the linear amplification reaction was added to the 150 µg of Dynal beads and slowly rotated (6 revolutions per minute) for three hours at 22°C. The Dynal bead-bound
biotinylated DNA was washed five times with the washing solution provided by the manufacturer, followed by two rinses with deionized water (diH2O).
For retrieval of 16S rRNA genes (Chapters 3, 4, and 5), the biotinylated DNA was made double-stranded by combining the bead-bound DNA with 32.6 µL of diH20 supplemented with
AccuTaq™ DNA polymerase (0.05 U/µL, final concentration), ET SSB (4 ng/µL, final
concentration), S-D-Bact-0008-d-S-20 (Table 2.1, 2 µM, final concentration) and dNTPs (200 µM, final concentration) before extension. Extensions were performed in a BioRad C1000 thermal cycler programed for (a) 95°C for three minutes, (b) 60°C for one minute, and (c) 72°C for ten minutes.
For retrieval of biotinylated DNA from a C. reinhardtii insertion mutant (Chapter 6), the biotinylated DNA was combined with 32.6 µL of diH20 supplemented with AccuTaq™ DNA
polymerase (0.05 U/µL, final concentration), ET SSB (4 ng/µL, final concentration), random primers (60 ng/µL, final concentration, Promega, Madison, WI), and dNTPs (200 µM, final concentration) and were placed in a BioRad C1000 thermal cycler programed for (a) 95°C for three minutes, (b) 60°C for one minute, and (c) 72°C for ten minutes.
Post extension, the Dynal beads/biotinylated DNA were transferred to a microcentrifuge tube where beads were subjected to three washes with washing solution and two washes with
diH2O. To elute the double-stranded biotinylated DNA, 20 µL of diH2O was added to the
reaction-bead mixture and heated to 95°C for three minutes. A magnet (MagneSphere®,
Promega, Madison, WI) was used to remove the beads; the supernatant contains double-stranded biotinylated DNA.
The Mock Community
Purified mock community (HM-277D) genomic DNA (56 ng/µL) was obtained from BEI Resources (through the American Type Culture Collection, Bethesda, MD) and used in Chapter 3. This mixture of genomic DNAs includes contributions from 20 bacterial species in varied abundances as will be seen in Chapter 3 in a table and figure. The mock community DNA was stored at -80°C.
Quantitative PCR (QPCR) Amplifications
All QPCR reactions were performed with SYBR® Select Master Mix (Life Technologies, Grand Island, NY) was combined with sample DNA and the forward and reverse primer (0.4 µM, final concentration) for each site. An ABI 7000 PCR system (Life Technologies, Grand Island, NY) was used for each reaction with the following conditions: (a) 95°C for three minutes, (b) 95°C for ten seconds, (c) 60°C for thirty seconds. Steps (b-d) were repeated for forty times. QPCR of gltS gene (Chapter 3): QPCR primers were designed to amplify fragments beginning 63, 1,035, and 6,207 bases downstream of the gltS capture primer-binding site (Table 2.1), producing PCR amplicons of the sizes 247, 151, and 101, respectively. An additional primer set amplified the dapA gene to measure for non-specific carryover of genomic DNA. Standard curves were generated for each primer set using purified E. coli MG1655 genomic DNA at known concentrations from 3-300 ng/μL. QPCR on C. reinhardtii loci (Chapter 6): Two primer sets were designed within C. reinhardtii, oneto amplify a single insertion in the gene
Cre09.g410050 and another to amplifyusing the cblp gene (g6364) (Table 2.1). Both primer sets were designed using Primer- BLAST (Ye, Coulouris et al. 2012) and produced PCR products less than 250bp in length listed in Table 2.1. Standard curves were generated using purified wild type C. reinhardtii genomic DNA.
PCR Amplifications PCR of 16S rRNA Gene V3-V5 Variable Regions (Chapter 3):
The PCR was performed on genomic DNA from the HM-277D mock community that amplified the V3-V5 regions of the 16S rRNA gene. Genomic DNA from the MC (0.8 ng/µL, final concentration), AccuTaq™ DNA polymerase (0.05 U/µL, final concentration),
S-D-Bact-0337-a-S-20 (0.4 µM, final concentration), U926 (0.4 µM, final concentration), ET SSB (4 ng/µL, final concentration), and dNTPs (200 µM, final concentration) were combined in 50 µL reactions. PCR was performed using a Bio-Rad C1000 thermal cycler programed as follows: (a) 95°C for three minutes, (b) 95°C for forty-five seconds, (c) 60 °C for thirty seconds, (d) 72°C for forty-five seconds, and a final extension step (3) 72°C for five minutes. Steps (b-d) were
repeated thirty-five times. The PCR product was cleaned using Geneclean® Spin Kit (MP Biomedicals, Santa Ana, CA). The purified product was sequenced using an Illumina HiSeq 2000 platform.
PCR on SEC Captured DNA from Individual C. reinhardtii Mutants (Chapter 6):
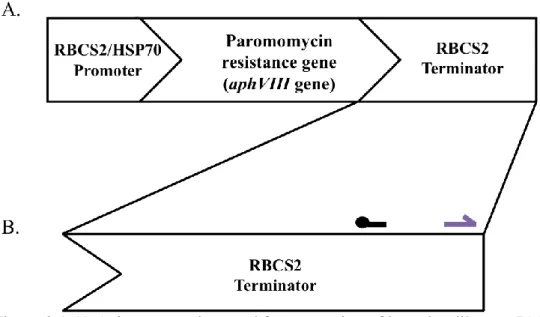
A single primer was designed to anneal 56 bases upstream of the 3´ end of the insertion for each allele (Table 2.1 and Figure 2.1). Primers were also designed to specifically to amplify downstream of the insertions in Cre09.g405750 and Cre09.g410050 (Table 2.1, Figure 2.2). Post SEC, these primers were used to confirm SEC captured DNA adjacent to each insertion. The biotinylated DNA was combined with a hot start AccuTaq™ DNA polymerase (0.05 U/L, final
concentration), insertion forward primer (400 nM, final concentration), mutant primer (400 nM, final concentration), and dNTPs (200 µM, final concentration) in a total volume of 50 μL. A BioRad C1000 thermal cycler was used and programed for: (a) 95˚C for three minutes, (b) 95˚C for forty-five seconds, (c) 60º for thirty seconds, (d) 72˚C for forty-five seconds, and a final extension step (3) 72˚C for five minutes. The cycle (b-d) was repeated for forty times.
Figure 2.1 A) AphVIII insertion used for generation of insertion library. B) Primer locations for SEC, PCR, and quantitative PCR. Black line indicates location of the biotinylated capture primer located 180 bases from the end of the RBCS2 terminator sequence. Purple arrow indicates primer designed 56 bases from end of AphVIII geneinsertion called the insertion forward primer. Color designations for primers are same as found in Table 2.1
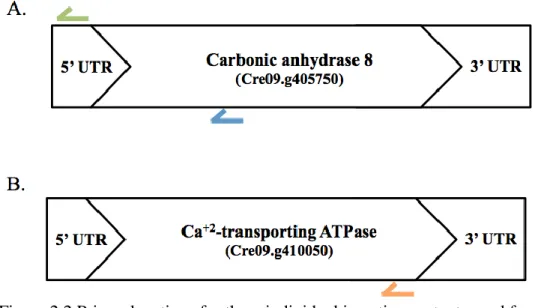
Figure 2.2 Primer locations for three individual insertion mutants used for detection of SEC capture using PCR and quantitative PCR. A) Primer locations for CAH8 insertions mutants. Blue arrow indicates location of the reverse primer for CAH8-A insertion mutant and green arrow the reverse primer for CAH8-B insertion mutant. B) Reverse primer location for ATPase insertion mutant located by orange arrow. Color designations for primers are same as found in Table 2.1
Illumina HiSeq 2000 Sequencing
Chapter 3: Biotinylated DNA obtained from SEC capture of the mock community (SEC-MC) and PCR amplification of V3-V5 regions of the 16S rRNA genes from the mock
community (PCR-MC) were sequenced using 1/3 of a lane each on an Illumina HiSeq 2000 with 100 cycles, paired-end sequencing. The initial DNA concentration for the SEC-MC and PCR-MC was 0.41 ng/µL and 8.9 ng/µL, respectively. The University of Minnesota Genomics Center was contracted to create the library preparations using a TruSeq ChIP DNA kit (Illumina, Inc., San Diego, CA). Libraries were fragmented to ~270 base pairs and post-fragmentation size selection concentrations were 8.1 ng/µL and 63.5 ng/µL, respectively as determined by Agilent High Sensitivity DNA Kit (Agilent Technologies, Santa Clara, CA). Chapter 4: Post SEC, the triplicate SEC reactions from each sample (oyster, sediment, seawater, and depurated oyster)
Oyster, SEC-Sediment, SEC-Seawater, and SEC-DepuratedOyster. DNA concentrations for each were as follows: SEC-Oyster 0.3 ng/µL, SEC-Sediment 0.2 ng/µL, SEC-Seawater 0.1 ng/µL, and SEC-DepuratedOyster 0.2 ng/µL. The University of Georgia performed library preparation using Nextera XT DNA Library Prep kit. Libraries were fragmented to ~250 base pairs and size selection was performed with a DN-486 High Sensitivity NGS Fragment Analysis Kit. DNA library concentrations post-size selections were as follows: SEC-Oyster 2.9 ng/µL, SEC-Sediment 4.3 ng/µL, SEC-Seawater 4.3 ng/µL, and SEC-DepuratedOyster 3.9 ng/µL. Libraries were paired-end sequenced for 100 cycles and sequenced on a single lane on an
Illumina HiSeq 2000. Chapter 5: All five SEC reactions were combined together prior to library construction to increase the DNA concentration, now designated SEC-TG. The initial DNA concentration for the SEC-TG was 0.1 ng/µL. Library preparation and DNA sequencing was performed by the University of Wisconsin-Madison Biotechnology Center using Illumina’s ChIP Sample Prep kit (Illumina, Inc., San Diego, CA) and Illumina HiSeq 2000 v1.5. Libraries were fragmented to ~150 base pairs using a Bioruptor® (12 minutes-15 seconds on, 15 seconds off). Post-fragmentation, size selection was performed by agarose gel electrophoresis. DNA library concentration post-size selection was 2.3 ng/µL.
Trimming of Illumina Datasets
All Illumina datasets were trimmed using the bioinformatic software CLC Genomics Workbench version 6.0.4. The following trimming parameters were applied: quality score limit of 0.05, and no ambiguous base. Sequence read lengths below 95 (Chapters 4 and 6), 90
Read Mapping of Datasets
In Chapter 3, SEC-MC and PCR-MC datasets were mapped to the 16S rRNA gene sequences of each bacterial strain from the HM-277D mock community using CLC Genomics Workbench version 6.0.4. To obtain sequence reads that were specific to each species, the following parameters were used: length fraction of 0.97, similarity fraction of 0.97, mismatch cost of 2, insertion cost of 3, deletion cost of 3, non-specific matches were ignored. Under these parameters, mapped sequence reads were considered species-specific. Additional relaxed read mappings were done with the same parameters with the exceptions of length of fraction and similarity fraction set at 0.80. Relaxed read mapping parameters were performed to account for sequence reads that were not species-specific.
Generation of Simulated Datasets
In Chapter 3, the program EMIRGE was tested with datasets that contained sequence reads mapping to only 16S rRNA gene sequences like those generated following SEC.
Simulated datasets were generated composed of random 100 bases, error-free sequence reads of reference 16S rRNA genes from the 20 organisms found in the HM-277D using the program
wgsim (Li, Handsaker et al. 2009). Only one 16S rRNA gene from each organism was used to generate the simulated datasets regardless of 16S rRNA gene copy number in their respective genomes. Multiple simulated datasets were generated that varied in total number of sequence reads and number of sequence reads per 16S rRNA gene from organisms.
QIIME and EMIRGE Analysis
The QIIME (Quantitative Insights Into Microbial Ecology) pipeline combines multiple programs together for analyzing large datasets specific to microbial ecology (Caporaso, Kuczynski et al. 2010) and was used to V4 iTags in Chapter 5.
All QIIME analysis provided in this thesis was completed using the de novo OTU
picking method (pick_de_novo_otus.py) based on the accuracy when tested with simulated data. The workflow for de novo OTU picking is broken down into four stages: (i) sequence reads are clustered into operational taxonomic units (OTUs) using the program UCLUST. OTUs are a way to assess microbial diversity, by clustering 16S rRNA gene sequences that share a given percentage similarity. (ii) A representative sequence from each OTU cluster is chosen based on the centroid sequence, the sequence present in the highest abundance in the cluster, (iii) the representative sequences are then aligned using the tool PyNAST (Caporaso, Bittinger et al. 2010), (iv) taxonomy is assigned to representative sequences using UCLUST, (v) alignment files are filtered and (vi) a phylogenetic tree is built using the program FastTree (Price, Dehal et al. 2010). An additional step of using the Ribosomal Database Project to assign taxonomy to representative OTUs using the naïve Bayesian classifier is also performed (Wang, Garrity et al. 2007). The output of QIIME’s de novo OTU picking workflow results in the identification of OTUs for microbial diversity inferences. QIIME workflows were designed for high-throughput amplicon sequencing of the 16S rRNA gene. QIIME analyses were performed on a high
performance-computing cluster on a single node with four processors.
Another program used in this thesis, Expectation Maximization Iterative Reconstruction of Genes from the Environment (EMIRGE) is designed to reconstruct full-length 16S rRNA gene sequences from high-throughput datasets (Miller, Baker et al. 2011). EMIRGE uses the expectation maximization algorithm and through iterative cycles, attempts to recreate full-length 16S rRNA gene sequences from short sequence reads. For each iteration, EMIRGE performs the following functions: (i) sequence reads are mapped to a reference database, (ii) the probability that the reference sequence generated a sequence read is calculated, (iii) the abundance of that
reference is calculated, and (iv) the reference sequence is corrected by the bases in reads that have the highest probability (Miller, Baker et al. 2011). These steps are repeated over 40 iterations and gradually the reference sequences are corrected with the sequence reads and their abundances are determined by the number of sequence reads attributing to the assembled sequence. EMIRGE requires input datasets to be in fastq format to account for any sequencing errors in the dataset.
Due to computational limitations, all datasets were subsampled with a custom script (fastq_random_subset.py) (Miller 2013) for analysis using EMIRGE. All datasets analyzed with EMIRGE used the emirge_amplicon.py script with default parameters and a maximum read length of 101 bases. All analyses (Chapters 3, 4, and 5) were performed on a high performance-computing cluster with a large memory capacity of 1 TB on a single node with either 10 or 20 processors. The assembled sequences generated by EMIRGE were used to query the Silva database (SSU_NR_111) using BLAST v.2.2.28. The top hits from BLAST based on bit-scores were chosen to distinguish the taxonomic classification of each assembled sequence output from EMIRGE.
Both programs are designed to analyze HTS datasets to provide taxonomic classification of bacteria whether from PCR amplicon 16S rRNA sequencing datasets (QIIME), or
metagenomic datasets (EMIRGE) to determine bacterial diversity.
Statistical Analyses
Statistical analyses in this thesis were performed using the StatPlus:mac statistical analysis software (AnalystSoft Inc, Alexandria, VA). In Chapter 3, F-test was used to test for equal variances for the mean copy number of retrieved molecules at Sites 1, 2, and 3 to the mean copy number of dapA gene controls. Student’s t-test was used compare the mean copy number
of retrieved molecules at Sites 1, 2, and 3 to the mean of the dapA gene controls. If variances were unequal, a heteroscedastic Student’s t-test was performed.
Oyster, Sediment, and Seawater Sample Collection
In Chapter 4, oyster, sediment, and seawater samples were collected from the Louisiana Sea Grant Oyster Hatchery in Grand Isle, Louisiana on July 15, 2013. An overview of the experimental scheme is provided in Figure 2.3. Sixteen oysters were collected from a single oyster cage located approximately 50 feet from shore. Oysters were placed in burlap bags and kept out of sunlight during transport to Louisiana State University for processing.
Approximately 7 hours later, the outside of each oyster shell was scrubbed using wire brushes to remove excess sediment and rinsed with 70% ethanol. Eight oysters were placed in a depuration tank with salinity at 20 parts per thousand (ppt) for seven days. Sediment samples were
collected in triplicate next to the oyster cage using a dredge (Wildlife Supply Company model number 146-B12-1096). Approximately 50 grams of sediment was transferred in separate sterile conical tubes in triplicate. The samples were stored at room temperature out of sunlight and transported back to Louisiana State University for DNA extractions. Seawater was collected (approximately 800 mL) within six inches of the oyster cage by submersion of an autoclaved 1-liter bottle then opening bottle to fill approximately 800 mL at a depth of 2 feet from the surface. Bottles were then wrapped, kept at room temperature, and transported back to Louisiana State University for filtration and DNA extractions. Salinity and water temperature was measured using a YSI Model 85 less than one foot away from the oyster cages and was 20.2 ppt and 30.1 °C.
Figure 2.3 Overview of experimental scheme of sample collection.
DNA Extraction of Oysters, Sediment, and Seawater
In Chapter 4, seven hours post –harvest, three oysters were chosen from the burlap bag and washed with 70% ethanol to remove any contaminating organisms present on the outside of the shells. The oysters were then shucked using a sterile shucking knife. Each oyster was left intact and placed in a sterile 50 mL conical tube and weighed. The average mass of the oysters was 10.6 ± 2.7 grams. Individual oysters were homogenized separately using a handheld tissue homogenizer with equal volumes of PBS (w/v). DNA extractions on each homogenized oyster was performed in triplicate using PowerSoil® DNA Isolation Kit (MO BIO, Carlsbad, CA) with the addition of 250 μL of whole oyster homogenate. DNA was extracted from each triplicate sediment sample by combining five grams of sediment with equal volumes of PBS (w/v) and agitated using a vortex mixer for five minutes. DNA extractions were performed in triplicate for
each sediment sample by adding 200 μL of mixture to PowerSoil® DNA Isolation Kit. Twenty-four hours post-collection, 100 mL of collected seawater was filtered using a 0.22 μm
polycarbonate filter (diameter 47 mm, Sterlitech, catalog number PCTF0247100) in triplicate. Each filter was cut in half with one half being placed in PBS and agitated using a vortex mixer to remove cells from the filter surface. The remaining half of the filter was further cut into thirds and underwent DNA extraction. Each filter was cut in half using a sterile scalpel. Half of filter was cut into thirds and DNA was extracted from approximately 16.6 mL of seawater using the PowerSoil® DNA Isolation Kit.
Eight oysters were placed in a depuration tank. This tank held 400 liters of artificial seawater that circulated through a 10 μm and 2 μm and was then UV sterilized. The depuration tank water had a salinity of 20 ppt. After seven days in this tank, three depurated oysters were chosen and rinsed with 70% ethanol. Depurated oysters were shucked and weighed with an average mass of 10.4 ± 4.0 grams. Three depurated oysters were separately homogenized in equal volumes of PBS (w/v). DNA extractions for each homogenized depurated oyster was performed in triplicate by adding 250 μL of whole oyster homogenate to the PowerSoil® DNA Isolation Kit.
The C. reinhardtii Insertion Library
The C. reinhardtii insertion library was generously provided by the laboratory of James V. Moroney (Department of Biological Sciences, Louisiana State University) in Chapter 6. This library contains 32,000 single colony isolates that were isolated in the presence of paromomycin on tris-acetate-phosphate (TAP) plates; each plate containing 180 isolates. The Moroney
laboratory performed all genomic DNA extractions from the insertion library. Genomic DNA extracted from a single TAP plate is referred to as a “180 pool”. Genomic DNA extracted from
eight individual TAP plates is termed a “1,440 pool”, and contained genomic DNA from 1,440 single colony isolates.
Characterized C. reinhardtii Insertion Mutants
The Moroney laboratory also provided genomic DNA from three well-characterized insertion mutants for Chapter 6. Two of the three individual mutants contained a single insertion into the carbonic anhydrase 8 gene (CAH8, Cre09.g405750); in strain CAH8-A, the insertion is located in the first intron of CAH8 gene, in strain CAH8-B, the insertion is located in the 5´ untranslated region (UTR) of CAH8. The third mutant carries an insertion located in the last exon of Cre09.g410050, a Ca+2-transporting ATPase gene.
CHAPTER 3.
SELECTED ENRICHMENT THROUGH CAPTURE (SEC): METHOD FOR RETREIVING SINGLE LOCI FROM COMPLEX MIXTURES
Introduction
Selectively sequencing the 16S rRNA genes isolated from bacterial metagenomes is an experimental approach routinely implemented when defining diversity in environmental samples. The success of this approach, as defined by the ability to thoroughly characterize a bacterial community, has improved with advancements in high-throughput sequencing technologies compared to Sanger sequencing (Shendure and Ji 2008). An experimental paradigm currently employed utilizes a set of primers that anneal to conserved regions of the 16S rRNA gene that are used to amplify variable regions within the loci (Sogin, Morrison et al. 2006, Caporaso, Lauber et al. 2012, Lie, Liu et al. 2014). The resulting fragments are directly sequenced (Sogin, Morrison et al. 2006, Degnan and Ochman 2012), and various analyses are conducted to
reconstruct community phylogeny. Assuming that individual 16S rRNA genes are amplified with equivalent efficiencies, direct sequencing at sufficient depth offers the promise of defining the individual members of the community. Unfortunately, these approaches are potentially biased because they rely on PCR amplification and as discussed in Chapter 1, there are a number of PCR-based artifacts that can confuse the interpretation of microbial community structures built around such data (Jumpstart Consortium Human Microbiome Project Data Generation Working 2012, Lee, Herbold et al. 2012, He, Zhou et al. 2013).
In addition to PCR biases, the length of amplified 16S rRNA gene can impact both the species richness and evenness (Youssef, Sheik et al. 2009, Jumpstart Consortium Human Microbiome Project Data Generation Working 2012, Yarza, Yilmaz et al. 2014). Individual variable regions of the 16S rRNA gene, such as V1, V2, and V6 can overestimate the number of
species present in a given sample while V4 and V7 underestimate the number of species (Youssef, Sheik et al. 2009). Analysis of species level diversity of each individual variable regions V2-V6 were shown to underestimate species richness when compared to full-length 16S rRNA gene sequences, while V1 overestimated the number of species (Yarza, Yilmaz et al. 2014). Multiple variable regions also negatively impact the accurate descriptions of the microbial community. Variable regions V3-V5 were shown to be more accurate in defining a simple mock community when compared to V1-V3 and V6-V9, however V3-V5 still under- and overestimated species evenness when compared to full-length 16S rRNA gene sequences
(Jumpstart Consortium Human Microbiome Project Data Generation Working 2012). With this work, an attempt is made to develop a method that limits PCR bias and retrieves full-length 16S rRNA genes to provide a better description of a microbial community versus PCR amplification of V3-V5. The method termed Selective Enrichment through Capture (SEC) utilizes biotinylated primers to retrieve specific DNA sequences from mixtures of DNA. Once isolated, this sequence is repeatedly copied using a single primer and a thermostable DNA polymerase, amplifying the captured sequence by creating a large number of single-stranded DNA fragments. While the technique requires primer binding and extension by a polymerase, it is not a polymerase chain reaction as the two primers are not used simultaneously. Replicating the sequence in this manner should limit the impact of some PCR biases, particularly
amplification biases caused by primer pair-template mismatches and abundance estimation that can affect assessing community composition (Jumpstart Consortium Human Microbiome Project Data Generation Working 2012, Klindworth, Pruesse et al. 2013). The technique provides additional copies of the targeted sequence through linear amplification for downstream applications.
This chapter documents the efficiency of SEC in retrieving a targeted locus from within a single genome, demonstrating the technique is capable of recovering the entire gene of interest, and as much as 5,000 bases of adjacent sequence as well. In addition, SEC is successfully used to target the 16S rRNA gene of 20 bacteria found in an artificially generated mock community. The capture primer was designed to anneal to an 18 base pair sequence conserved within this group of bacteria. Recovered DNA fragments were subjected to high-throughput sequencing and analysis of the resulting dataset identified all twenty bacteria. In addition, relative abundances of this mock community were recreated within an order of magnitude establishing the potential utility of SEC in characterizing bacterial community structure.
Results SEC Retrieval of a Single Locus
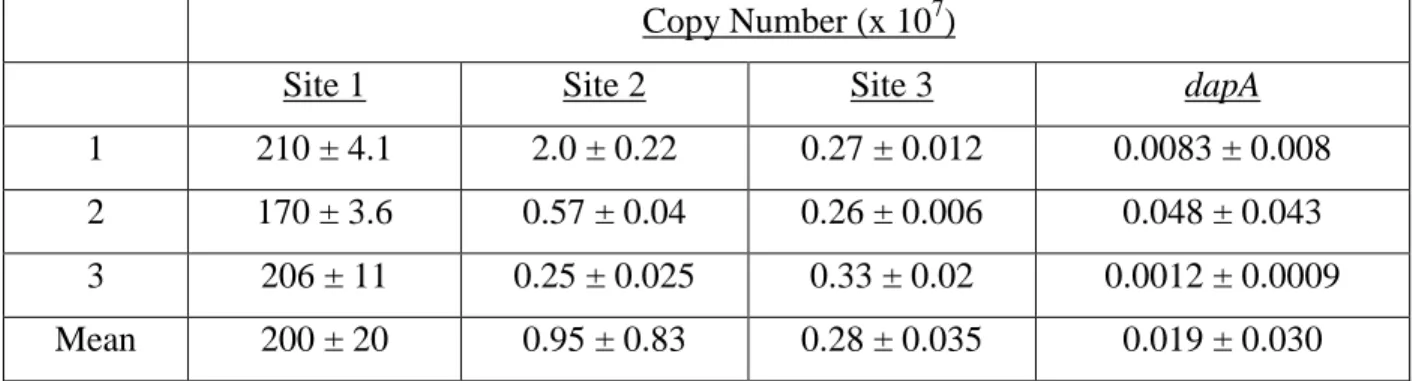
Initially an attempt was made to use SEC to recover a single locus from within that organism’s genome. For these studies, the gltS gene of E. coli MG1655 was targeted. This 1,206 base pair (bp) gene (map position 3,825,483 3,826,688) encodes a sodium-dependent glutamate transporter (Kalman, Gentry et al. 1991). The gltS gene represents approximately 1/3700th of the genome, and is present at one copy per genome making it straightforward to quantify capture of this gene. Purified genomic DNA was mixed with a capture primer (Table 2.1) that annealed 25 bases upstream of the start site of the gltS gene. Quantitative PCR (QPCR) was used to monitor the effectiveness of the SEC protocol. Primers were designed to amplify fragments beginning 63, 1,035, and 6,207 bases downstream of the gltS capture primer-binding site and were designated as Site 1, 2, and 3, respectively (Table 3.1). These primers produced PCR amplicons of 247, 151, and 101 base pairs that were quantified. The gene was first targeted in 300 ng of genomic DNA. Assuming the DNA was composed of full-length genome
molecules (4.46 x 10⁶ bp long), 300 ng corresponds to 6 x 10⁷ genome copies available for capture. Table 3.1 reports the results of three independent SEC trials. Recovery was estimated at 2 x 10⁹gltS copies when fragments generated from primers amplifying Site 1 were evaluated, approximating the theoretical maximum of 3.6 x 10⁹ copies available. (The maximum value was calculated by assuming that all 6 x 10⁷ genome copies were linearly amplified for 60 cycles during the SEC protocol – each gltS copy increasing to two after a round of linear amplification.) 1 x 10⁷ copies were recovered from Site 2, indicating an approximate 100-fold reduced
efficiency of recovery with the 970 base pair increase in size of the captured fragment. SEC products were PCR amplified and subjected to Sanger sequencing. Results confirmed the amplified fragment sequences were identical to those reported for the corresponding regions of theMG1655 gltS coding sequence.
Table 3.1Recovery of the gltS gene from genomic DNA using SEC, as calculated from QPCR. Copy Number (x 107)
Site 1 Site 2 Site 3 dapA
1 210 ± 4.1 2.0 ± 0.22 0.27 ± 0.012 0.0083 ± 0.008 2 170 ± 3.6 0.57 ± 0.04 0.26 ± 0.006 0.048 ± 0.043 3 206 ± 11 0.25 ± 0.025 0.33 ± 0.02 0.0012 ± 0.0009 Mean 200 ± 20 0.95 ± 0.83 0.28 ± 0.035 0.019 ± 0.030 Note: Values in rows 1-3 are the mean copy number ± standard deviation of triplicate measurements. Values in the row labeled “Mean” are the averages of the copy numbers calculated for each site during the three independent trials performed in triplicate ± standard deviation.
Since the length of the captured fragment is only limited by the length of the template and the processivity of the DNA polymerase – the speed at which nucleotides are incorporated on the newly synthesized strand during DNA synthesis (Kelman, Hurwitz et al. 1998) – a third primer set was designed to detect and enumerate recovered sequences that included a site 5,000 bases
downstream of the gltS termination codon (Site 3). This site was detected at levels
approximately five-fold lower than what was observed at Site 2. This result suggests that SEC can be used to recover at least 6,200 bases of sequence adjacent to a capture primer, but indicates lower efficiencies as product length increases.
There is the possibility that a non-specific transfer of genomic DNA during SEC explains the results provided in Table 3.1. In sufficient quantity, genomic DNA would serve as a
template for the QPCR reaction used to detect sequences recovered following SEC. To rule out this circumstance, primers specific for amplification of a sequence within the dapA gene of MG1655 (map position: 2,596,904 2,597,782) were used to estimate carryover of genomic DNA during the SEC protocol (Table 3.1). The dapA locus was chosen because it is located 1.2 million bases from the gltS gene and should not be captured during SEC targeting of gltS. On average, approximately 2% of the total number of molecules recovered at Sites 1, 2, and 3 could be identified as the dapA gene (Table 3.1). The numbers of gltS-specific sequences detected were significantly greater(P < 0.05, Student’s t-test) than the dapA gene controls from all three sites (Site 1, 2, and 3), eliminating concern of non-specific carryover of genomic DNA affecting the outcome of the analysis.
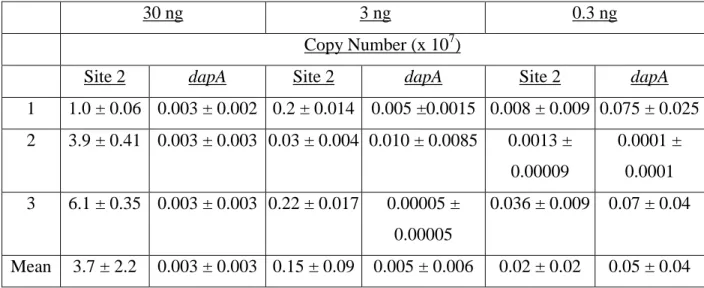
Table 3.2 describes the effect of reduced concentrations of genomic DNA on fragment recovery during the SEC protocol. E. coli MG1655 genomic DNA was serially diluted to reduce the gltS copy number in the sample reaction. Following SEC, QPCR was performed with
primers that amplify 1,035 bases from the capture primer-binding site (Site 2) to estimate the quantities of gltS-specific fragments recovered. When 30 ng (6 x 10⁶ genome copies) of
genomic DNA is used, the protocol is as effective as was observed when using 300 ng DNA; the estimated numbers of recovered target DNA were near the theoretical maximum possible and
were significantly greater (P < 0.05, Student’s t-test) than the number of copies of dapA gene detected for all three trials. When copy number was lowered to 6 x 10⁵ genomes (equivalent to 3 ng), the reduction of starting material resulted in lower recoveries and greater variability in the amounts of biotinylated product recovered, as evidenced by the lower recovery in trial 2 relative to trails 1 and 3. However, the number of recovered gltS-specific fragments was significantly greater (P < 0.05, student’s t-test) than the dapA gene in all three trials. When the number of genome copies used in the reaction was reduced another ten-fold further (300 pg, 6 x 10⁴ genome copies), SEC was unable to reproducibly capture fragments in quantities that clearly distinguish the values obtained from possible carryover.
Table 3.2The effect of reduced DNA concentrations of the effectiveness of SEC, as calculated from QPCR.
30 ng 3 ng 0.3 ng
Copy Number (x 107)
Site 2 dapA Site 2 dapA Site 2 dapA
1 1.0 ± 0.06 0.003 ± 0.002 0.2 ± 0.014 0.005 ±0.0015 0.008 ± 0.009 0.075 ± 0.025 2 3.9 ± 0.41 0.003 ± 0.003 0.03 ± 0.004 0.010 ± 0.0085 0.0013 ± 0.00009 0.0001 ± 0.0001 3 6.1 ± 0.35 0.003 ± 0.003 0.22 ± 0.017 0.00005 ± 0.00005 0.036 ± 0.009 0.07 ± 0.04 Mean 3.7 ± 2.2 0.003 ± 0.003 0.15 ± 0.09 0.005 ± 0.006 0.02 ± 0.02 0.05 ± 0.04 Note: Values in rows 1-3 are the mean copy number ± standard deviation of triplicate
measurements. Values in the row labeled “Mean” are the averages of the copy numbers calculated for each site during the three independent trials performed in triplicate ± standard deviation.
The observations summarized in Tables 3.1 and 3.2 indicate that SEC facilitates the recovery of millions of copies of the targeted biotinylated product, and that fragments as large as 6,200 bp may be recovered with high efficiency. Clearly, if one is tasked with recovering a
single locus and/or sequence downstream of that locus, SEC offers an effective means of accomplishing this task.
Combining SEC and High-Throughput Sequencing
The success of retrieving a single locus with SEC led to the question: can multiple distinct but related sequences be captured from a mixture of genomic DNAs using the same biotinylated primer? To answer this question, an attempt was made to use SEC to retrieve 16S rRNA genes from a mock community.
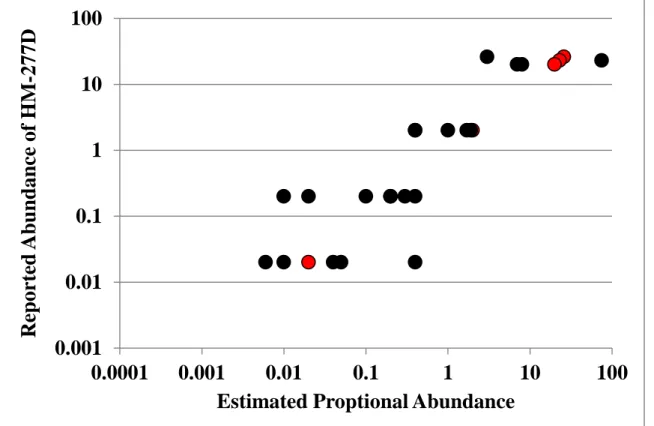
The mock community, HM-277D (BEI Resources, ATCC, Bethesda, MD), is composed of 20 bacterial species. The relative abundance of genomic DNA from individual species within this mock community varies by as much as four orders of magnitude (Figure 3.1). A capture primer targeting near the 3´ end of the 16S rRNA gene was used to initiate SEC protocol. That primer replicates the sequence S-*-Univ-1390-a-A-18 (Uni1390R), an 18 base reverse primer targeting position 1407 1390 of the 16S rRNA gene of E. coli (Klindworth et al. 2013), differing only in that the 5´ end of Uni1390R is labeled with a biotin molecule
(Table 2.1). The biotinylated Uni1390R perfectly complements the targeted region in 19 of the 20 bacteria included in HM-277D. There is a one base mismatch 12 bases from the 3´ end of this primer within the targeted region of the Helicobacter pylori 16S rRNA gene (Appendix Table 1). Following capture, the recovered fragments were made double-stranded using the primer S-D-Bact-008-dS-20 (Table 2.1) that is specific for a conserved sequence at the 5´ end of the 16S rRNA gene of the bacteria found in HM-277D.
The recovered fragments were directly sequenced using the Illumina HiSeq 2000 platform. Sequencing generated 110,986,206 raw paired-end reads, 101 bases in length. Raw sequence data were trimmed using the bioinformatic software package CLC Genomics
Workbench (CLC bio, Boston, MA), generating high quality score sequence reads for mapping. Post-trimming, this dataset consisted of 102,252,558 reads; this trimmed dataset is referred to here as SEC-MC, reflecting the use of SEC to characterize the mock community.
Species-specific reads from SEC-MC were mapped to the individual 16S rRNA genes using CLC Genomics Workbench (CLC) (Table 3.3). Since the number of single nucleotide polymorphisms between redundant 16S rRNA genes of species in HM-277D were not greater than 1% of the total number of bases in the gene, the sequence of a single 16S rRNA gene from each bacterium was used to represent that organism during mapping. Sequence reads were mapped to the individual 16S rRNA genes.
Figure 3.1 Reported and SEC-MC derived abundances of organisms within HM-277D. Reported abundances for organisms in HM-277D ranged from 0.02-26% and are shown in red. Several organisms contained the same relative abundances and are shown as a single dot. Abundance as determined by species-specific sequence reads from SEC-MC were plotted against the reported abundance (black).
0.001
0.01
0.1
1
10
100
0.0001
0.001
0.01
0.1
1
10
100
R
eported
A
bun
dance
o
f
HM
-277D
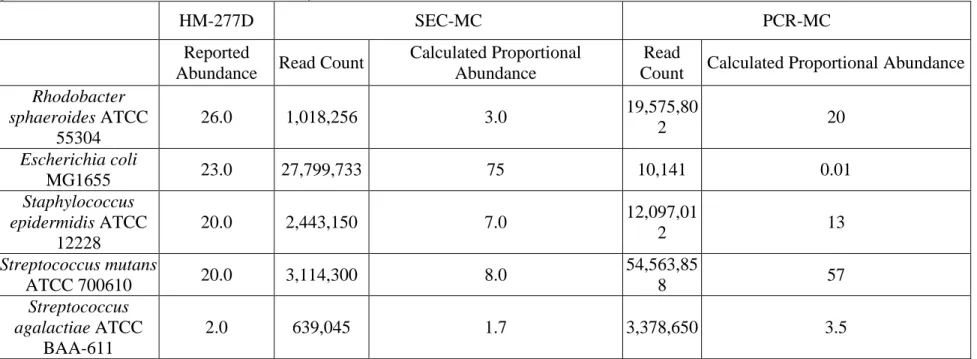
Table 3.3 Abundances based on read counts from SEC captured 16S rRNA genes and PCR amplification of V3-V5 of the 16S rRNA genes from the HM-277D mock community.
HM-277D SEC-MC PCR-MC
Reported
Abundance Read Count
Calculated Proportional Abundance
Read
Count Calculated Proportional Abundance
Rhodobacter sphaeroides ATCC 55304 26.0 1,018,256 3.0 19,575,80 2 20 Escherichia coli MG1655 23.0 27,799,733 75 10,141 0.01 Staphylococcus epidermidis ATCC 12228 20.0 2,443,150 7.0 12,097,01 2 13 Streptococcus mutans ATCC 700610 20.0 3,114,300 8.0 54,563,85 8 57 Streptococcus agalactiae ATCC BAA-611 2.0 639,045 1.7 3,378,650 3.5
(Table 3.3 continued) HM-277D SEC-MC PCR-MC Reported Abundance Read Count
Calculated Proportional Abundance Read Count
Calculated Proportional Abundance
Bacillus cereus ATCC 10987 2.0 705,998 1.9 2,174,690 2.3 Clostridium beijerinckii ATCC 51743 2.0 146,201 0.40 2,608,138 2.7 Pseudomonas aeruginosa ATCC 47085 2.0 160,223 0.40 233 0.0002 Staphylococcus
aureus ATCC
BAA-1717 2.0 508,864 1.0 832,786 0.90 Helicobacter pylori ATCC 700392 0.20 69,727 0.20 114 0.0001 Propionibacterium acnes KPA 171202 0.20 35,954 0.10 18,949 0.02 Acinetobacter baumannii ATCC 17978 0.20 138,276 0.30 45 0.00004
(Table 3.3 continued) HM-277D SEC-MC PCR-MC Reported Abundance Read Count
Calculated Proportional Abundance Read Count
Calculated Proportional Abundance
Neisseria meningitides ATCC 13091 0.20 3,979 0.01 297 0.0003 Listeria monocytogenes ATCC BAA-679 0.20 131,354 0.40 261,653 0.30 Lactobacillus gasseri ATCC 33233 0.20 8,561 0.02 484 0.0005 Deinococcus radiodurans R1 ATCC 13939 0.02 3,312 0.01 219 0.0002 Streptococcus pneuomoniae ATCC BAA-334 0.02 15,590 0.04 25,577 0.03 Bacteroides vulgatus ATCC 8482 0.02 239 0.006 19 0.00002 Enterococcus faecalis ATCC 47077 0.02 19,388 0.05 238,461 0.02 Actinomyces odonotolyticus ATCC 17982 0.02 146,074 0.40 816 0.0008
Note: Abundances values are reported as percent. Relative abundance of HM-277D mock community are reported according to number of 16S rRNA genes. Proportional abundances were calculated by dividing the number of species-specific sequence reads by the total number of unique sequence reads generated by each methodology. The relative abundance, as reported by BEI Resources, of each species found in HM-277D is also reported.
Reads were considered species-specific if they exhibited at least 97% identity over 97% of the sequence read length when compared to reference 16S rRNA genes, provided those reads only mapped to one species’ 16S rRNA gene. This approached excludes reads corresponding to conserved regions of the 16S rRNA gene, permitting unequivocal association of a given read with a species in HM-277D. Even though only 36.3% of the SEC-MC dataset mapped uniquely to individual 16S rRNA genes from 277D, reads identifying each species within the HM-277D community were found within the captured fragments. The SEC protocol successfully retrieved identifiable portions of the 16S rRNA genes from all 20 organisms within HM-277D regardless of their relative abundance in the mock community. Reads ranged from 239
Bacteroides vulgatus-specific counts to 27,799,733 Escherichia coli-specific counts (Table 3.3). Since only 36% of SEC-MC mapped specifically to 16S rRNA genes, reads from this dataset were also mapped against the entire HM-277D mock community using CLC. This approach was taken to determine the fraction of reads clearly identifiable as part of this mock community and to characterize their distribution within the mock community. Sequence reads that shared 80% identity over 80% of the sequence read length were mapped without regard to whether they were found in more than one species within the mock community. The relaxed mapping parameters permitted identification of reads shared between organisms, including the conserved regions of the 16S rRNA gene. Using the relaxed parameters, 93% of the SEC-MC dataset could be unequivocally mapped to sequences within the genomes of the 20 organisms that are HM-277D (Figure 3.2).
Figure 3.2The distribution of sequence reads within the SEC-MC dataset. The SEC-MC dataset was mapped against all genome sequences making up HM-277D mock community using CLC Genomics Workbench.
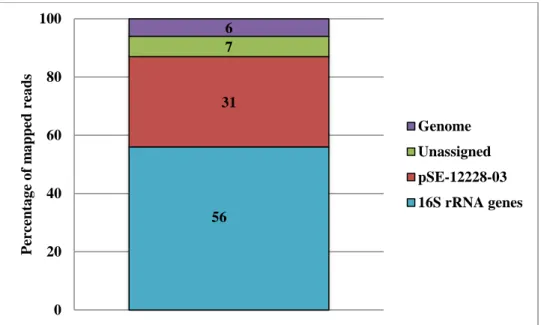
The remaining 7% could not be assigned to a HM-277D genome sequence. These unassigned sequences were either too short, or the sequences did not match to a genome sequence with 80% identity. It is assumed that these sequences are artifacts of sequencing library preparation. Of the sequence reads that did map to the genome, the majority (56% of dataset) was associated with a variable or conserved region of the targeted loci – the 16S rRNA genes (Figure 3.2). In contrast to the low backgrounds observed during capture of the gltS
sequence (Tables 3.1 and 3.2), 37% of the SEC-MC dataset mapped to other parts of the HM-277D mock community. Most of the apparent carryover (31% of the SEC-MC dataset) mapped to a single 8,007 bp plasmid (pSE-12228-03) found in S. epidermidis ATCC12228. The
excessive amount of plasmid-derived sequences did not suggest a non-specific interaction; ATCC12228 carries six circular plasmids, four of which are under 8,100 bp, and only pSE-12228-03 appeared in this abundance in SEC-MC. Examination of pSE-pSE-12228-03 sequence revealed considerable complementarity between the biotinylated primer used to capture the 16S
31 7 6 0 20 40 60 80 100 Per centa g e o f m a p p ed rea d s Genome Unassigned pSE-12228-03 16S rRNA genes 56
rRNA gene and this plasmid that was not identified before attempting SEC. Fourteen of the 18 bases that make up the capture primer anneal perfectly to the plasmid, including the eight bases that comprise the 3´ end of the capture primer. It is assumed that the conditions for annealing the biotinylated primer during SEC allowed pSE-12228-03 to be captured and recovered during the protocol. To our knowledge, the copy number of pSE-12228-03 has not been characterized, and reasons for the number of pSE-12228-03-derived reads in SEC-MC was not investigated.
The remaining 6% of the SEC-MC dataset aligned to chromosomally encoded loci that were not found within a 16S rRNA gene or pSE-12228-03. For most of these sequences, there is no pattern to their distribution within the mock community, indicating they were non-specifically carried through to sequencing. However, almost 350,000 reads (approximately 0.34% of the recovered sequence reads) mapped to regions directly upstream of 16S rRNA genes. These are the only locations where the concentration and distribution of sequence reads argues against low levels of non-specific carryover. These sequences are presumably derived from long
biotinylated DNA fragments created during linear amplification that were captured with the 16S rRNA genes, reflecting SEC’s ability to retrieve downstream sequence adjacent to the capture primer binding site.
Table 3.3 compares the reported abundance in HM-277D with a proportional abundance calculated from the number of species-specific read counts obtained from SEC-MC; the table is organized from the most to the least abundant member of the community. Figure 3.1 plots this information. The red symbols identify the values for reported abundance; there are four distinct levels of abundance present in HM-277D, each level differing by approximately an order of magnitude. Since the reported values for 18 of the 20 organisms in the mock community are given as either 0.02, 0.2, 2, or 20% only six red symbols appear on the graph. The black